
Abstract
This article re-examines the effects of culture on national innovation rates. Pointing to the innovation success of some East Asian countries, it argues that the cultural dimension of individualism is not able to fully account for the role of culture in national innovativeness, and there is a need to include a wider set of cultural factors in the analysis. Several competing measures of national innovation performance over the last decade and Hofstede’s measures of culture, as well as their recently revised versions proposed by Minkov and collaborators, are employed to test the hypotheses. The findings show that, apart from individualism, long-term orientation, and flexibility, the dimensions omitted in the prior studies are positive and strong cultural predictors of national innovation intensity, whereas the role of other cultural factors finds little empirical support. The study suggests that there is no single pattern for the impact of culture on national innovation rates that should be taken into account in seeking effective innovation strategies and policies. It also highlights the need to advance the understanding of the causal mechanism between culture and innovativeness to guide further theoretical and empirical analysis.
Introduction
Innovation has become an imperative for growth and survival of economies, industries, and companies. More and more money and effort is spent by entrepreneurs and governments on promoting innovation through investments in research, infrastructure, and knowledge transfer. It has been shown, however, that there are also cultural factors that should be taken into account if the differences in innovation rates across multiple countries are to be explained. There is strong empirical evidence that national culture influences specific areas of innovation production and adoption (Harrison & Huntington, 2000; Jones & Davis, 2000; Kumar, 2014; Lynn & Gelb, 1996; Nakata & Sivakumar, 1996; Tiessen, 1997; van Everdingen & Waarts, 2003; Williams & McGuire, 2010, etc.). Culture also matters as a facilitator or inhibitor of innovation performance measured at the national level, with the most robust findings being the positive effects of the cultural dimension of individualism and negative consequences of collectivism (Rinne, Steel, & Fairweather, 2012; Shane, 1992, 1993; Taylor & Wilson, 2012). Indeed, ever since Schumpeter’s (1934) analysis of entrepreneurship, innovativeness has commonly been regarded as fueled by the energy of individuals, and conventional wisdom has been inspired by star entrepreneurs, inventors, and scientists as contributors to national innovation success.
However, the domination of the individualism–collectivism dimension in the existing studies may obscure the role of other cultural factors. Although there are also empirical findings indicating the negative influence of power distance and mixed results concerning the effects of uncertainty avoidance, the newer dimensions of Hofstede’s model of national cultures have not been used in analysis of innovation rates at the national level (Rinne et al., 2012; Shane, 1992, 1993; Taylor & Wilson, 2012). Importantly, as the innovation success of some East Asian countries cannot be attributed to high individualism, low power distance, or low uncertainty avoidance, this suggests that research concentrating on these factors offers only a limited insight into the culture–innovation relationship at a national level and has not kept up with the changing economic landscape. Given the vast efforts to promote innovation undertaken by companies and governments, there is an urgent need for a more comprehensive understanding of the cultural impact on national innovativeness. Furthermore, since the initial research in this field, there has been an improvement in measurement of both innovation activity at the national level and cultural variables. The tradition of concentrating almost solely on R&D intensity has been changing toward encompassing non-R&D and incremental forms of innovation, also pointing out their adequacy for global analysis (Burns, Machado, & Corte, 2015a, 2015b, 2016; Ghazinoory, Bitaab, & Lohsrabi, 2014; Howaldt & Schwarz, 2010; Mulgan, Tucker, Rushanara, & Sanders, 2007; Organization for Economic Co-operation and Development [OECD] & Statistical Office of the European Communities [SOEC], 2005; Westwood & Low, 2003). Furthermore, the recent major study (Minkov, 2017; Minkov, Bond et al., 2017; Minkov, Dutt et al., 2017) suggesting fundamental revisions to Hofstede’s measures (that were employed in all prior studies of the effects of culture of national innovation intensity) signals the need to update the empirical evidence for the culture-innovation relationship.
This article contributes to the discussion on cultural sources of national innovation intensity in several ways. First, we provide a rationale for including a larger set of cultural variables, especially, long-term orientation and indulgence (the newest dimensions in Hofstede’s model of culture), as potential stimulators of national innovation activity. To do so, we draw extensively upon innovation research showing how culture influences innovation activity at the level of individuals, informal groups, organizations, and the state, affecting both the demand and supply of innovations. Second, we test our hypothesis using several competing measures of national innovation activity, related to both a narrow (R&D rates) and broad (non-R&D) understanding of it, as well as triangulating on the cultural variables by using both Hofstede’s measures and their latest revision (Minkov, 2017). Third, we re-assess the use of economic and policy controls in the culture–innovation studies, arguing that some of them should be treated as mediators of the influence of culture at the national level and employ them as such in our analysis.
Culture and Innovation—Literature Review
Definitions of culture abound, and to make even a brief mention of them all here would be both an unnecessary and an impossible endeavor. It should be noted, however, that it was Hofstede’s broad understanding of culture, regarded as “software of the mind” reflecting a country’s “central tendencies in terms of values, beliefs, and preferences” (Hofstede, Hofstede, & Minkov, 2010; Taylor & Wilson, 2012, p. 236), that gained by far the greatest popularity in studies of the culture–innovation relationship. Hofstede developed his—initially four dimensional and later expanded—model of national cultures based on extensive empirical research conducted in the late 1960s and early 1970s in 72 countries. One of the assets of his work was “unpackaging” of culture, which had earlier often been treated as an overwhelming entity—important but difficult to measure quantitatively (Minkov & Hofstede, 2011, p. 11). In spite of the criticism that his work also received (e.g., Baskerville, 2003; Fang, 2003; McSweeney, 2002; Minkov, 2017; Taras, Steel, & Kirkman, 2012; Yeh & Lawrence, 1995), which we discuss below in more detail, his model has remained widely used within a range of disciplines, including all the existing studies on the effects of culture on innovation performance and inspired the appearance of other measures of culture in the next decades (House, Hanges, Javidan, Dorfman, & Gupta, 2004; Inglehart, Basanez, & Moreno, 1998; Schwartz, 2006; Trompenaars & Hampden-Turner, 1998).
The issue of the relationship between cultural values measured by Hofstede and innovation rates at the national level was first tackled by Shane (1992), who showed that there is a strong relationship between national inventiveness (measured as per capita numbers of inventions patented) and Hofstede’s cultural variables of power distance (negative correlation) and individualism (positive correlation). In his next study, Shane (1993) indicated that cultural dimensions of power distance and uncertainty avoidance were negatively related to innovativeness (per capita numbers of trademarks), whereas individualism correlated positively (the correlations were significant even when controlling for economic factors). Two decades later, Taylor and Wilson (2012) re-examined the relationship between culture and innovation rates, triangulating both the cultural variable of individualism (Hofstede, 2001; House et al., 2004; Schwartz, 2006) and innovation statistics (per capita figures of technology patents and citation-weighted science-engineering publications). Their findings generally confirmed that individualism is strongly and positively related (and collectivism is strongly and negatively related) to innovation, even when controlling for economic variables. However, using House et al.’s (2004) measures of collectivism and Schwartz’s (2006) dimensions of individualism, they showed that some aspects of collectivism (i.e., institutional collectivism reflecting patriotism or nationalism) may actually foster innovativeness, whereas intellectual autonomy, an aspect of individualism related to curiosity and creativity, actually has little effect on national innovation. Taken together, Taylor and Wilson’s findings indicated that although the effects of culture are evident, our current understanding of the culture–innovation relationship may be too simplistic and still have some important gaps to be filled. Rinne et al. (2012) also attempted to assess the role of cultural factors on national innovativeness, using the Global Innovation Index as a composite measure of national innovativeness and three cultural variables from Hofstede’s model. In the multiple regressions, they were able to show that individualism is strongly and positively related, and power distance strongly and negatively related to innovation, whereas uncertainty avoidance turned out to be insignificant. No economic controls, however, were applied to examine the robustness of the results.
The findings from extensive cross-cultural research showing the relationship between culture and national innovation performance in a global context have received support from a number of studies focusing on specific aspects of innovation processes: models of organizational leadership, promoting innovation and process management (Elenkov & Manev, 2005; Lin, 2009; Shane, Ventakamaran, & MacMillan, 1995), impact of national culture on R&D performance (Allred & Swan, 2004; Ambos & Schlegelmilch, 2008), adoption and diffusion of innovation—on the mass and business-to-business market (de Mooij & Hofstede, 2010; Griffith & Rubera, 2014; Lee, Trimi, & Kim, 2013; Lynn & Gelb, 1996; Rubera, Griffith, & Yalcinkaya, 2012; Steenkamp, Hofstede, & Wedel, 1999; Tellis, Stremersch, & Yin, 2003; van Everdingen & Waarts, 2003; Yalcinkaya, 2008), product development (Kumar, 2014; Nakata & Sivakumar, 1996), and product life cycle (Chandrasekaran & Tellis, 2008; Tellis et al., 2003). The results at the organizational level are generally in congruence with the pattern observed in the studies at the national level, although the former offer a more balanced outlook regarding the different effects that cultural factors may have on different stages of innovation processes, and distinguishing between the supply side and demand side of innovation. Some of them also show the effects of Hofstede’s newer dimensions of long-term orientation (previously labeled as Confucian dynamism) and indulgence, making them interesting candidates for factors influencing innovativeness as well, at the national level.
Although convincing in confirming the influence of culture, the prior studies on the effects of cultural factors on national innovation rates suffer from several important shortcomings. First, the concentration on the role of individualism–collectivism and low power distance seem unable to explain the current landscape of national innovativeness and the position of highly innovative countries with relatively low individualism and high power distance (which is the case, especially, in some East Asian countries). Arguably, the focus on individualism may be a reflection of the cultural bias imposing universalistic interpretations, and thus inhibiting the understanding of the cultural sources of innovation activities outside the Western world. This tendency seems to ignore the findings from the studies on the specific aspects of innovation processes (cited below in “Theory and Hypothesis” section), showing that they may also be influenced by Hofstede’s long-term orientation and indulgence. Second, the existing studies rely mostly on relatively old data. When it comes to the national innovation rates, apart from the study by Rinne et al. (2012), data from the 1960s, 1970s, 1980s, and 1990s is employed. As regards the cultural variables, Hofstede’s newly added dimensions and the newest revision of Hofstede’s model by Minkov and collaborators (Minkov, 2017) have not yet been utilized. Fourth, each of the prior studies utilizes only a limited number of the measures of national innovation intensity, which is problematic given that innovation is complex and difficult to measure quantitatively. Fifth, the existing studies emphasize the psychological and intra-organizational consequences of culture on national innovativeness, rather disregarding the role of such macrofactors as cultural traditions or state policies, which seem to play an important role in national level innovativeness. We tried to overcome these shortcomings in our research.
Theory and Hypothesis
We use the term “national innovativeness” as reflecting national innovation rates, that is, the output of innovation activity within the boundaries of a nation state. Without aiming to intervene in the long discussion on what innovation is, we assume that it is an ambiguous and complex phenomenon, the complexity being not only conceptual (e.g., differentiation between technological and nontechnological, radical, and incremental innovations) but also stemming from the variety of processes innovation entails (invention, implementation, diffusion, and so on; Nakata & Sivakumar, 1996; Ramella, 2016; Rogers, 1995). Given this complexity, we assume that national innovation output may take different forms (R&D and non-R&D] and be affected in a number of ways by cultural factors operating at the micro- (individuals’ traits and behaviors), meso- (organizational), and macrolevel (national culture, state, institutional environment), as well as on the demand and supply side of innovation processes. Drawing on the existing studies, which we discuss below, we attempt to offer a comprehensive outlook on the ways the specific dimensions of culture may influence innovation intensity and justify the use of a wider set of cultural measures.
Power Distance
Power distance (PDI) is a dimension of culture reflecting the acceptance of unequal distribution of power and preference for a dependence relationship between subordinates and superiors (Hofstede et al., 2010, p. 61). High power distance nations (like Russia and Mexico) expect and accept unequal distribution of power, whereas low power distance countries (like Sweden and Austria) value equality, decentralization, and dialogue. In previous studies, power distance has been regarded as strongly and negatively related to innovation rates (Halkos & Tzeremes, 2013; Rinne et al., 2012; Shane, 1992, 1993).
As far as the individual level is concerned, high power distance enforces a generalized respect for elders (such as parents or teachers), whereas low power distance is related to treating children as equals, encouraging their independence and active experimentation, acceptance of asking questions, and expressing criticism and disagreement in school (Hofstede et al., 2010, pp. 67-70). High power distance was also shown to be related to lower customer information and communication technology (ICT) adoption (Erumban & de Joong, 2006), and generally to the lower adoption of new products (Kumar, 2014).
Most interpretations, however, highlighted the negative effects of large power distance at the organizational level: desirability of hierarchy, vertical communication patterns, a lack of informal communication, centralization of power, control over subordinates (instead of trust), importance of detailed instructions, resistance to changes in the distribution of power, fatalism, and a weak work ethic (Shane, 1992, 1993) In large power-distance cultures, there is also a tendency toward privileging superiors, an emotional relationship between subordinates and bosses, and difficulty in approaching or contradicting superiors (all of which may hinder innovation processes), whereas low power distance was found to promote organizational effectiveness at tasks demanding a subordinate initiative (Hofstede et al., 2010, pp. 73-75), which generally supports innovation.
There is, however, some discrepancy in the studies concerning technology adoption (i.e., the demand side of innovation) for operational activities in enterprises. Vecchi and Brennan (2009) indicated that power distance has a positive impact on innovation inputs (such as employing technology), whereas van Everdingen and Waarts (2003) suggested a lesser tendency in high power distance cultures to identify operational problems and tackle them by adopting new technologies. There are also studies that link high power distance to success in adopting innovations (Jones & Davis, 2000; Rank, Pace & Frese, 2004), a positive impact on later stages of new product development (Nakata & Sivakumar, 1996), and spurring incremental innovation (Ambos & Schlegelmilch, 2008).
At the national level, small power distance has been shown to be accompanied by more modern technology, urban living, and social mobility, as well as a better educational system (Hofstede et al., 2010, p. 86), all of which promote innovation:
Individualism
According to Hofstede, in more individualistic cultures (such as the United States or United Kingdom), ties between people are loose, whereas in collectivist cultures (such as Colombia or Pakistan), individuals “are integrated into strong, cohesive in-groups, which throughout people’s lifetime continue to protect them in exchange for unquestioning loyalty” (Hofstede et al., 2010, p. 92). The central value in a culture of individualism is personal freedom and autonomy, whereas in collectivist cultures, it is conformity to the norms of the group.
Individualism (IND) has been regarded as the cultural factor with probably the strongest links to national innovativeness, as shown empirically by Shane (1992, 1993), Taylor and Wilson (2012), and Rinne et al. (2012). At the microlevel, high individualism may promote innovation by the cultural tendency to emphasize individual achievements, independence, nonconformism, self-actualisation, encouragement to speak one’s mind freely, allowing open discussion and confrontation, as well as individual possession of resources (Hofstede et al., 2010, pp. 106-130). According to Shane (1992), individualism is related to a general orientation to growth and personal traits that accompany entrepreneurship, inventiveness, and innovativeness. On the demand side of innovation, it was shown that individualism strengthens the positive effect of design innovation on market shares, which was interpreted as resulting from the individualistic striving for social differentiation achievable through design innovation (Griffith & Rubera, 2014). Furthermore, in individualistic cultures, consumers are more likely to act as independent decision makers or to seek product information on their own and from formal sources (Lee et al., 2013) and are generally more receptive toward new products (Kumar, 2014; Lynn & Gelb, 1996).
At the organizational level, the effects on individualism are less clear. It was shown that individualism fosters innovation by allowing more freedom to managers and employees, providing a more tolerant environment and incentives for future innovators and correlation with preference for small organizations with more flexibility, shorter lines of communication, and lower levels of work alienation (Hofstede et al., 2010; Shane, 1993, pp. 106-130; Taylor & Wilson, 2012). Nakata and Sivakumar (1996) suggest that high individualism fosters the positive role of innovation champions as well as technical and business innovators, but mostly during the initiation phase of new product development. Vecchi and Brennan (2009) argue that collectivism promotes strategies of imitation and fosters innovation processes but hinders radical product innovation. It has also been shown that high individualism helps diffusion process of business-to-business products, but only for early adopters (van Everdingen & Waarts, 2003).
Regarding the macroenvironment, there is a positive relationship between individualism and per capita gross national income (GNI), a restrained role of the state in the economy, greater social mobility, and dominance of ideas of economic freedom over ideologies of equality (Hofstede et al., 2010, pp. 125-130). It should be noted, however, that although there is indeed a strong correlation of per capita GNI with national innovativeness, the other factors represent rather a tendency toward neoliberal policy than innovation success per se. There is also a possibility that the conventional narrative of innovation resulting from the secluded efforts of outstanding entrepreneurs, inventors and scientists, and visionaries, which is clearly a reflection of individualistic culture, may underpin not only individuals’ motivation but also government policies, legal acts, distribution of economic rewards, educational systems, and so on:
Masculinity
Masculinity–femininity (MAS) refers to gender differences: in masculine societies (such as Japan and Venezuela), gender roles are distinct (men are expected to be assertive, tough, and materialistic, whereas women are supposed to be modest and gentle), whereas in feminine societies (such as Norway and Denmark), gender roles overlap. In masculine cultures, challenge, earnings, recognition, and advancement are important values, whereas in feminine ones, relationships and quality of life are of primary importance (Hofstede et al., 2010, pp. 138-155).
Previous studies on the possible influence of this aspect of culture on national innovativeness brought mixed findings. Although one cross-cultural study on national innovativeness reported a positive correlation between masculinity and innovation rates (Halkos & Tzeremes, 2013), other research (Shane 1992, 1993; Rinne et al., 2012) has found this relationship to be statistically insignificant. Regarding consumer behaviors, a positive correlation was found between masculinity and consumers’ propensity to buy new things to show individual wealth and success, which helps in introduction of new products (Steenkamp et al., 1999). However, the predicted shorter time-to-take-off of new products in masculine societies was not empirically confirmed (Tellis et al., 2003).
At an organizational level, it was theoretically argued that high masculinity should be supportive of innovativeness because of its emphasis on the task, achievement, reward, acceptance of competition, and conflict (Jones & Davis, 2000) or alternatively that masculinity promotes only the implementation phase of new product development, whereas femininity positively affects the initiation stage (Nakata & Sivakumar, 1996). Arguably, as management generally requires dealing with not only technical but also human problems (Hofstede et al., 2010, p. 150), it may also apply to the management of innovation processes. It may also be argued that the masculine tendency toward ego-boosting and open competition may impede innovation processes that depend greatly on communication, information sharing, and cooperation. Furthermore, empirical research on companies’ innovativeness (Allred & Swan, 2004) and their adoption of new technologies (van Everdingen & Waarts, 2003; Waarts & van Everdingen, 2005) has shown the negative effects of masculinity.
At the state level, it was found that governments in masculine societies give priority to growth, whereas in feminine cultures, conservation of our living environment is more important (Hofstede et al., 2010, p. 174). Despite this difference, it may be argued that both strategies could be supportive for innovation, although presumably in different industries. In sum, the mixed theoretical assumption and empirical findings could be interpreted as showing the actual complexity of the relationship between masculinity and innovativeness. However, it seems that as yet there are not enough data to determine any direction of these relationships at a national level:
Uncertainty Avoidance
Uncertainty avoidance (UAI) stands for “the extent to which the members of a culture feel threatened by ambiguous or unknown situations” (Hofstede et al., 2010, p. 191). High uncertainty avoiding countries include Greece and Belgium, and examples of low uncertainty avoiding ones are Sweden and Singapore. The negative effect of high uncertainty avoidance on innovativeness seems to be primarily related to lower tolerance of changes initiated by innovations in high uncertainty avoidance cultures. Yet the prior studies yielded mixed results concerning the effect of uncertainty avoidance on national innovation success. Although it was the factor with the strongest and negative correlation in Shane’s (1993) study, this finding was not confirmed by Rinne et al. (2012), who, unlike Shane, include all four cultural dimensions in one multiple regression model.
It is generally assumed that the uncertainty related to adoption of new products and services increases in high uncertainty avoiding countries (Rogers, 1995; Rubera et al., 2012; Yalcinkaya, 2008). Uncertainty avoidance has a negative relationship with consumers’ behaviors related to new products (such as mobile telephones, email, the Internet) and information (Hofstede et al., 2010, p. 207), adoption of information and communication technologies (Erumban & de Joong, 2006), and penetration of technical consumer durables (Lynn & Gelb, 1996). Tellis et al. (2003) also showed that in low uncertainty avoidance countries, the time between introducing a new product to the take-off in sales is shorter than in high uncertainty avoidance cultures.
At the organizational level, it was argued that as innovation (especially radical) may require violation of organizational and societal norms at early stages of the innovative process, low uncertainty avoidance may foster such behaviors (Williams & McGuire, 2010, p. 399). Elenkov and Manev (2005) found that high uncertainty avoidance is negatively related to top managers’ influence on the product/market and organizational innovation. Shane et al. (1995) showed that high uncertainty avoidance constrains the role that employees play in innovation processes. The adoption of Enterprise Resource Planning (ERP) software (van Everdingen & Waarts, 2003, 2005) is slower in high uncertainty avoidance countries, which illustrates the role of this dimension on the demand for business-to-business products.
At the national level, apart from Shane’s (1993) study, uncertainty avoidance was also found to be the strongest cultural factor related to national innovativeness measured by the European Innovation Scoreboard (Halkos & Tzeremes, 2013). With regard to the institutional level, there is also extensive evidence showing that uncertainty avoidance is positively related to the precision of codified law, the duration of civil procedures, and the level of corruption and has a negative effect on trust in a country’s politicians (Hofstede et al., 2010, pp. 216-223), all of which are important in innovation activities. It was also argued that countries high in uncertainty avoidance will try to protect themselves from the effects of rapid global economic and technology changes by such actions as protectionism, trade barriers, or nationalism, which are regarded as hindering competition and innovation (Allred & Swan, 2004, p. 86):
Long-Term Orientation
As a result of his collaboration with Michael Bond, Hofstede added a fifth dimension, Confucian work dynamism, to his initial, four-dimensional model (Hofstede et al., 2010, pp. 235-259). This dimension was later reconstructed and labeled as long-term versus short-term orientation. According to Hofstede, long-term orientation (LTO) is associated with a cultural tendency to attribute value to virtues oriented toward future rewards, such as perseverance and thrift. Short-term orientation reflects promoting values related to the past and present, such as respect for tradition and protection of “face.” Long-term-oriented nations include China and Germany, whereas Egypt and Iran are among the short-term-oriented ones. It should be noted that the appearance of the new dimension aroused some criticism (Ashkanasy et al., 2004; Fang, 2003; Yeh & Lawrence, 1995), which was followed by the conceptual and empirical reconstruction of long-term orientation in the later edition of Hofstede’s book (Hofstede et al., 2010). We discuss the criticism in more detail in the “Method” section of the article, here focusing on relating to studies of the culture–innovation relationship that utilised Hofstede’s measure.
At the individual level, there is some evidence that psychological characteristics similar to thrift and perseverance may influence innovativeness. Steel, Rinne, and Fairweather (2012) discussed the positive relationship between innovativeness and conscientiousness—a psychological factor closely related to persistence, responsibility, and achievement orientation. Although thrift, perseverance, and conscientiousness are not commonly related to innovation processes, their influence may be crucial “to bring the invention to successful adoption” (Steel et al. 2012, p. 8) through the development and implementation phase (Anderson, Potočnik, & Zhou, 2014). It was also found that leaders’ conscientiousness can influence successful product development (Aronson, Reilly, & Lynn, 2008) and that higher scores on the conscientiousness scale meaningfully distinguish entrepreneurs from managers as more related to achievement motivation (Zhao & Seibert, 2006).
The effects of long-term orientation on consumers’ demand and new product adoption seem to be more complex. Yalcinkaya (2008) argued that long-term-oriented cultures promote a slow adaptation of novel concepts, whereas short-term-oriented ones motivate individuals to keep up with trends through adopting new products to gain a higher status and recognition. Furthermore, the time-to-take off of new products is generally slower in Confucian Asia than in Nordic Europe, Anglo-America, and Germanic Europe (Chandrasekaran & Tellis, 2008). Yet this may be the result of a different, imitation mode of ICT adoption, which is dominant in collectivistic, uncertainty avoiding, and long-term-oriented countries, where the adoption rate significantly increases after a relatively long period of orientation during which the social perception of a new technology is established (Lee et al., 2013).
At the organizational level, there is even more evidence of the relationship between long-term orientation and innovativeness. It was shown that Confucian dynamism (the predecessor of long-term orientation) correlates with companies’ R&D intensity (Allred & Swan, 2004). High long-term orientation is thought to facilitate both the initiation and the implementation stage (Nakata & Sivakumar, 1996), also through enhancing a strong work ethic (Lin, 2009). In high long-term orientation countries, companies are more likely to adopt business-to-business innovation (van Everdingen & Waarts, 2003; Waarts & van Everdingen, 2005) and generally accept new ideas perceived as useful (Tajeddini & Trueman, 2012). The latter finding is in line with Hofstede’s observation that long-term-oriented countries give priority to common sense, synthetic thinking, and close contact with reality over abstract, analytical rationality, and cognitive consistency (Hofstede et al., 2010, pp. 248-251).
Long-term orientation also seems to be related to organizational cultures that may facilitate innovativeness of companies: the kaisen model of co-operation focused on constant adaptation to changes by making series of small improvements in all aspects of business activity (Ouchi, Suzuki, 1993); the Japanese J-form type of organizational culture, combining the stability of a bureaucracy with the flexibility of market-oriented firms (Lam, 2000); the deutsche Modell of production, popular in German-speaking countries, characterized by emphasizing the values of proficiency, self-discipline, and responsibility toward a professional community called a Beruf (Lash, 1994).
Yet perhaps the strongest argument for inclusion of long-term orientation in cross-cultural analysis of innovation performance is the unquestionable economic success of East Asian countries in recent decades, also in innovation activity. Neo-Confucian arguments (Bell, 2008) have received empirical support from Hofstede’s studies on long-term orientation, showing how Confucian values, together with the inflow of Western technologies and the tendency of local economies to open up for global trade resulted in the unprecedented economic development of East Asia (Hofstede et al., 2010, pp. 262-267; Minkov & Hofstede, 2012, p. 8). A vivid example of how long-term orientation may influence innovation at the institutional environment level is China’s innovation policy, which made this country a leader of economic growth in the region (Ozawa, 2010; Palma, 2009). Apart from the size of expenditure on R&D in recent years (more than 2% of China’s GDP), there have been a variety of activities stimulating national innovation advancements, such as supporting native innovations as the basis of strategy of endogenous development (China Investment Corporation), promotion of China entrepreneurs abroad, establishing domestic R&D networks, creating R&D networks with the most developed technological centers in the world, and attracting foreign high-tech investments and well-trained experts from the Chinese diaspora (Chen, Luo, & Zhang, 2011; Saxenian, 2007). Similar policies were introduced in South Korea and Taiwan, aimed at overcoming entry-related obstacles for global trade and high-tech investors (Rodrik, 2007). The role of state policies in high long-term orientation countries may also lie in providing infrastructure such as broadband penetration, which requires significant investment (De Mooij, 2010; de Mooij & Hofstede, 2010, p. 90), and stimulating the consumer demand for technological goods by providing subsidies (Lee et al., 2013, p. 27). All these policy efforts were characterized by pragmatism, caution, experimenting, flexible accommodation, and long-term orientation.
On the other side of the globe, in continental Europe, one may also observe a substantial effort toward establishing national innovation policies (Arnold, 2004). In this region, there is a general assumption that innovation policy is a matter of public interest (not only of particular companies) and innovation efforts are actively supported by the highly trained civil service. This way of thinking seems to be deeply rooted in the German (a high long-term orientation country) model of state, where economic activity is subordinated to public interests (Drechsler, 2009; Drechsler & Kattel, 2008; Weber, 2002a).
Hence, in spite of the absence of long-term orientation in previous studies on the culture–innovation relationship, we hypothesize it is positively related to national innovation performance:
Indulgence
Indulgence (IVR) reflects the cultural tendency to allow free gratification of those basic human needs that are related to enjoying life and having fun, whereas restraint cultures tend to curb and regulate such gratification by strict social norms (Hofstede et al., 2010: 281). This is the newest cultural dimension in Hofstede’s model of culture, introduced relatively recently after Minkov’s (2009) analysis of World Values Survey data, which may be responsible for the fact that there are few empirical studies on innovation-related activities that use this variable. So far, indulgence has been shown to be negatively correlated with Hofstede’s power distance and GLOBE’s in-group collectivism (Hofstede et al., 2010, pp. 286, 292)—both factors considered as hindering innovativeness (Taylor & Wilson, 2012, p. 241).
We hypothesize that the influence of indulgence on national innovativeness may come mainly from its relationship with the demand for consumer goods. As indulgence is positively related to subjective happiness, the importance of leisure, and optimism and negatively with the importance of thrift (Hofstede et al., 2010), it may possibly stimulate a greater demand for solutions making people’s lives more pleasurable and easier. It has been shown empirically that indulgence is positively correlated with design innovations, which offer satisfaction with their novelty and creativity, yet negatively related to technological innovations providing greater capabilities but also causing some frustration (thus limiting enjoyment) in product use (Griffith & Rubera, 2014). Moreover, emotional autonomy, a dimension of culture proposed by Schwartz (2006, p. 140), reflecting the level to which a society “encourages individuals to pursue affectively positive experience for themselves . . . pleasure, excitement, variation,” and thus bearing an apparent similarity to Hofstede’s indulgence was also shown to be a facilitator of national innovativeness (Taylor & Wilson, 2012).
At the macrolevel, it seems relevant that indulgence is positively related to viewing freedom of speech as an important national goal and negatively correlated with choosing “maintaining order in the nation” (Hofstede et al., 2010, pp. 295-296), and as such may foster the circulation of knowledge and ideas as well as a certain demand of disruption in society, which may help innovation. However, as the upper quartile of high indulgence countries contains those with both a very low intensity (e.g., Latin America) and very high intensity (e.g., Nordic, Anglo-Saxon) of innovation, the influence of indulgence on national innovativeness needs further examination. However, on the basis of most previous studies, we can expect indulgence to support national innovativeness:
Method
The main aim of our study was to advance the understanding of the culture–innovation relationship by testing empirically a wider set of cultural values as potential factors influencing national innovation rates. Given the existing evidence, we asked a simple question: whether other cultural variables than individualism and power distance may have an effect on national innovation intensity. It is important to note, however, that we did not test for the presence of causal mechanisms. We argue that, given their potential complexity, they should rather be a subject of a separate study.
Dependent Variables
Our selection of measures of national innovativeness reflects the fact that innovation is an elusive, complex, and difficult to measure phenomenon, thus a reasonable strategy is to triangulate by using a relatively wide and diverse set of metrics. Although the most commonly used quantitative measures of innovation are based on patent data, they are not free from some important concerns: countries and industries differ in their propensity to patent, rate of patenting is changing over time, patent offices have different policies, truncation in patent citation data is inevitable, and there is no simple way to distinguish patents that lead to radical innovation from the long-tail of those of low importance (Jaffe & de Rassenfosse, 2017; OECD, 2009). Also, as patent data together with scientific publication reflect mostly R&D and research productivity, they may be regarded as weak proxies of non-R&D, not patented, not trademarked, or nontechnological forms of innovation (Jones & Davis, 2000; Kumar, 2014; Rinne et al., 2012). Although patent and research data are still regarded as valuable metrics, there is a gradual shift toward broader and more horizontal understanding of innovation, especially, observable in OECD and European Union (OECD, & SOEC, 2005). This newer understanding, however, also requires new measures, which are difficult to find or construct.
Bearing these challenges in mind, we employed a relatively wide and diverse set of metrics. As patent measures, we chose the per capita number of patent applications (Pats), a raw measure of inventive activity in a country, and the per capita number of triadic patent families (Pat fams), defined as sets of patents registered in three of the major patent offices to protect the same invention and thus being a proxy for inventions of the greatest importance (Dernis & Khan, 2004). As an additional traditional measure of innovation, we used the per capita number of scientific and technical publications (Pubs), reflecting national research intensity and production of new knowledge, which is commonly regarded to be related to innovation rates. As both patents and publications counts are related mostly to technological innovation, we also employed other dependent measures: the per capita number of trademark applications (Tmarks) related to economic activity, that is, the process of introduction of new products to the market, and the per capita number of industrial design applications (Indes), reflecting the intensity of innovations based upon product external appearance and user friendliness, which are increasingly regarded as an important source of competitive advantage in a broad range of industries (Galindo-Rueda & Millot, 2015; Gemser & Leenders, 2001; Rubera et al., 2012).
As all these measures are individual variables reflecting specific aspects of innovation, which are legally protected as intellectual property, we also decided to employ a composite measure encompassing a broader range of innovation activities—country scores on the Innovation Output Sub-Index of the Global Innovation Index (GII output)—as proxies for overall results of innovative activities within the economy (Cornell University, INSEAD, & WIPO, 2014, p. 7). It should be noted, however, that such composite measures of innovation are not free from methodological concerns; the selection of individual variables in particular may be questioned, and it has been shown that scores should not be used as country rankings (Grupp & Mogee, 2004; Janger, Schubert, Andries, Rammer, & Hoskens, 2017). Yet, it is also argued that such measures may be valuable sources of data of innovation intensity if used alongside other measures (Smith, 2005). Importantly, the conceptual framework of the GII represents the broad understanding of innovation, also encompassing its non-R&D, not trademarked, and geographically dispersed forms (Cornell University, INSEAD, & WIPO, 2015, pp. 41-42). Also, the composite indices were employed in the prior studies of the relationship between national culture and innovation rates (the GII by Rinne et al., 2012 and European Innovation Scoreboard by Halkos & Tzeremes, 2013). In addition, we found the GII output to be highly correlated with all other measures of innovation intensity we employed (from .489 for industrial designs to .815 for scientific publications). Therefore, we assumed that it is justified to use this measure for additional triangulation, although emphasizing that it is a conceptually different (broad and composite, not narrow and individual) measure of national innovativeness. Finally, our selection of dependent variables included six measures, with the pair correlations between them ranging from .848 (for patents and publications) to .357 (for patent families and trademarks; (Table 1).
Correlation Matrix.
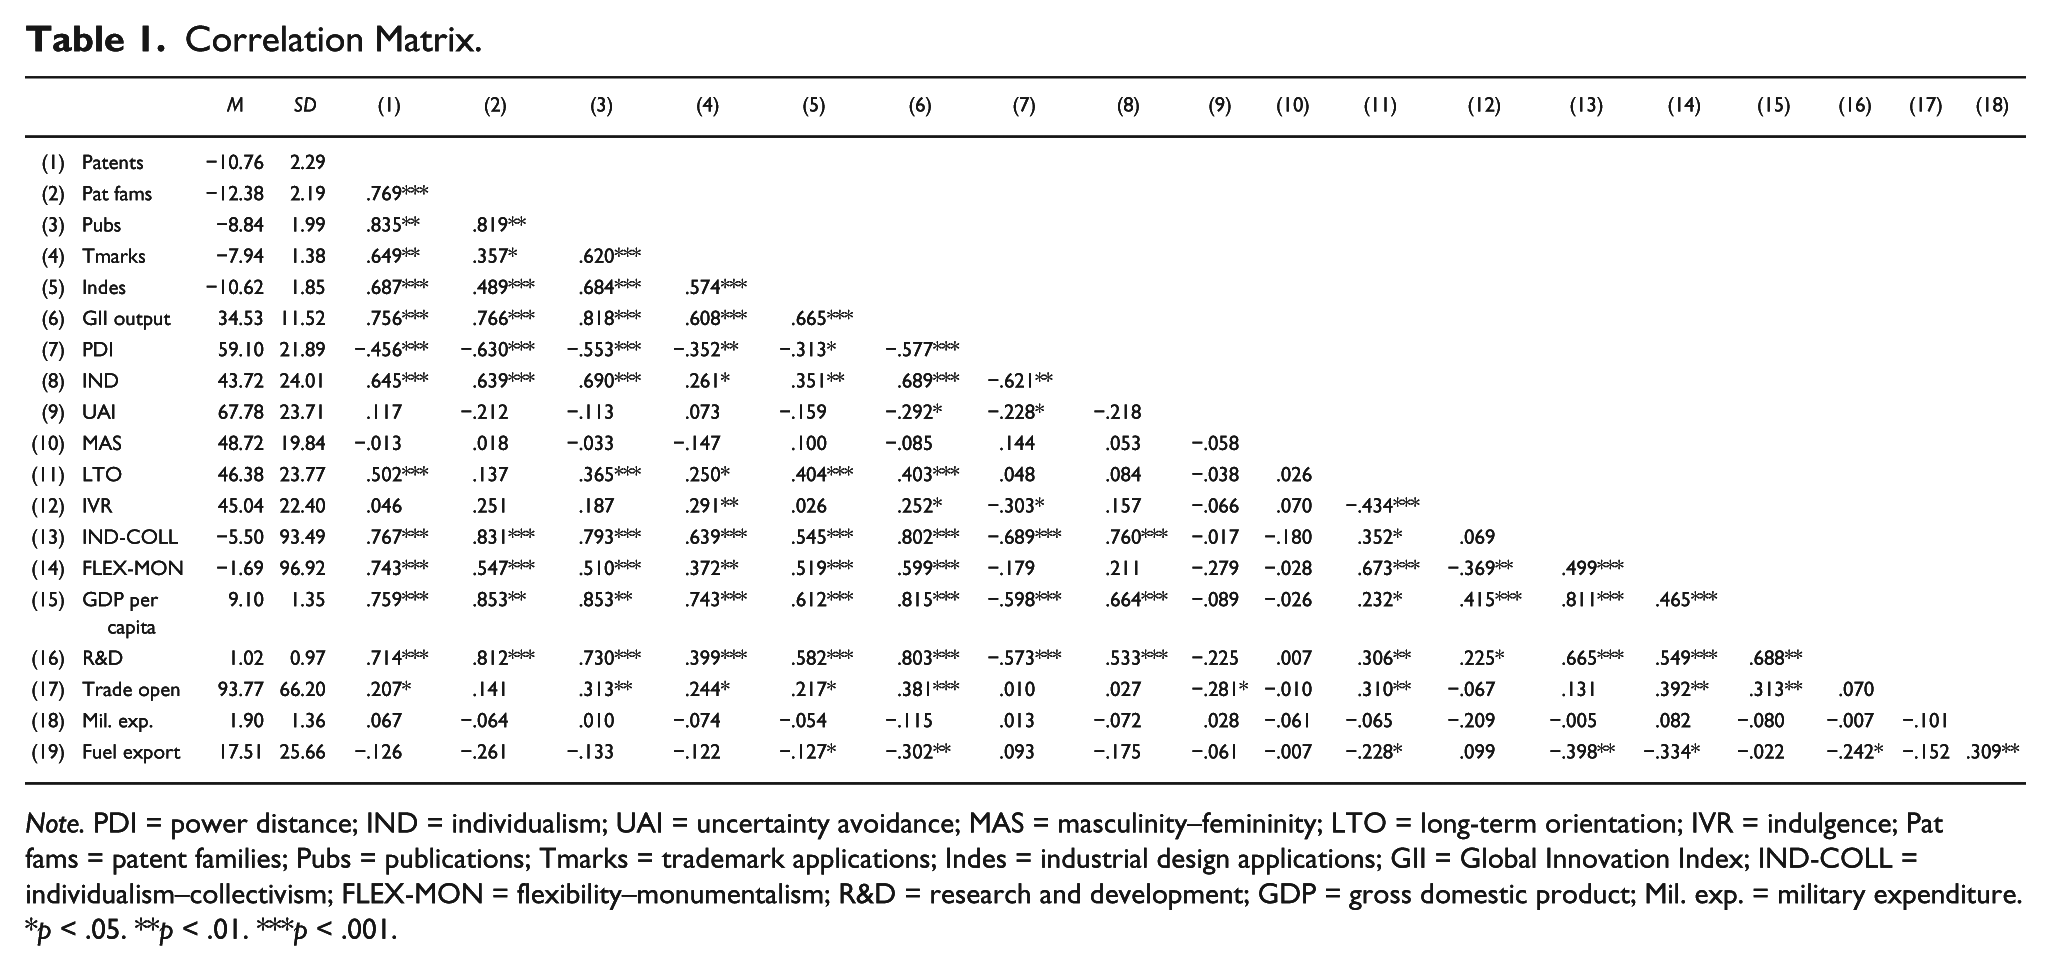
Note. PDI = power distance; IND = individualism; UAI = uncertainty avoidance; MAS = masculinity–femininity; LTO = long-term orientation; IVR = indulgence; Pat fams = patent families; Pubs = publications; Tmarks = trademark applications; Indes = industrial design applications; GII = Global Innovation Index; IND-COLL = individualism–collectivism; FLEX-MON = flexibility–monumentalism; R&D = research and development; GDP = gross domestic product; Mil. exp. = military expenditure.
p < .05. **p < .01. ***p < .001.
Aiming to mitigate the “noise” in data caused by economic cycles, we calculated averages for the period of the last decade, assuming that the effects of culture should not change on a yearly basis. As we wanted to use the most up-to-date data and provide the direct correspondence between the models with different dependent variables, we calculated the averages for approximately the same period: 2006 to 2015 for patent, patent families, industrial design, and trademark data; 2006 to 2014 for publication data; and 2012 to 2017 for GII data. The differences in the time period were conditioned only by the availability of data. As far as the GII is concerned, there is an approximately 2-year lag in the original data used to calculate the subsequent editions of the index, so in fact the editions we used reflected the 2006 to 2015 decade. The earlier editions of the GII include changes on the level of subpillars, thus we regarded them as incomparable with the later ones.
Independent Variables
As independent variables, we used all six of Hofstede’s cultural measures. Although Hofstede’s measures were used as independent variables in all previous research on the relationship between culture and innovation at national level, there is no study that includes all these dimensions. Yet, as the above discussion shows, the theoretical rationale to test for such effects exists.
To increase the level of confidence in the statistical results, it is usually reasonable to triangulate and use competing data. It seems especially important considering the criticism that Hofstede has been facing, especially, for his research design (convenience samples of employees of a single company), ignoring the evidence of cultural changes around the world, crediting strong causality to uniform national cultures, equating nation states with cultures, and questionable replicability of his results (Baskerville, 2003; McSweeney, 2002; Minkov, 2017; Taras et al., 2012). Yet, it should be also noted that other large-scale cross-cultural studies are subject to at least some of these limitations (House et al., 2004; Inglehart et al., 1998; Schwartz, 2006; Trompenaars & Hampden-Turner, 1998). Moreover, they are generally incompatible, especially, when the newest dimensions of Hofstede’s model (long-term orientation and indulgence) are concerned. Even the measures proposed in the GLOBE study (House et al., 2004), perhaps being the best candidate for triangulation in our study, were shown to have an unclear pattern of correlation with Hofstede’s metrics in spite of having linguistically similar labels (Hofstede et al., 2010, p. 43). In our data set, the correlation of Hofstede’s long-term orientation and House et al.’s future orientation were –.37 and .20 (for future orientation values and practices, respectively) and .38 for Hofstede’s long-term orientation and Trompenaars’s time horizon. Similarly, correlations for Hofstede’s uncertainty avoidance and House et al.’s uncertainty avoidance were –.22 and .26 (for values and practices, respectively).
It seems particularly important to mention here the criticism toward long-term orientation, which we proposed above as a strong candidate for a cultural factor influencing innovativeness. Perhaps, the strongest criticism was related to the theoretical coherence of this dimension, questioning the rationale behind putting values such as “respect for tradition” as inversely related to “long-term orientation” (Ashkanasy et al. 2004, pp. 288-289) and arguing that “values at the two ends of long-term orientation are not contrasting or opposing values, but rather closely related to one another” (Fang, 2003, p. 354). It was also argued that Confucian dynamism (the predecessor of the current version of Hofstede’s long-term orientation) should not be treated, either statistically or conceptually, as a distinct dimension from individualism–collectivism (Yeh & Lawrence, 1995) and that the fifth dimension fails to represent Chinese values adequately (which is especially evident in the apparent assumption that Chinese culture is less face-caring than Western cultures (Fang, 2003)). Although some of the criticism was addressed in the later edition of Hofstede et al.’s book (2010), where the new measure of long-term orientation based upon World Values Survey data was proposed, the dimension remained somewhat conceptually problematic.
The situation, though, has changed with the recent publication of the results from a major study aiming at the revision of Hofstede’s measures (Minkov, 2017; Minkov, Bond et al., 2017; Minkov, Dutt et al., 2017). Using data from a survey across 56 countries (more than 50,000 respondents) and secondary data from the World Values Survey, the authors showed that the cultural dimensions of masculinity–femininity and uncertainty avoidance did not replicate satisfactorily, whereas power distance may be regarded as a facet of individualism–collectivism rather than a separate dimension. However, the study offered a strong confirmation of the existence of individualism–collectivism and proposed its new measure, which, according to the authors, performs better statistically than Hofstede’s index. Importantly, the only other dimension from Hofstede’s model that was corroborated in this recent study was long-term orientation, which was, however, reconceptualized and relabeled as flexibility–monumentalism. Conceptually the new dimension differs from Hofstede’s long-term orientation as it emphasizes neither time orientation nor perseverance and thrift, but self-enhancement and self-stability as opposed to personal duality and changeability. Flexibility reflects the cultural tendency “favoring a modest self-regard, duality and changeability,” whereas monumentalism captures the cultural encouragement “to be like a monolithic monument: proud, stable, and consistent” (Minkov, Bond et al., 2017, p. 12). According to the authors, this dimension is an alternative to Hoftsede’s long-term orientation being “statistically similar, and theoretically more focused and coherent” (Minkov, Bond et al., 2017, pp. 1-2), which justifies its use for triangulation. It is noteworthy that the authors emphasize the salience of this new dimension as showing differences between East Asia at one extreme and Africa and Latin America on the other.
Given the need for triangulation in our analysis, we decided to employ both new measures of individualism–collectivism and flexibility–monumentalism proposed by Minkov et al. as alternatives to Hofstede’s measures of individualism and long-term orientation. However, by employing Minkov et al.’s new measures, we do not make any definite statement on the position of either Hofstede’s or Minkov et al.’s study. Although the latter is undoubtedly up to date and impressive in the scale of the research, its results are not explicitly formulated as an alternative, full model of culture. It should also be noted that Minkov et al.’s new measures of individualism and flexibility are rather highly correlated (.499, p < .001, in our data set), which makes the interpretation of their partial impact somewhat problematic. There is also no mention in Minkov et al.’s recent study of the status of Hofstede’s indulgence–restraint dimension. The empirical evidence of the culture–innovation relationship using Hofstede’s metrics that was amassed over the years also seems a good reason to continue to use his data in this field of study.
Control Variables
When it comes to statistically controlling the relationship between culture and national innovation performance, there is no clear-cut strategy. On one hand, there is a wide range of economic and structural factors that are recognized as affecting innovativeness at national level (e.g., Furman, Porter, & Stern, 2002), and culture may be regarded as acting only “alongside other important causal variables, such as wealth, natural resources, education levels, and major government polices” (Taylor & Wilson, 2012, p. 237). On the other hand, it may be assumed that culture has a predominant effect on economic and political institutions (e.g., Landes, 1998), being a kind of master variable overwhelming and to a large extent determining the key economic and policy factors (Taylor & Wilson, 2012). Importantly, the prior studies of the cultural impact on national innovation performance differ in their approach to controlling for economic factors—some of them focus only on the direct effects of culture and do not use controls (Shane, 1992; Rinne et al., 2012), whereas some use both models with and without economic and policy variables as controls (Shane, 1993; Taylor & Wilson, 2012). To date, however, no explicit theoretical model of the causal relationship between economic and cultural effects on national innovativeness has been proposed.
Although in this study, we only aim at testing for the presence of general correlation between culture and innovation output, to do so, we need to specify a conceptual model that would guide our use of controls. First, it is important to note that we assume the cultural factors to be in principle exogenous to economic, policy, and innovation variables. In this assumption, we follow the tradition of sociology and institutionally oriented economy (e.g., Baechler, Hall, & Mann, 1988; Eisenstadt, 1999; Engerman, 2000; Jepperson & Meyer, 2011; Landes, 1998; Tilly, 1990; Weber, 2002b), emphasizing the causal role of cultural factors rooted in tradition; resurfacing in attitudes, institutions, and ideologies; and having a long-term influence on a broad range of economic outcomes. Second, drawing on the existing studies on the culture–innovation relationship (which were discussed above), we also assume that culture may influence national innovativeness in multiple ways and act on many levels: individual (personality patterns, motivations, attitudes), organizational (communication patterns, styles of leadership, approaches to new product development), and macro (national and regional policies, legal regulations, educational systems)—all of which, in combination, may help or inhibit creation and adoption of innovations. In this view, the relationships between cultural and economic factors and innovation output should be regarded as multiple, complex, and difficult to specify and track statistically. Although this is undoubtedly a problem in empirical analysis, it seems to stem from the very notion of culture—as broad, ubiquitous, and entering the economic discourse in a number of ways (Guizo, Sapienza, & Zingales, 2006). Therefore, in the analysis below, we treat models without controls as primary, that is, examining the “total” effect of culture on national innovativeness by testing whether culture really matters as a broad, exogenous stimulant or inhibitor of national innovativeness, regardless of the specific causal mechanisms that are in operation.
However, we also think that there is value in examining the effect of culture on innovativeness by breaking it down into its components. In the absence of a widely accepted and specified theoretical model of the culture–innovation relationship at national level, examining the partial effects may cast some light on the question of whether culture operates to some extent independently of economic and policy factors. A positive answer to this question may carry important implications for business strategists and policy makers. If noncultural factors are not enough to explain the national innovation success or failure, this supports the argument that R&D and infrastructural investments should potentially be supplemented with interventions on the level of deep cultural values. Also, cultural factors may be one of the reasons why certain countries generate innovative output above or below the amount of input (the so-called positive and negative innovation paradox; Asheim & Gertler, 2005; Parrilli & Heras, 2016).
To specify our control variables, we experimented with a set of economic and policy variables appearing in the prior studies as conceptually and empirically related to national innovativeness. We chose (a) per capita GDP (logged), representing the level of economic development and the amount of economic resources potentially facilitating innovation processes; (b) R&D expenditures (in relation to GDP), reflecting the intensity of investments in innovation (we also used separate metrics of business and government investments in R&D to distinguish the role of public policies on innovation), (c) employment in R&D (logged) as an alternative measure of innovation input, (d) expenditures on education as a percentage of GDP, representing the emphasis put on education in a country, (e) openness to trade (defined as export plus imports as a share of GDP), considered as providing motivation for long-run innovations, (f) fuel exports (as a percentage of merchandise exports), reflecting the dependence of economies on the natural resource base which may be an obstacle to innovativeness, (g) military expenditures (as a percentage of GDP) regarded as a stimulator of technological innovation (Kumar, 2014; Ramella, 2016; Shane et al., 1995; Taylor & Wilson, 2012). As in the case of dependent variables, for controls, we used the countries’ averages from the 2006 to 2015 time period.
The analysis suggests that these variables are diverse in terms of their relationships with cultural factors and innovation metrics (Tables 1 and 2). Although some of the economic and policy variables (trade openness, fuel exports, and military spending) are related to innovation intensity but not to culture (with R-squares from .01 to .18), the others (per capita GDP, R&D and education expenditures, R&D employment) are strongly related to both innovation intensity and culture (R-squares from .39 to .69 for their relationship with culture). Thus, the latter may justifiably be treated as mediators of the effects of culture rather than independent sources of influence on innovation rates. However, when interpreted in causal terms, the above group of potential mediators (perhaps with exclusion of education expenditures) seem not only to stimulate innovative activity in a country but also to themselves be affected by innovative outputs (e.g., GDP both influences innovation intensity and is a result of it). Overall, these results suggest that the relationship between culture and national innovativeness might be theoretically broken down into its direct and indirect effects (Figure 1). Yet given the expected recursive effect of innovativeness on the mediating variables, the effects of such decomposition should be interpreted with caution as possibly biased. Taking this into account, we finally decided to first analyze models with control variables not related to culture (trade openness, military spending, and fuels exports), and then add per capita GDP and R&D expenditures, perhaps the two most important and conceptually distinct candidates for mediatory variables (see the “Results” section).
Hofstede’s and Minkov et al.’s Cultural Variables as Predictors of Economic Variables.
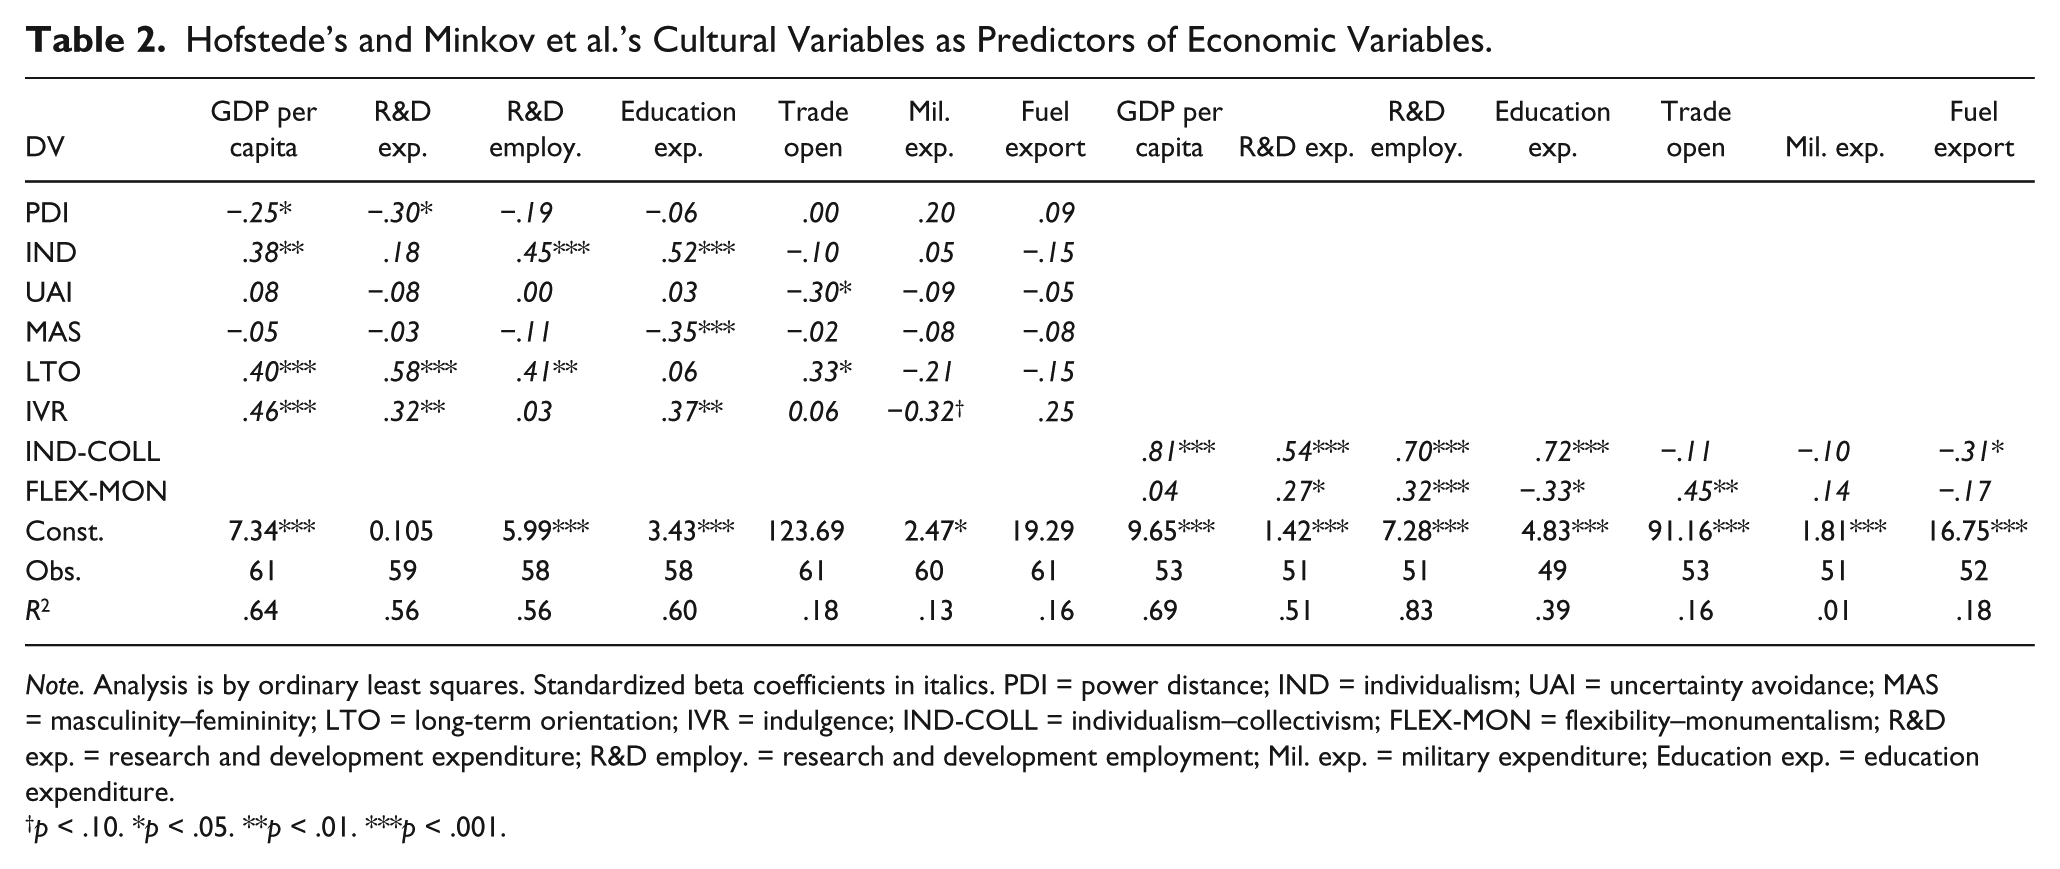
Note. Analysis is by ordinary least squares. Standardized beta coefficients in italics. PDI = power distance; IND = individualism; UAI = uncertainty avoidance; MAS = masculinity–femininity; LTO = long-term orientation; IVR = indulgence; IND-COLL = individualism–collectivism; FLEX-MON = flexibility–monumentalism; R&D exp. = research and development expenditure; R&D employ. = research and development employment; Mil. exp. = military expenditure; Education exp. = education expenditure.
p < .10. *p < .05. **p < .01. ***p < .001.
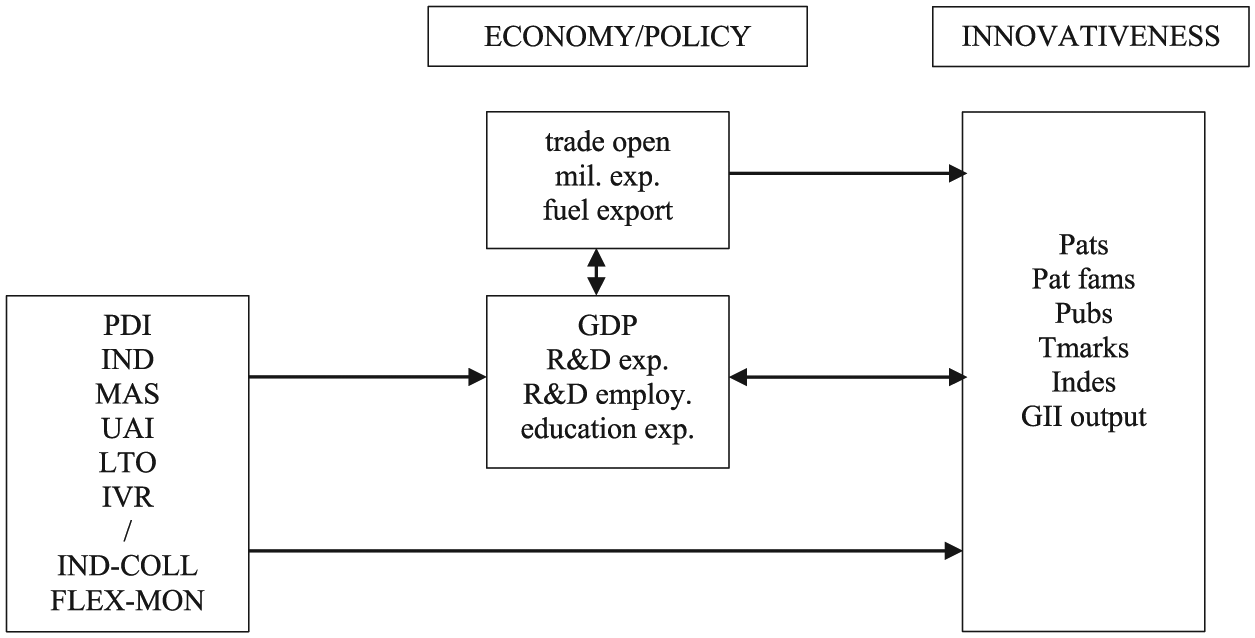
The conceptual model of the relationships between culture, innovation, and economic variables.
Table 3 presents definitions and sources of all the dependent, independent, and control variables used in our study.
Variables, Measures, and Sources.
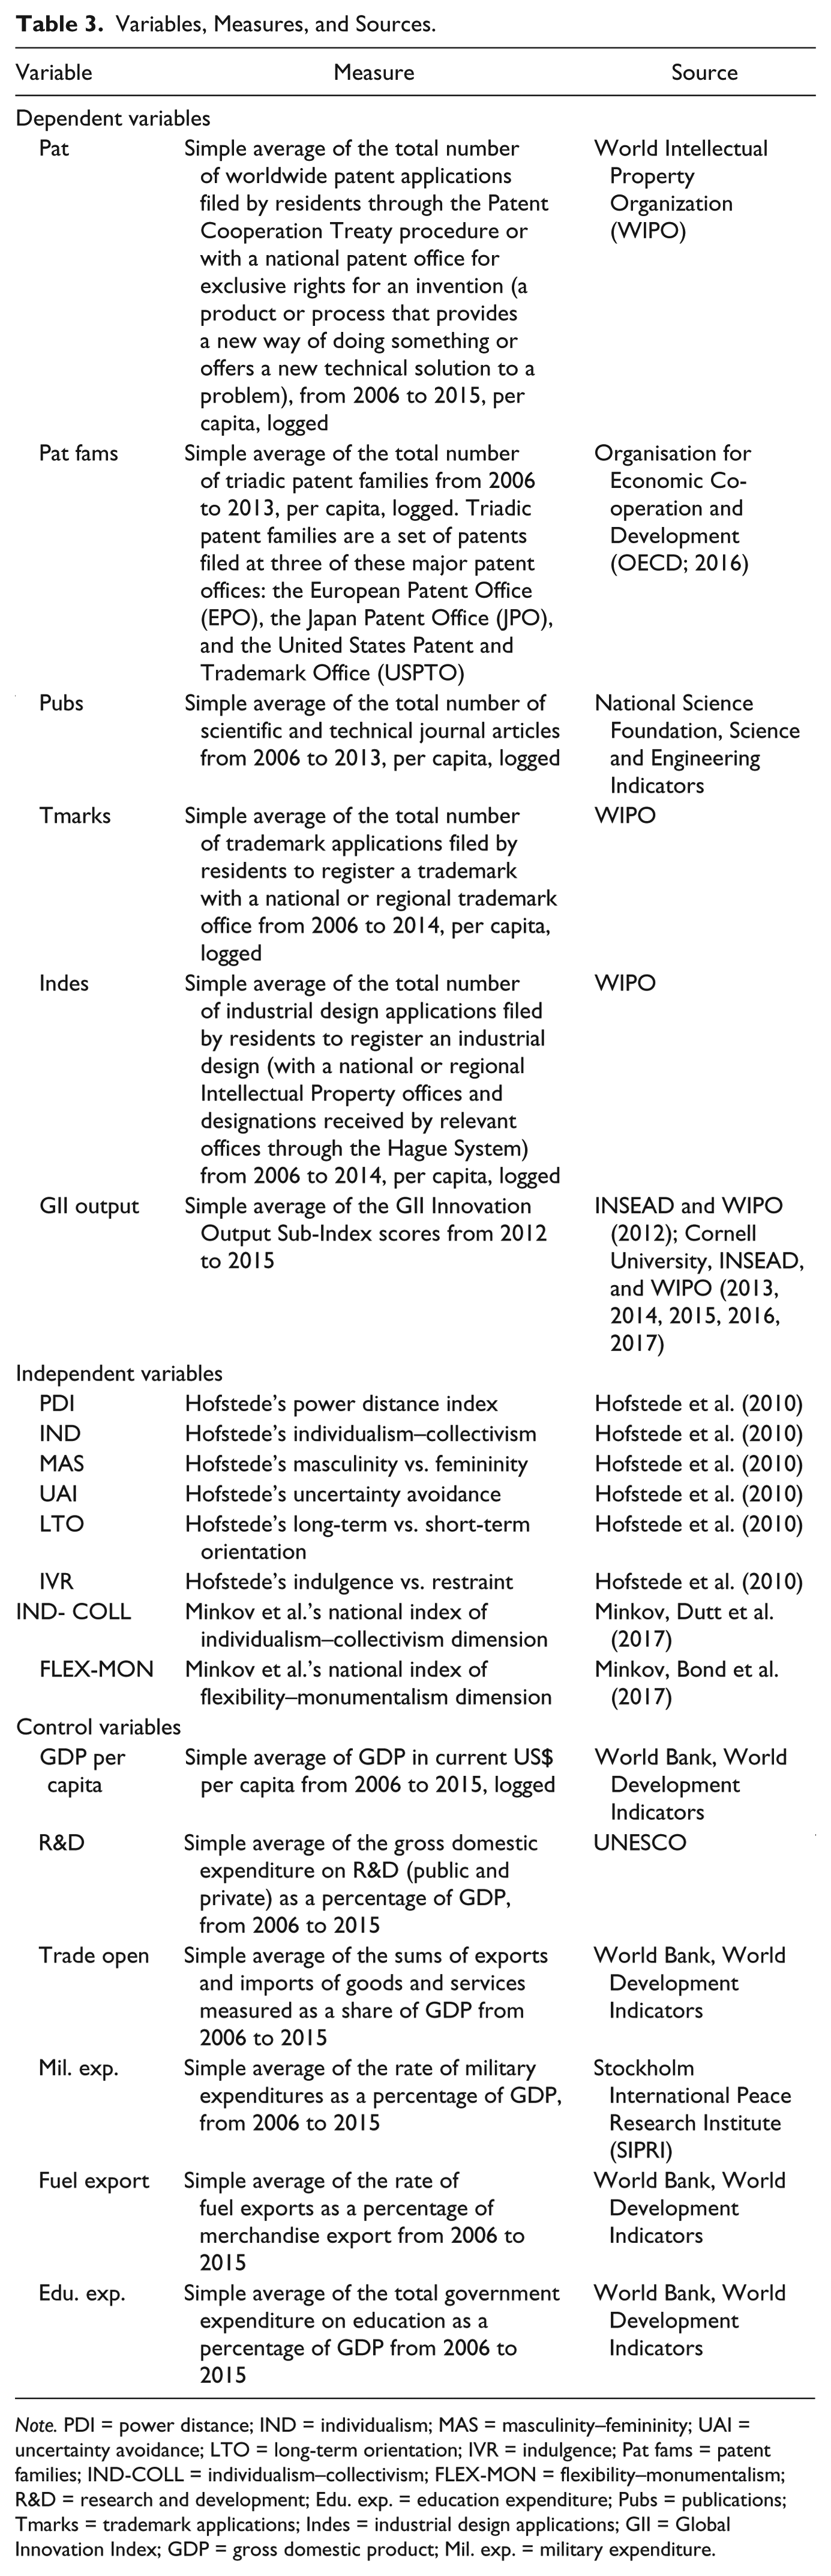
Note. PDI = power distance; IND = individualism; MAS = masculinity–femininity; UAI = uncertainty avoidance; LTO = long-term orientation; IVR = indulgence; Pat fams = patent families; IND-COLL = individualism–collectivism; FLEX-MON = flexibility–monumentalism; R&D = research and development; Edu. exp. = education expenditure; Pubs = publications; Tmarks = trademark applications; Indes = industrial design applications; GII = Global Innovation Index; GDP = gross domestic product; Mil. exp. = military expenditure.
Results
As a first step, we conducted a series of bivariate regressions (linear models) with Hofstede’s and Minkov et al.’s cultural values as independent variables. The results show individualism as the single strongest cultural predictor significantly related positively, as expected, to all employed metrics of national innovativeness (standardized regression coefficients from .26 to .69 for Hofstede’s measure and from .55 to .83 for Minkov et al.’s metric of individualism). The effects of power distance as a single predictor are, as expected, negative, only slightly weaker than the influence of individualism (coefficients from −.31 to −.63), and just as robust across all the dependent measures. Importantly, the third strongest and positive cultural factor is long-term orientation with standardized regression coefficients from .25 to .50 for Hofstede’s long-term orientation and from .37 to .74 for Minkov et al.’s flexibility–monumentalism measure. Long-term orientation, no matter how measured, is almost as robust as individualism and power distance, with the only insignificant coefficient for Hofstede’s long-term orientation and triadic patent families. The results are mixed for indulgence, with significant positive correlations only for its relationship with trademark applications (.29, p < .01) and GII output (.25, p < .05), and for uncertainty avoidance, which is significantly related negatively only to the GII output scores (−29, p < .05). As predicted, there is no significant effect for masculinity.
Next, we included all cultural variables in one model (Table 4). It is important to remember here that Hofstede’s values are not orthogonal, with the strongest correlations between individualism and power distance (−.62), and indulgence and long-term orientation (−.43), which inevitably resulted in some multicollinearity (the largest for power distance with variance inflation factors [VIFs] ranging from 2.00 to 2.35). Apart from statistical aspects, given some conceptual overlap between Hofstede’s values, it seems that there is also a theoretical rationale to examine the effects of all cultural variables taken together as culture operates as a whole, not as its particular aspects isolated from the rest.
Hofstede’s and Minkov et al.’s Cultural Variables as Predictors of National Innovation Rates (“Total” Effects of Culture).
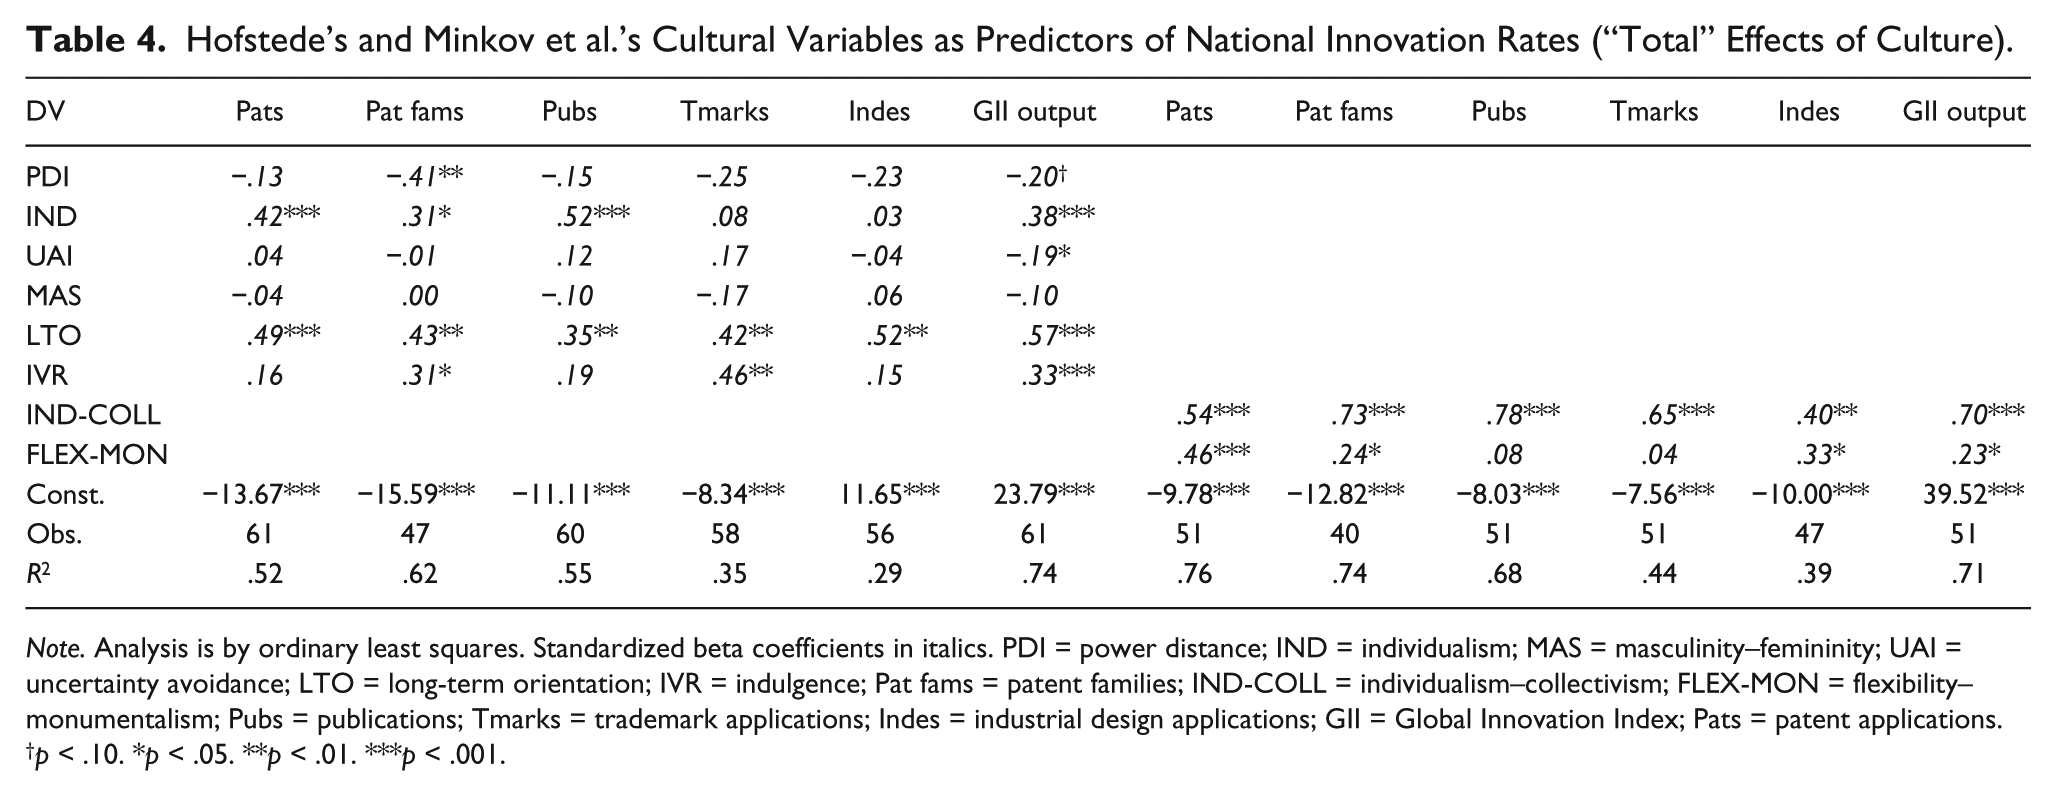
Note. Analysis is by ordinary least squares. Standardized beta coefficients in italics. PDI = power distance; IND = individualism; MAS = masculinity–femininity; UAI = uncertainty avoidance; LTO = long-term orientation; IVR = indulgence; Pat fams = patent families; IND-COLL = individualism–collectivism; FLEX-MON = flexibility–monumentalism; Pubs = publications; Tmarks = trademark applications; Indes = industrial design applications; GII = Global Innovation Index; Pats = patent applications.
p < .10. *p < .05. **p < .01. ***p < .001.
This approach yielded different results, with power distance receding into insignificance (the only exception being triadic patent families—beta = –.41, p < .01), as well as weaker and less robust effects of individualism with significant coefficients for scientific output (.52, p < .001), patent applications (.42, p < .001), GII output (.38, p < .001), and triadic patent families (.31, p < .05). Interestingly, long-term orientation emerges with its partial effects as the strongest and most robust of all the cultural predictors (betas from .35 to .57, all p < .01 or p < .001). The results for indulgence are much less clear—significant only for national innovativeness measured by trademark applications (.46, p < .01), GII output (.33, p < .001), and triadic patent families (.31, p < .05). As in the case of models with cultural variables as individual predictors, the effects of uncertainty avoidance and masculinity are insignificant with the only exception being uncertainty avoidance and GII output (–.19, p < .05).
The triangulation on the cultural measures with the simultaneous use of both Minkov et al.’s measures does not support the above observation of the reduced power of individualism, with its coefficients ranging from .40 to .78 and significant across all the dependent measures (Table 4). If, as Minkov, Dutt et al. (2017) suggest, the new measure of individualism is a more refined and better statistically performing metric, it might also be able to offer a clearer picture of the actual impact of individualism on innovativeness. Yet, these models also offer support for the role of long-term orientation, with its alternative of flexibility–monumentalism being another relatively strong and robust predictor of national innovation success (betas from .23 to .46; insignificant only for trademarks and publications). Importantly, the predictive powers of models using only Minkov et al.’s two new metrics should be noted—with R-squares from .39 to .76, they are much higher for every dependent variable than in models using all six of Hofstede’s variables.
Taken together, the above models analyzing the “total” effects of culture show that both individualism and long-term orientation/flexibility may be regarded as factors that are positive, strong, and robust across all the employed measures of national innovativeness. The results for other cultural variables are not so compelling (power distance), mixed (indulgence), or clearly insignificant (uncertainty avoidance, masculinity).
Next we calculated models with cultural variables taken individually and economic and policy variables not related to culture (trade openness, military expenditures, and fuel exports) as controls. These regressions yield similar results to the bivariate models analyzed above. Individualism (both Hofstede’s and Minkov et al.’s metrics) and power distance remain significantly (the former—positively, the latter—negatively) related to all the dependent variables. Long-term orientation and flexibility are almost as robust (slightly insignificant, p < .01, only when innovativeness is measured by number of trademark applications), whereas masculinity and uncertainty avoidance remain unrelated to the innovation rates. The results for indulgence are mixed, with significant coefficients for triadic patent families (.28, p = .043), scientific output (.23, p = .035), number of trademark applications (.34, p = .005), and GII output score (.31, p = .002).
Regressions with all the cultural variables and controls taken together are also similar to models employing only the cultural predictors (Table 5). When Hofstede’s measures are used, long-term orientation remains slightly stronger and more robust than individualism, and indulgence appears as the third strongest cultural predictor of national innovation rates. In models using Minkov et al.’s alternatives, it is individualism which is stronger and significant across all the dependent variables. Flexibility remains significantly related to patent figures (applications and triadic families) and only marginally slips out of significance in its relationship with industrial designs (p = .062) and GII output scores (p = .109). Interestingly, including three economic and policy controls adds little explanation power, with R-squares rising only by 0 to 11 points in comparison with models using only cultural variables.
Hofstede’s and Minkov et al.’s Cultural Variables as Predictors of National Innovation Rates (Models With Economic Controls).
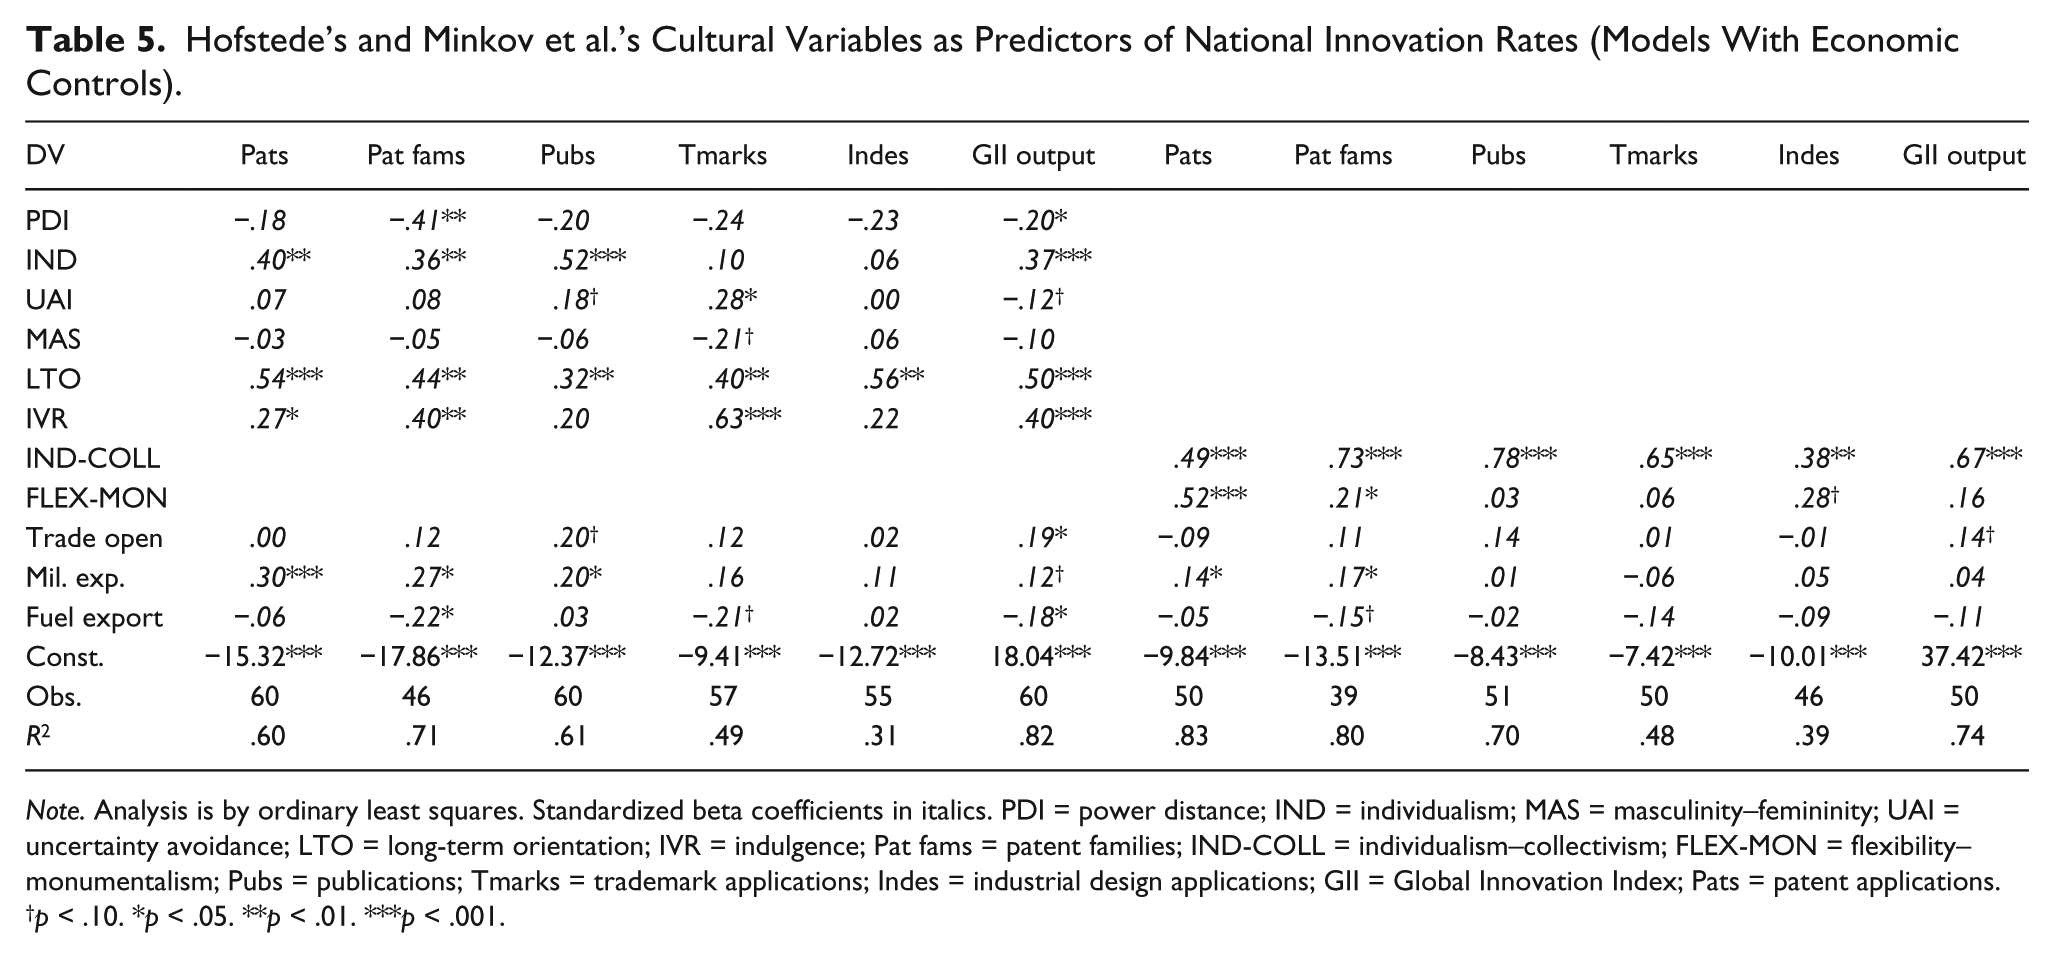
Note. Analysis is by ordinary least squares. Standardized beta coefficients in italics. PDI = power distance; IND = individualism; MAS = masculinity–femininity; UAI = uncertainty avoidance; LTO = long-term orientation; IVR = indulgence; Pat fams = patent families; IND-COLL = individualism–collectivism; FLEX-MON = flexibility–monumentalism; Pubs = publications; Tmarks = trademark applications; Indes = industrial design applications; GII = Global Innovation Index; Pats = patent applications.
p < .10. *p < .05. **p < .01. ***p < .001.
In the next step we tried to assess the potential mediatory effects of per capita GDP and R&D expenditures for the culture–innovativeness relationship using the classic method outlined by Baron and Kenny (1986). As we found a significant relationship between the mediators (per capita GDP and R&D expenditures) and both the independent (cultural) variables (Table 3) and the outcomes (innovation rates [Table 2]), we next added the two potential mediators into regression with all the cultural and economic variables taken together. It inevitably resulted in multicollinearity affecting mostly per capita GDP (VIFs from 4.48 to 5.58), R&D expenditures (VIFs from 3.51 to 4.69), and Minkov et al.’s cultural variables (especially the measure of individualism—VIFs from 4.15 to 5.12). For Hofstede’s cultural variables, it was much weaker, with the largest VIFs for individualism (from 2.53 to 2.73) and long-term orientation (from 2.77 to 3.22). Multicollinearity is not desirable in regression models as it increases the standards errors of regression coefficients, yet it is expected in regressions testing for mediatory effects (Baron & Kenny, 1986, p. 1177). As in this case, it affected Hofstede’s cultural variables much less than the mediators, the direct effects of the former on the innovation rates might have been still observable.
It turned out, however, that adding per capita GDP and R&D expenditures deprived the cultural factors of almost all their effects on innovativeness, suggesting a rather strong mediatory effect in these regressions (Table 6). Only when innovativeness was measured by the GII output, the coefficients for long-term orientation, individualism, and uncertainty avoidance were significant. These results offer some support for the argument that per capita GDP and R&D expenditures may act as the mediators of the effects of culture. Yet, importantly, as there is a potential reverse causal effect between the mediators and the outcomes (innovation rates may influence GDP and R&D expenditures [Diagram 1]), the results should be treated with caution as possibly biased. Thus, although the results seem suggestive, the argument that GDP and R&D expenditures as mediators totally deprive the cultural variables of their direct impact of innovativeness is too strong to be justified by our findings.
Hofstede’s Cultural Variables as Predictors of National Innovation Rates (Mediatory Effects of Economic Variables).
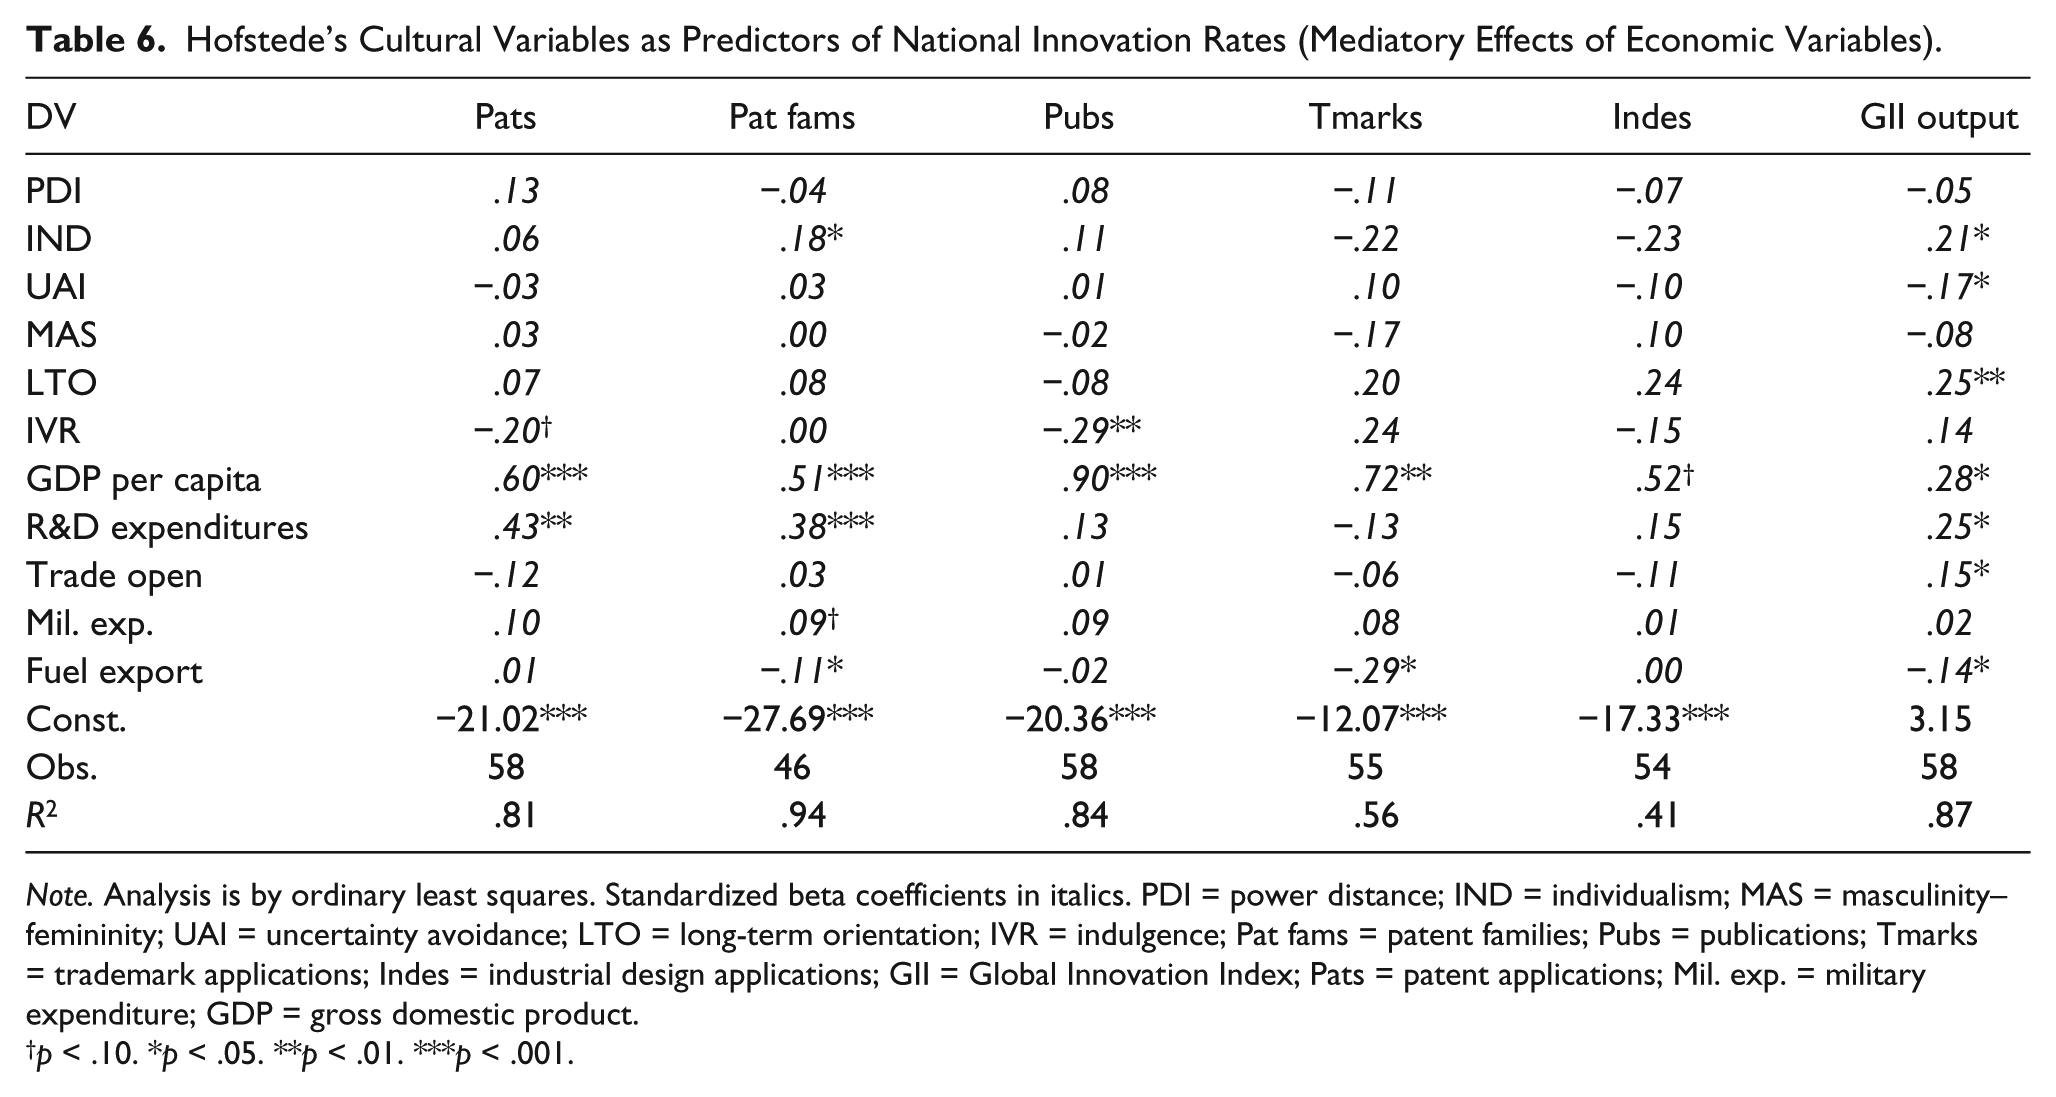
Note. Analysis is by ordinary least squares. Standardized beta coefficients in italics. PDI = power distance; IND = individualism; MAS = masculinity–femininity; UAI = uncertainty avoidance; LTO = long-term orientation; IVR = indulgence; Pat fams = patent families; Pubs = publications; Tmarks = trademark applications; Indes = industrial design applications; GII = Global Innovation Index; Pats = patent applications; Mil. exp. = military expenditure; GDP = gross domestic product.
p < .10. *p < .05. **p < .01. ***p < .001.
Discussion
This study contributes to the existing literature by measuring the effects of a wider set of cultural values on national innovation rates. Taken together, our findings suggest that previous research and conventional wisdom favoring the positive role of individualism together with the negative influence of power distance offer an incomplete picture. First, it is long-term orientation/flexibility that emerges as a relatively strong and robust predictor of innovation rates at the national level. Second, the impact of power distance finds only mixed empirical support. Third, our findings suggest that the approach to the use of controls in examining the culture–innovativeness relationship requires careful consideration, as treating some of the crucial economic variables as ordinary controls may ignore their mediatory role in the mechanism-linking culture and innovative output.
Individualism and Power Distance
Previous research highlighted individualism and power distance as the dominant cultural factors influencing national innovation rates. Our findings corroborated the role of individualism in innovation success as it remains a strong and robust predictor across all dependent variables that measure innovation rates. Interestingly, Hofstede’s measure of individualism is weaker and less robust than Minkov et al.’s newer metric. In the absence of important conceptual differences between these measures, one possible interpretation could be that the new measure may be more empirically refined. The effects of individualism remain largely significant in the presence of economic controls unrelated to cultural variables, yet almost vanish when per capita GDP and R&D expenditures are included. There are two reasons why we do not believe these results question the effects of individualism: first, the mediatory character of GDP and R&D expenditures is theoretically expected, and second, the relationship between these two economic variables and innovativeness is mutual, which probably makes coefficients biased.
As far as power distance is concerned, it remains negative, strong, and robust in the models where it is the only cultural predictor, but the inclusion of the other cultural variables pushes it into insignificance in most of the regressions. This change may be at least partially attributed to the high correlation between power distance and individualism (–.62), inevitably resulting in an increase of multicollinearity. It may also indicate that the cultural aspects of power distance indeed matter as inhibitors on innovativeness, yet they may be both conceptually and empirically a facet of individualism (or other cultural variables), not an independent cultural dimension, as Minkov (2017) argues.
Long-Term Orientation
Although high individualism may well explain the innovation success of Anglo-Saxon and Northern countries such as the United States, the United Kingdom, Sweden, or Denmark, it is not able to account for the high innovation performance especially of East Asian countries (South Korea, China, Taiwan, Japan). Our findings fill this gap, suggesting long-term orientation to be another cultural “engine” of innovation activity.
In contrast to the impact of individualism, which has already been noticed and interpreted, the role of long-term orientation and its revised version, flexibility–monumentalism, needs explanation because both measures differ in their conceptual basis. Hofstede’s measure is, arguably, more related to future orientation (as reflected in the positive valuation of perseverance and thrift), whereas flexibility is the opposition of monumentalism, which, in turn, reflects “a cultural propensity to encourage high self-esteem and self-confidence, as well as invariant self.” Why would flexibility, related to low self-esteem and self-enhancement, foster innovativeness?
We interpret the positive role of both long-term orientation and flexibility as reflecting the role of the cultural tradition of Confucianism. According to Bell (2008), “Confucianism in particular is an action-based ethics: one learns by participating in different rituals and fulfilling different responsibilities in different roles” (p. 205). In this view, flexibility could be interpreted not as a “weakness” of self but as the consequence of the collective life based on the contextual and situational guides rather than on abstract and universal rules. The primacy of learning, adaptiveness, flexibility, self-discipline, common sense, synthetic thinking, pragmatism, and seeking long-term profits over aiming at idealistic, absolute truth has already been noticed by Hofstede et al. (2010, pp. 246-252) as one of the aspects of long-term orientation. The preference for the concrete may be the reason for East Asian students’ advantage in mathematical and science performance as highlighted by Minkov, Bond et al. (2017). It may also result in a greater ability to solve practical, well-defined problems (Hofstede et al., 2010, pp. 261-262) and ultimately have an impact on national innovation performance.
The next aspect of the role of long-term orientation/flexibility as an expression of the Confucian background is the existence of organizational cultures such as the kaisen model of teamwork—worker-oriented and focused on constant adaptation via micro-innovations (Ouchi, Suzuki, 1993). Another example is the Japanese J-form type of organizational culture, involving a decentralized approach to problem solving, facilitation of accumulation and transmission and of tacit knowledge, and a unique capability to generate innovation continuously and incrementally (Lam, 2000, p. 507). Importantly, the latter is believed to have helped Japanese firms to compete with American (low long-term orientation) enterprises oriented toward introducing groundbreaking, spectacular technological inventions.
Finally, on the macrolevel, Confucianism may be the basis of social and cultural integration at the national level translating into East Asian pro-innovation polices such as supporting native innovations, establishing networks of cooperation, and attracting high-tech investments (Chen et al., 2011; Rodrik, 2007; Saxenian, 2007). It has already been shown that the specific, institutional form of collectivism (House et al., 2004, p. 463), which is defined as a kind of patriotism and nationalism based upon integration around collective aims, fosters national innovativeness (Taylor & Wilson, 2012, p. 241). Institutional collectivism is positively related to both long-term orientation and flexibility (.288, p = .048 and .415, p = .008, respectively, in our data set), and these links may be a reflection of ways in which Confucian tradition encourages and rewards collective actions, orientation toward a common purpose, and willingness to bear the cost of changes for the benefit of the whole society. Such society-wide efforts, expressed in national innovation policies, may be an important factor in which Confucianism, captured by long-term orientation and flexibility, influences national innovation intensity.
Masculinity, Uncertainty Avoidance, and Indulgence
The lack of significant effects for masculinity is itself an interesting finding as there has been some theoretical support for assuming a positive relationship between masculinity and innovativeness. However, the results suggest that masculine cultures have no advantage over feminine ones when it comes to national innovation, which is in congruence with the prior studies.
Our findings also question the role of uncertainty avoidance on national innovation rates. There are only a few significant correlations in different regression models, which are difficult to interpret, as they show a different direction of relationship (some positive, some negative). These inconclusive results are in accordance with the recent empirical findings questioning the internal reliability and predictive powers of this dimension (Minkov, 2017).
The results for indulgence are mixed. It should be noted that the group of high indulgence countries includes both some wealthy, highly innovative, and individualistic ones (such as Sweden or Australia) and some relatively poor ones, characterized by low innovation (such as Venezuela, Mexico, or Colombia). On the other extreme, there are some long-term-oriented and innovative countries (China, South Korea), together with less innovative European postcommunist and Middle East countries. Indulgence seems then to cross both cultural dimensions that have a strong effect on innovativeness—individualism and long-term orientation/flexibility—which may be the reason why the results are difficult to interpret. Another possible interpretation may be grounded in the observation that across different models, indulgence is relatively strongly and positively related to innovativeness measured by the GII output and number of trademark applications rather than to the metrics representing R&D intensity. This suggests that it may be more related to innovativeness understood as a broad phenomenon than R&D intensity. However, as indulgence is a relatively novel cultural dimension, more research is required to explore its relationship to innovation.
Conclusion
An essential message of our study is that relying solely on an individualistic understanding of cultural background for innovation processes is simplistic. Harvesting the positive role of long-term orientation/flexibility, the dimension capturing important cross-cultural differences as was emphasized in recent studies (Minkov, 2017; Minkov, Bond et al., 2017) seems to be a prospective avenue or a potential threat to businesses based solely upon an individualistic understanding of innovation. Acknowledging the greater diversity of cultural backgrounds fostering innovation may also be an important source of inspiration for effective government policies and regulations, aimed at building an innovative economy.
Undoubtedly, our study has some important limitations. First, as most of the research in this field, it is to some extent Hofstede-dependent and inevitably inherits part of the criticism his model received. Although we tried to mitigate them with the use of newer measures, the findings are always conditioned by quality of existing measures of culture. Second, given the complexity of the relationship between culture and national innovativeness, a more comprehensive theoretical framework showing possible causal mechanisms leading to national innovation performance is needed. Also, further examination of mediatory effects of some crucial economic and policy variables could cast some new light on the relationship between culture and national innovativeness.
Footnotes
Acknowledgements
We thank three anonymous reviewers for their insightful and helpful feedback that significantly impacted our work.
Declaration of Conflicting Interests
The author(s) declared no potential conflicts of interest with respect to the research, authorship, and/or publication of this article.
Funding
The author(s) received no financial support for the research, authorship, and/or publication of this article.