
Abstract
Household income, which is one of the most important measures of a country’s economic state, does not indicate that children live in better circumstances. In the related literature, children are placed at the center of a country’s sustainability assessments and created the Sustainable Child Development Index (SCDI), which displays a country’s sustainable child development scores in terms of health, education, safety, economic conditions, and environmental factors. Taking into consideration the issues about children and SCDI, this study is to reveal the effects of Hofstede’s cultural structures/dimensions on SCDI scores by analyzing a cross-sectional data set of 81 countries with logarithmic multiple regression as an explanatory model. As a result of the analysis, it was seen that power distance and masculinity had a significant and negative effect on SCDI, and long-term orientation had a significant and positive effect on SCDI. For future studies, this study can be beneficial to see the longitudinal differences for the countries covered in this study.
Introduction
Contrary to common belief, an increase in household income of a country has not necessarily meant welfare for a family including children. For well-being of people, there must be some sustainable development and distribution of economic welfare equally (Chang, et. al, 2018b). Therefore, during the assessment of welfare of a country, there must be a holistic point of view that encompasses every layer of the society. Yet, in related literature, it is asserted that children are generally neglected and overlooked elements of economic and developmental analysis (Chang, 2018). In other words, children are not considered as key stakeholders in economic and developmental assessments. However, children are indeed one of the vital components of a society owing to their inter-generational feature. Moreover, it is underlined that they are among significant stakeholders for Sustainable Development (SD) defined as development that meets current needs without jeopardizing future generations' ability to meet their own (Chang et al., 2017). Considering the definition of SD, it can be easily stated that people must have an opportunity to foster freedom, to live in a stable society, and to gratify their needs and this picture must be sustained. With reference to sustainability, this term contains some linkage to the future and children that are inevitable parts of a country’s future. In that sense, Chang (2018) proclaims that due to the obvious difference between the needs of children and adults, during the assessment of SD, children must be added to the formula as a key stakeholder in order to capture an integrative point of view and whole-population-oriented assessments (Chang et al., 2015). Taking this assumption into consideration, Chang (2018) developed “The Sustainable Child Development Index (SCDI)” which puts children at the center for sustainability assessments of a country. SCDI encompasses health, education, safety, economic conditions, and environmental aspects of countries to find an accumulated score that exhibits countries’ sustainable child development scores. Besides, it reveals a developmental approach for supporting children to meet their needs both at the present time and for the future (Chang et al., 2018b).
Most extant child development studies focus mainly on social and economic issues, but child development scores should ideally involve multiple factors involving a range of topics. To this end, Chang et al. (2018b) developed the SCDI to address the neglect of topics related to environmental aspects besides health, education, safety, and economic status in the assessment of children’s’ welfare.
SCDI also enables comparing and observing the sustainable development performance of different countries and geographic layers. In this context, Chang et al., (2018a) pointed out that the results of SCDI demonstrated a substantial regional and territorial inequality on the scores calculated for 138 countries and then classified them into four levels from very high to low. To illustrate, European countries generally have better scores compared to African and Asian countries positioned in medium and low levels.
It can be deduced from the results of SCDI scores that these scores can vary at both the regional and individual country level. Chang (2018) also emphasizes that besides geographic conditions, the SCDI could be used to compare countries based on cultural or socio-economical differences. In this context, culture is one of the most important and influential determinants of human behavior (Cronk, 2017; Soares et al., 2007), as well as characterizing the institutions, organizations, or groups of a country (Gaygısız, 2013). Also, one’s actions can be impressed or sometimes dictated by culture (Torry, 1999, 2000). These statements suggest that variation higher or lower SCDI scores concerning children care, education, nutrition, and other dimensions of sustainable development can be predicted from cross-cultural differences between countries. Indeed, in this cross-country study, the main research question is to ask whether some cultural characteristics may help to explain why some countries have higher SCDI scores than others. To our knowledge, no studies to date have achieved the above-mentioned purpose.
Since the cultural classification of Geert Hofstede represents the most influential national culture framework in business literature and it has inspired thousands of scientific and empirical studies (Khlif, 2016; Kirkman et al., 2006; Steenkamp, 2001), his cultural classification (with sub-dimensions) is used to investigate the impacts of culture dimensions on SCDI in our research. Therefore, the possible impact of national cultural dimensions on SCDI scores has been investigated through explanatory modeling in accordance with the paradigm proposed by Shmueli (2010). Hypotheses have been tested via SCDI scores of 81 countries calculated for the year 2015. Hopefully, this study will provide important findings for countries in their efforts to form and apply more effective child development policies in line with their national cultures.
Theoretical Framework and Hypotheses
Culture is a widely used phenomenon for highlighting the diversities of countries. Moreover, like almost all sociological concepts, culture has different definitions, dimensions, and classifications. Yet, most of these definitions of culture agree upon and emphasize the collective side of this phenomenon. For example, culture is the collective mental programming that separates members of one group or category of people from those in other groups or categories (Hofstede, 2011:3). Similarly, social scientists use the term “culture” to refer to a set of collective criteria that distinguish each collective in a meaningful way (House et al., 2002: 5). In another definition, culture can be seen as “software of the mind” that regulates and supervises almost all activities and perceptions (Hofstede et al., 2005). Moreover, Guiso et al. (2006) defines culture as habitual customs, beliefs, and values that religiously, ethnically, and socially shaped and diffused nearly unchanged from generation to generation. Besides, culture is one of the most powerful and influential determinants of human behavior (Soares et al., 2007), which may influence people and groups’ interactions with each other (Schrodt, 2002) and have an important effect in characterizing a country’s institutions, organizations, or groups (Gaygısız, 2013). Culture guides member behavior, vision, values, norms, and expressed interactions with the outside world and future expectations (Needle, 2004).
As it is mentioned in the literature, culture can be considered as one of the robust elements that can shape an individual’s collective way of living. In this way, this shaping effect of culture can be also seen unseen in the socioeconomic aspect of life. In a meta-analysis study that was conducted to find whether there was a meaningful relationship among emotional well-being with Hofstede’s cultural dimensions, socioeconomic development, and climate, Basabe et al. (2002) found that individualism not only had a positive and statistically significant relationship with affect balance, but it has also a moderate predictive impact on socioeconomic development and climate. This study pointed out that as earning, education, and life expectancy rise, so do the quality of life, privacy, and social resources, resulting in a more favorable emotional experience and culture. Moreover, socioeconomic and cultural elements were more significant predictors of affect than climate. Park et al. (2007) examined the possible impact of culture on household income and environmental issues. They suggested that the relationships among the Hofstede’s cultural dimensions and environmental sustainability were multidimensional; more specifically, cultural dimensions not only predicted income but also masculinity and power distance were negatively related to environmental sustainability measures.
There are also other studies about culture’s possible effect on other societal issues of a nation. For instance, Kwok and Tadesse (2006) tried to assess the potential influence of culture on nations’ financial decision systems. To determine possible cultural effects, they employed Hofstede’s cultural dimensions. The results of their study showed that countries, whose high uncertainty avoidance scores are high, chose less risky bank-based assets rather than riskier stock markets. Franke and Nadler (2008) conducted research across 44 countries on the relationships among culture, economic development, and ethical behavior of organizations. According to the results of the study, uncertainty avoidance, power distance, and per capita gross domestic product were negative predictors of national ethical attitudes. Moreover, organizations were more likely to face ethical obstacles during facilitation work in other countries which had different scores in uncertainty avoidance, power distance, economic development, or other cultural dimensions from their home country.
In other research, Pereira Sartori Falguera et al. (2021) scrutinized the impact of national culture on human development by considering gender differences across 59 countries. The researchers underlined that although female inclusion into society is much more advanced than earlier times, women still have some disadvantages. Pereira Sartori Falguera et al. (2021) considered democracy, agricultural dependence, and urbanization as control variables and added Hofstede’s dimensions to their model to reflect cultural differences. According to the results of the study, culture was identified as an inseparable part of the reality on human development, yet it appeared to act divergently with regard to gender differences. On the female side, individualism became the most positively significant element for human development achievements, whereas masculinity and uncertainty avoidance were damaging factors. On the other hand, when considering the male side, power distance and indulgence had greater predictive effects on men’s human development achievements. More broadly, Pereira Sartori Falguera et al. underline that increases in individualism and long-term orientation and decreases in masculinity, power distance, and uncertainty avoidance might elevate the contribution of human development achievements.
In recent decades, culture has received a lot of attention as a mediator or driver of sustainable development studies. Zheng et al. (2021) point out that the role of culture in the area of sustainable development was the adoption of “Convention on Diversity of Cultural Expressions” by UNESCO in 2005. In that paper, UNESCO declared that culture had a conglutinating effect on sustainable development policies, and it should be added to predictive models (UNESCO, 2005). If cultural diversities can cause different implementations in the areas of education systems, health care and social services, and distribution of economic resources of the country, we should expect cultural values to be related to adult and child development because culture is the foundation on which society is instituted and expressed in various aspects of societal life. Moreover, we can also assume that cultural characteristics account for a significant portion of variation in key aspects of human development because cultural characteristics influence how a country’s politics are implemented (Schwartz, 2006).
As was mentioned, there are different classifications of culture in the related literature (Hampden-Turner & Trompenaars, 2008; Hofstede, 2001; Schwartz, 1992). In this study, we focus on Hofstede’s (2011) cultural diversity model which has been widely preferred in the studies of socioeconomic and sustainability research (Gaygısız, 2013; Harris & Marks, 2002; Zheng et al., 2021). Additionally, cross-cultural disparities in a variety of fields, including economic growth, foreign direct investment, ethics, consumer behavior, and corruption, can be explained by using this classification. In Hofstede’s model, there are six dimensions. During the construction of hypothesis concerning the potential impact of cultural dimensions on the SCDI, we consider the possible effects of cultural approaches of countries to individuals, specifically to children.
In Hofstede’s model, the first dimension is power distance (PowDis) which ranges in value from zero, for a culture with low PowDis, to 100, for a culture with a high PowDis. This dimension marks the tolerance level of inequality among citizens that a country’s population regards as natural (Hofstede & McCrae, 2004). Low scores indicate that people accept few differences, whereas high scores indicate people in the society consider significantly hierarchical relationships to be natural. A high PowDis suggests the social hierarchy is clearly defined and implemented without justification. People are questioning authority and attempting to delegate power when PowDis is low. Therefore, it follows that countries supporting citizen equality and individual autonomy are more likely to develop social welfare policies than countries emphasizing hierarchy and interdependence, since the standard of life, at least at the most fundamental level (e.g., the right to education and health care), should not be dependent on one’s social status or family wealth. In hierarchical societies with high power distance, the society is not anticipated to offer the same chances for basic social services to everyone on an equal basis because having these services mostly depend on individual’s social status (Khatri, 2009; Triandis, 1982). Moreover, relatively less industrialized societies, with less education, less urbanization, and where the difference between the earnings of rich and poor is high are categorized by more hierarchical culture (Basabe & Ros, 2005). These countries most probably cannot serve same opportunity for education, health service, and nutrition for children. Therefore, countries with relatively low PowDis scores estimated to provide an equal opportunity for education, safety, health services, and nutrition regardless of child’s family’s social status.
Hypothesis 1: (H1): PowDis has a significant and negative predictive effect on SCDI. The second dimension of Hofstede’s classification is individualism (Indiv) versus collectivism that also ranges from zero, representing a highly collectivistic culture, to 100, representing a highly individualistic culture. Individualism refers to the degree to which people in a country choose to act individually rather than as a part of group. Conversely, collectivism indicates the preference of acting as a group (Hofstede & McCrae, 2004). Individualistic culture promotes the aspects of personal independence, personal achievement, and emphasis on uniqueness, whereas collectivist culture supports a sense of duty and obligation to the group (Oyserman et al., 2002). In individualistic cultures, the ties between individuals are relatively weak; the focus of interest is on the individual and his/her immediate family. In collectivist cultures, people grow up with a high sense of the group to which they belong and have strong ties with extended family which they preserve with robust loyalty. Besides, they are also fully aware of in-group and out-group distinctions which enable people to identify the in-group members with whom they closely interact (Minkov et al., 2017). This disparity in a person’s position in the community is likely to affect how issues of education, health care, and other social services organized in a country for both adults and children. The main precursors of individualism in Hofstede’s model are economic development, relatively low population, relatively high urban life, and a passage from big families to nuclear families. These processes enable people to increase their wealth and their potential for choice by creating alternatives. In that sense, it is declared that high economic development increases individualism by allowing people access to more resources. In addition, human rights and equality are also promoted in more individualist countries (Basabe & Ros, 2005). Measures of economic and social development have been found to be positively related to individualism (Basabe & Ros, 2005; Gaygısız, 2013). Therefore, in individualistic cultures people may give more appreciation and support for children’s development because these cultures have more opportunity to access education, health care, and nutrition which are inevitable elements of children development. Moreover, the focus of people in individualistic cultures is their immediate family including their children so people may do their best to provide a better life and future for their children. Countries with relatively high Indiv scores are anticipated to give more attention to the sustainable children’s development.
Hypothesis 2: (H2): Indiv has a significant and positive predictive effect on SCDI. The third dimension is masculinity (Masc) versus femininity which has scores from zero that signals femininity, to 100 that signals masculinity. Highly masculine cultures canonize assertiveness, self-confidence, competition, the gathering of wealth, and material possession. In contrast, high feminine societies emphasize compassion, collaboration, concern for the needy, humility, solidarity, and helping others (Hofstede & McCrae, 2004). Accordingly, it is expected that highly feminine cultures pay more attention to children than masculine cultures. Societies that have high feminine scores may fully support children’s development and try to provide every possible means to do that. In this way, Rodrigues and Blumberg (2000) found that feminine societies make larger investments in human development programs than masculine ones. Subsequently, countries that score relatively low on Masc are anticipated to have higher scores in SCDI.
Hypothesis 3: (H3): Masc has a significant and negative predictive effect on SCDI. The fourth dimension is uncertainty avoidance (UnAvo) which is scored from zero, pointing a culture with a weak UnAvo, to 100, pointing a culture with a strong UnAvo. This concept refers to the extent to which members of a society try to handle anxiety by diminishing uncertainty. In other words, the score indicates the levels of society’s propensity to struggle to ambiguity and uncertainty (Wennekers et al., 2010). Additionally, it also reveals people preferences to be structured over being unstructured. High scores of UnAvo denote that people wish to have strict and comprehensible rules to decrease the possibility of occurring unidentified and nonstandard situations. In contrast, low UnAvo signals more open, flexible, and tolerant approach to the ambiguous situations (Hofstede & McCrae, 2004). In the literature, high economic development, which can be an important sign for sustainable human and child development, can raise the score of UnAvo due to people’s wish to keep the status-quo that provides them economic welfare and the benefits of advancing human development (Konrad, 2012). In high UnAvo cultures, people may have the fear of probable changes in future both for themselves and their children, so they may want to provide a better education, health services, safety, and nutrition as much as they can to their children to ensure their resilience to the possible and catastrophic changes. Owing to their intolerance for ambiguity, people in these cultures may want to guarantee their children’s future by serving them education, safety, and nutrition. Therefore, countries that score relatively high on UnAvo are expected to have high scores in SCDI.
Hypothesis 4: (H4): UnAvo has a significant and positive predictive effect on SCDI. The fifth dimension of Hofstede’s classification is long-term orientation (LngTO) versus short-term orientation (ShtTO). This dimension index ranges from zero, for short-term-oriented cultures, to 100, for long-term-oriented cultures. It basically describes the timeline perception of the society and reveals the reflection of the past to the current and the future. So, long-term orientation is marked by the willingness to adapt traditions to changing circumstances, a consistent interest in saving and investing, and determination in achieving goals (Hofstede et al., 2008). In other words, LngTO cultures prioritize the future by habits such as thrift and perseverance (Bearden et al., 2006; Gaygısız, 2013). Yet, ShtTO cultures not only stress immediate outcomes, but they also tend to look back to respect traditions and meet social responsibilities (Harris & Marks, 2002) Besides, it is asserted that ShtTO cultures would place a lower value on health, while LngTO societies would be more likely to obtain an extra year of life (Mahlich et al., 2018). Thus, it can be anticipated that LngTO societies appreciate the future, and they can strain their every nerve to have a better one. Taking this assumption into consideration, it can be concluded that LngTO cultures value their children and their endurable development because children are globally considered as one of the vital elements of future. In the same way, social and economic development studies also express the positive relations with LngTO and developmental issues (Gaygısız, 2013). Therefore, countries that have high LngTO scores are predicted to have high scores of SCDI as well.
Hypothesis 5: (H5): LngTO has a significant and positive predictive effect on SCDI. Sixth and the last dimension is Indulgence (Indul) versus restraint which ranges from zero, for cultures with restraint, to 100, for cultures that are indulgent. This dimension basically focuses on how individuals in society gratify or regulate their basic motives for an enjoyable life. Societies high in indulgence allow for reasonably unrestricted fulfillment of basic human desires, as well as enjoying life and having fun. Societies with restraint limit people’s ability to satisfy their desires by enforcing strict social norms (Hofstede et al., 2008). In restraint societies, many of the citizens consider themselves as vulnerable owing to the firm rules and norms (Violeta et al., 2021). Considering these features, it can be claimed that in high Indul societies people can pay much attention for caring for their children owing to their broad-minded atmosphere. They most probably see the development of future generations as a key component of freedom of thought. Whereas, in highly restrained cultures societies people must confine to the rules and regulations that their governments put concerning education, caring and even nutrition of their children. Therefore, they may not have a chance to provide a better future for their children. This picture can be valid for almost all countries that have highly regulated and poor performance in sustainable development. So, countries that score relatively high on Indul are expected to perform better in children development.
Hypothesis 6: (H6): Indul has a significant and positive predictive effect on SCDI. A summary of the model and hypotheses related to national culture dimensions (NCD) and SCDI are illustrated in Figure 1.
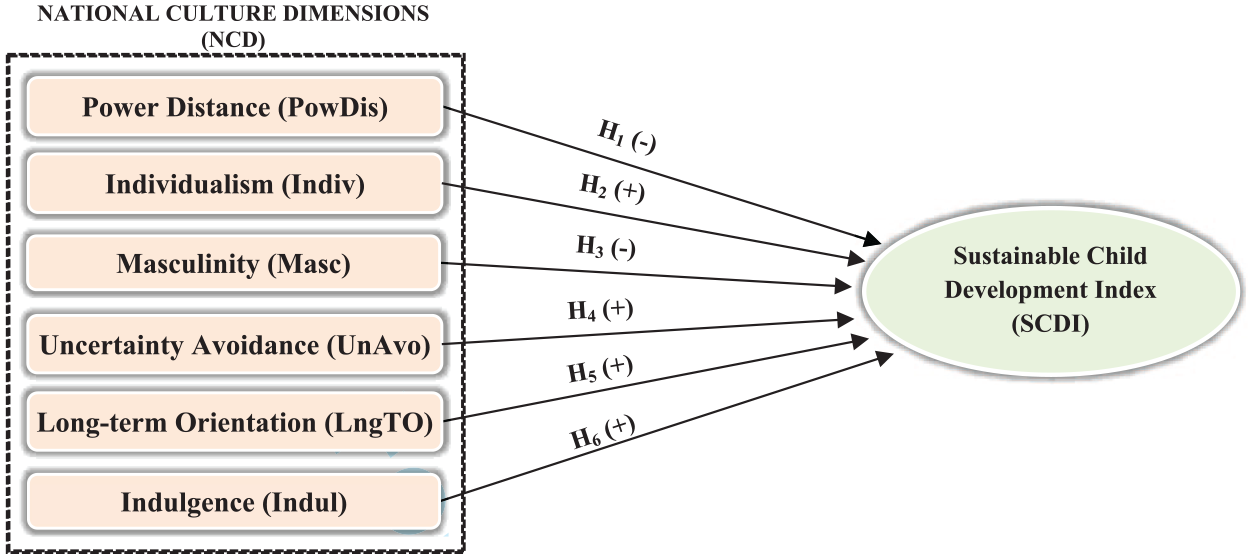
The model and hypotheses.
Data and Methods
In our study, two main indexes are used for examining the hypotheses stated above by performing logarithmic multiple regression as an explanatory model. One is Hofstede’s model which analyzes national culture in six dimensions and the second is SCDI considering child development topics regarding Health (Health), Education (Edu), Safety (Safety), Economic Status (EcoSta), and Environmental Aspects (EnvAsp) described by 25 indicators. By taking reference points derived from the targets of the Sustainable Development Goals (SDGs), the SCDI scores for the year 2015 were calculated for 138 countries.
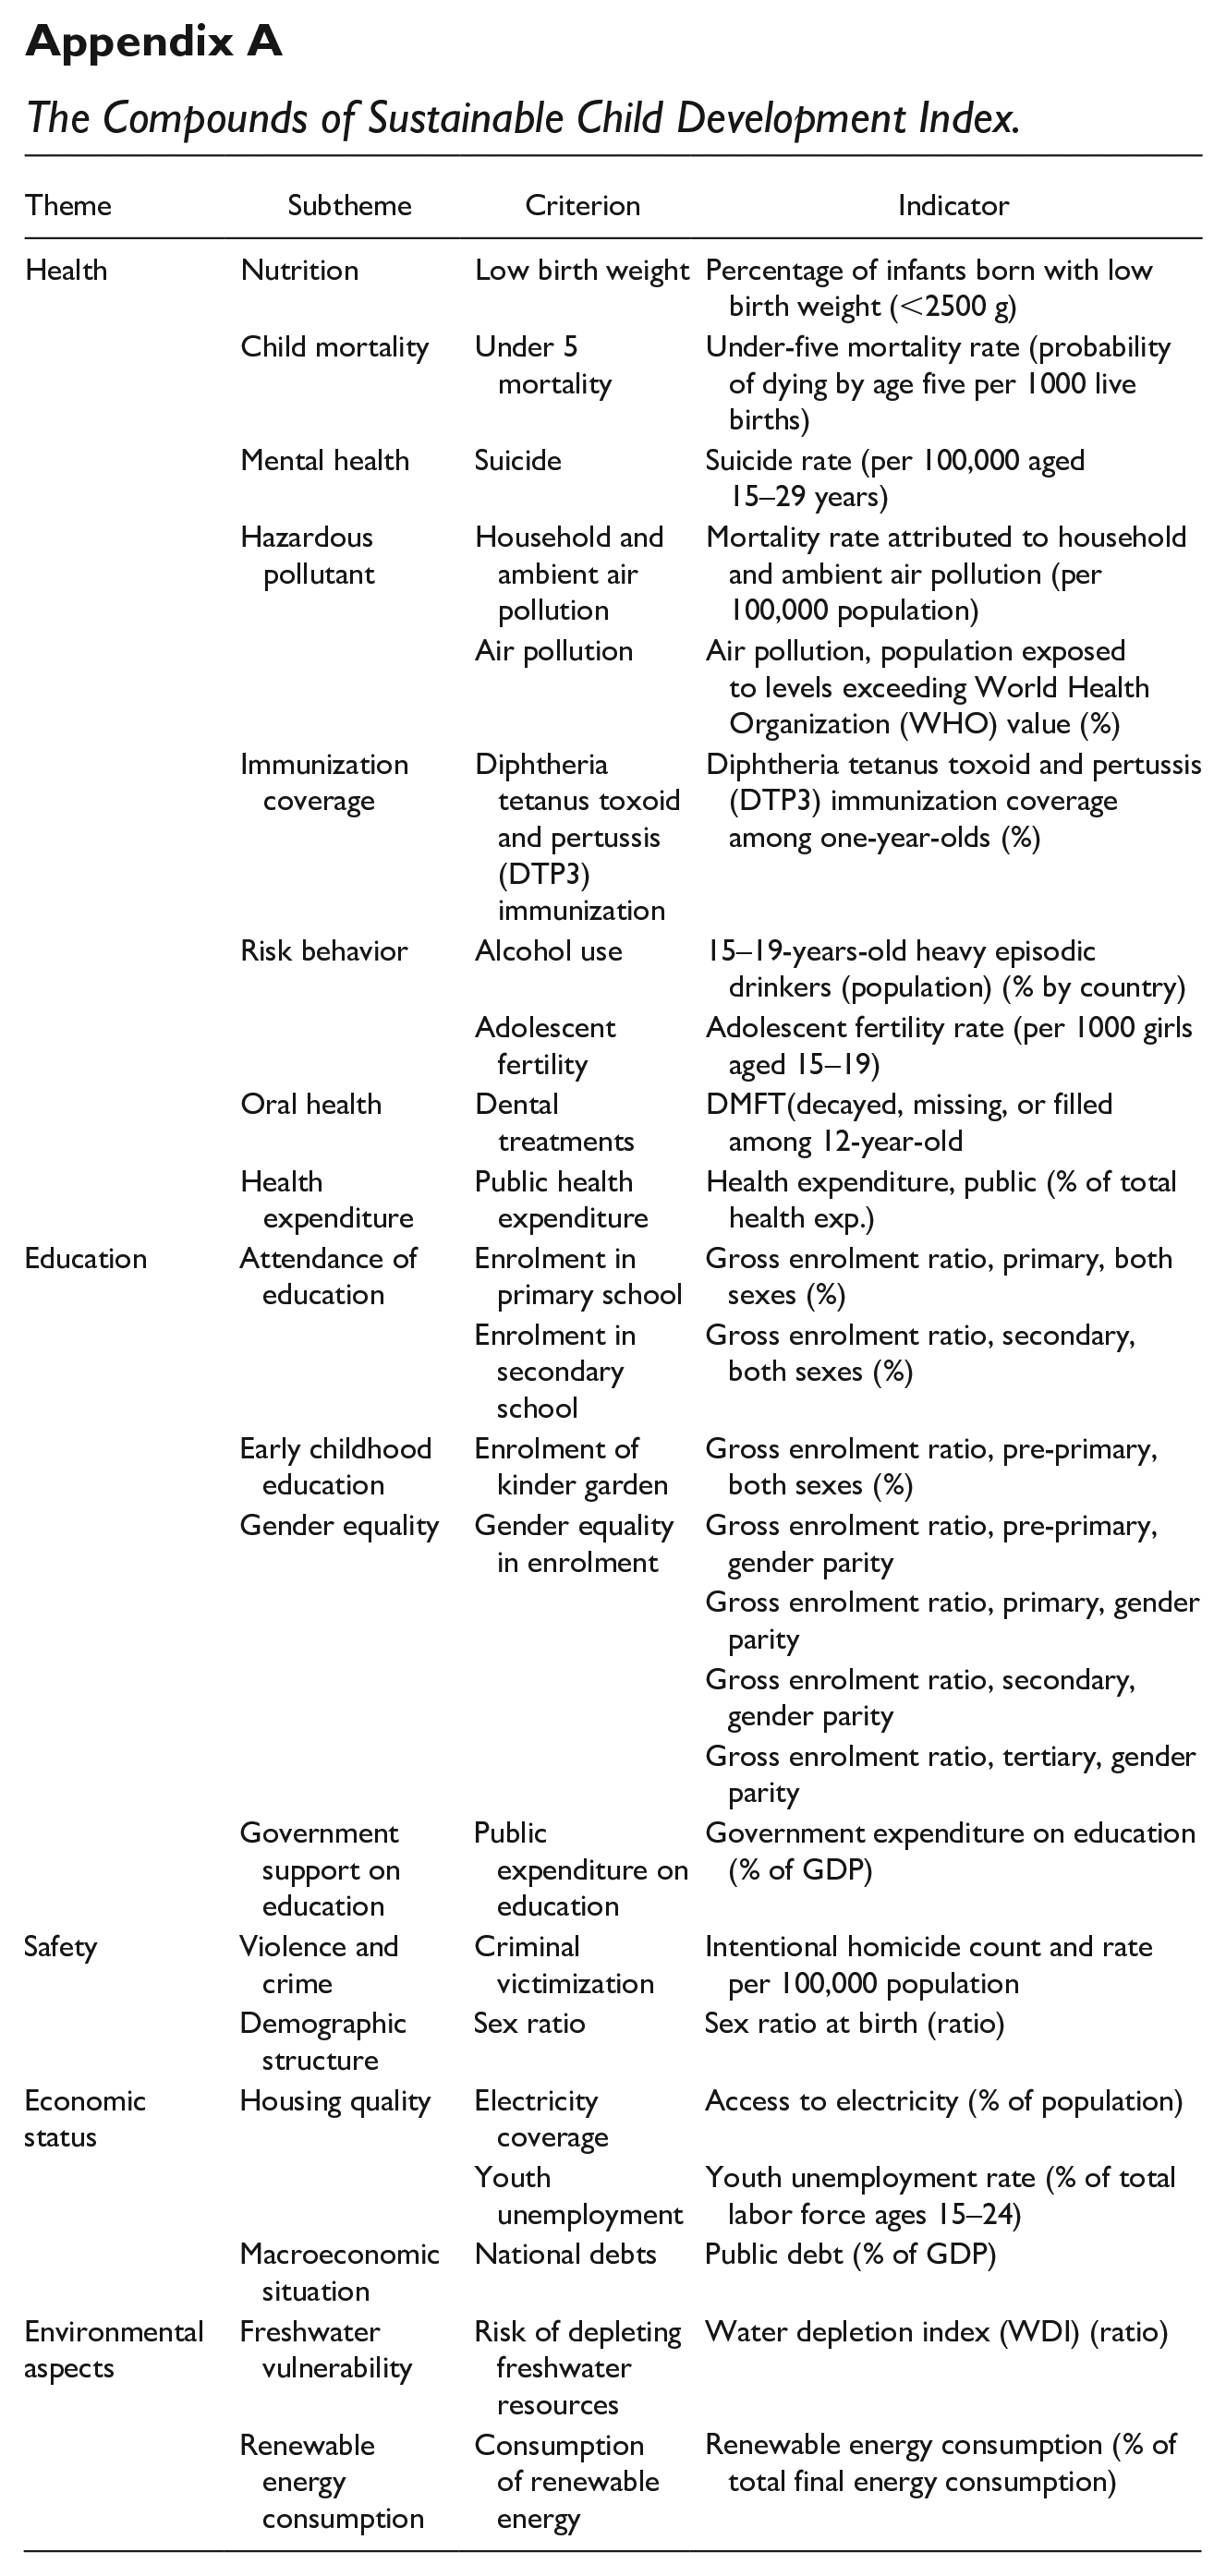
To examine the hypotheses, we try to explore the effects of NCD (PowDis, Indiv, Masc, UnAvo, LngTO, and Indul) on SCDI by delineating explanatory modeling using SCDI value as a dependent variable and utilizing NCD as independent variables. In Chang et al. (2018b)’s model, SCDI themes are specified by 2–17 sub-themes. Sub-themes are further described by 1–7 criteria, which are measured by 1–4 indicators as shown in Appendix A. When calculating SCDI scores, equal weighting was presumed while conducting aggregation at indicator, criterion, subtheme, and themes level. Arithmetic average method was used for aggregating the scores from the indicator, criterion, sub-theme, and theme to index level. By doing so all indicators, criteria, subthemes, and themes were considered as being equally important.
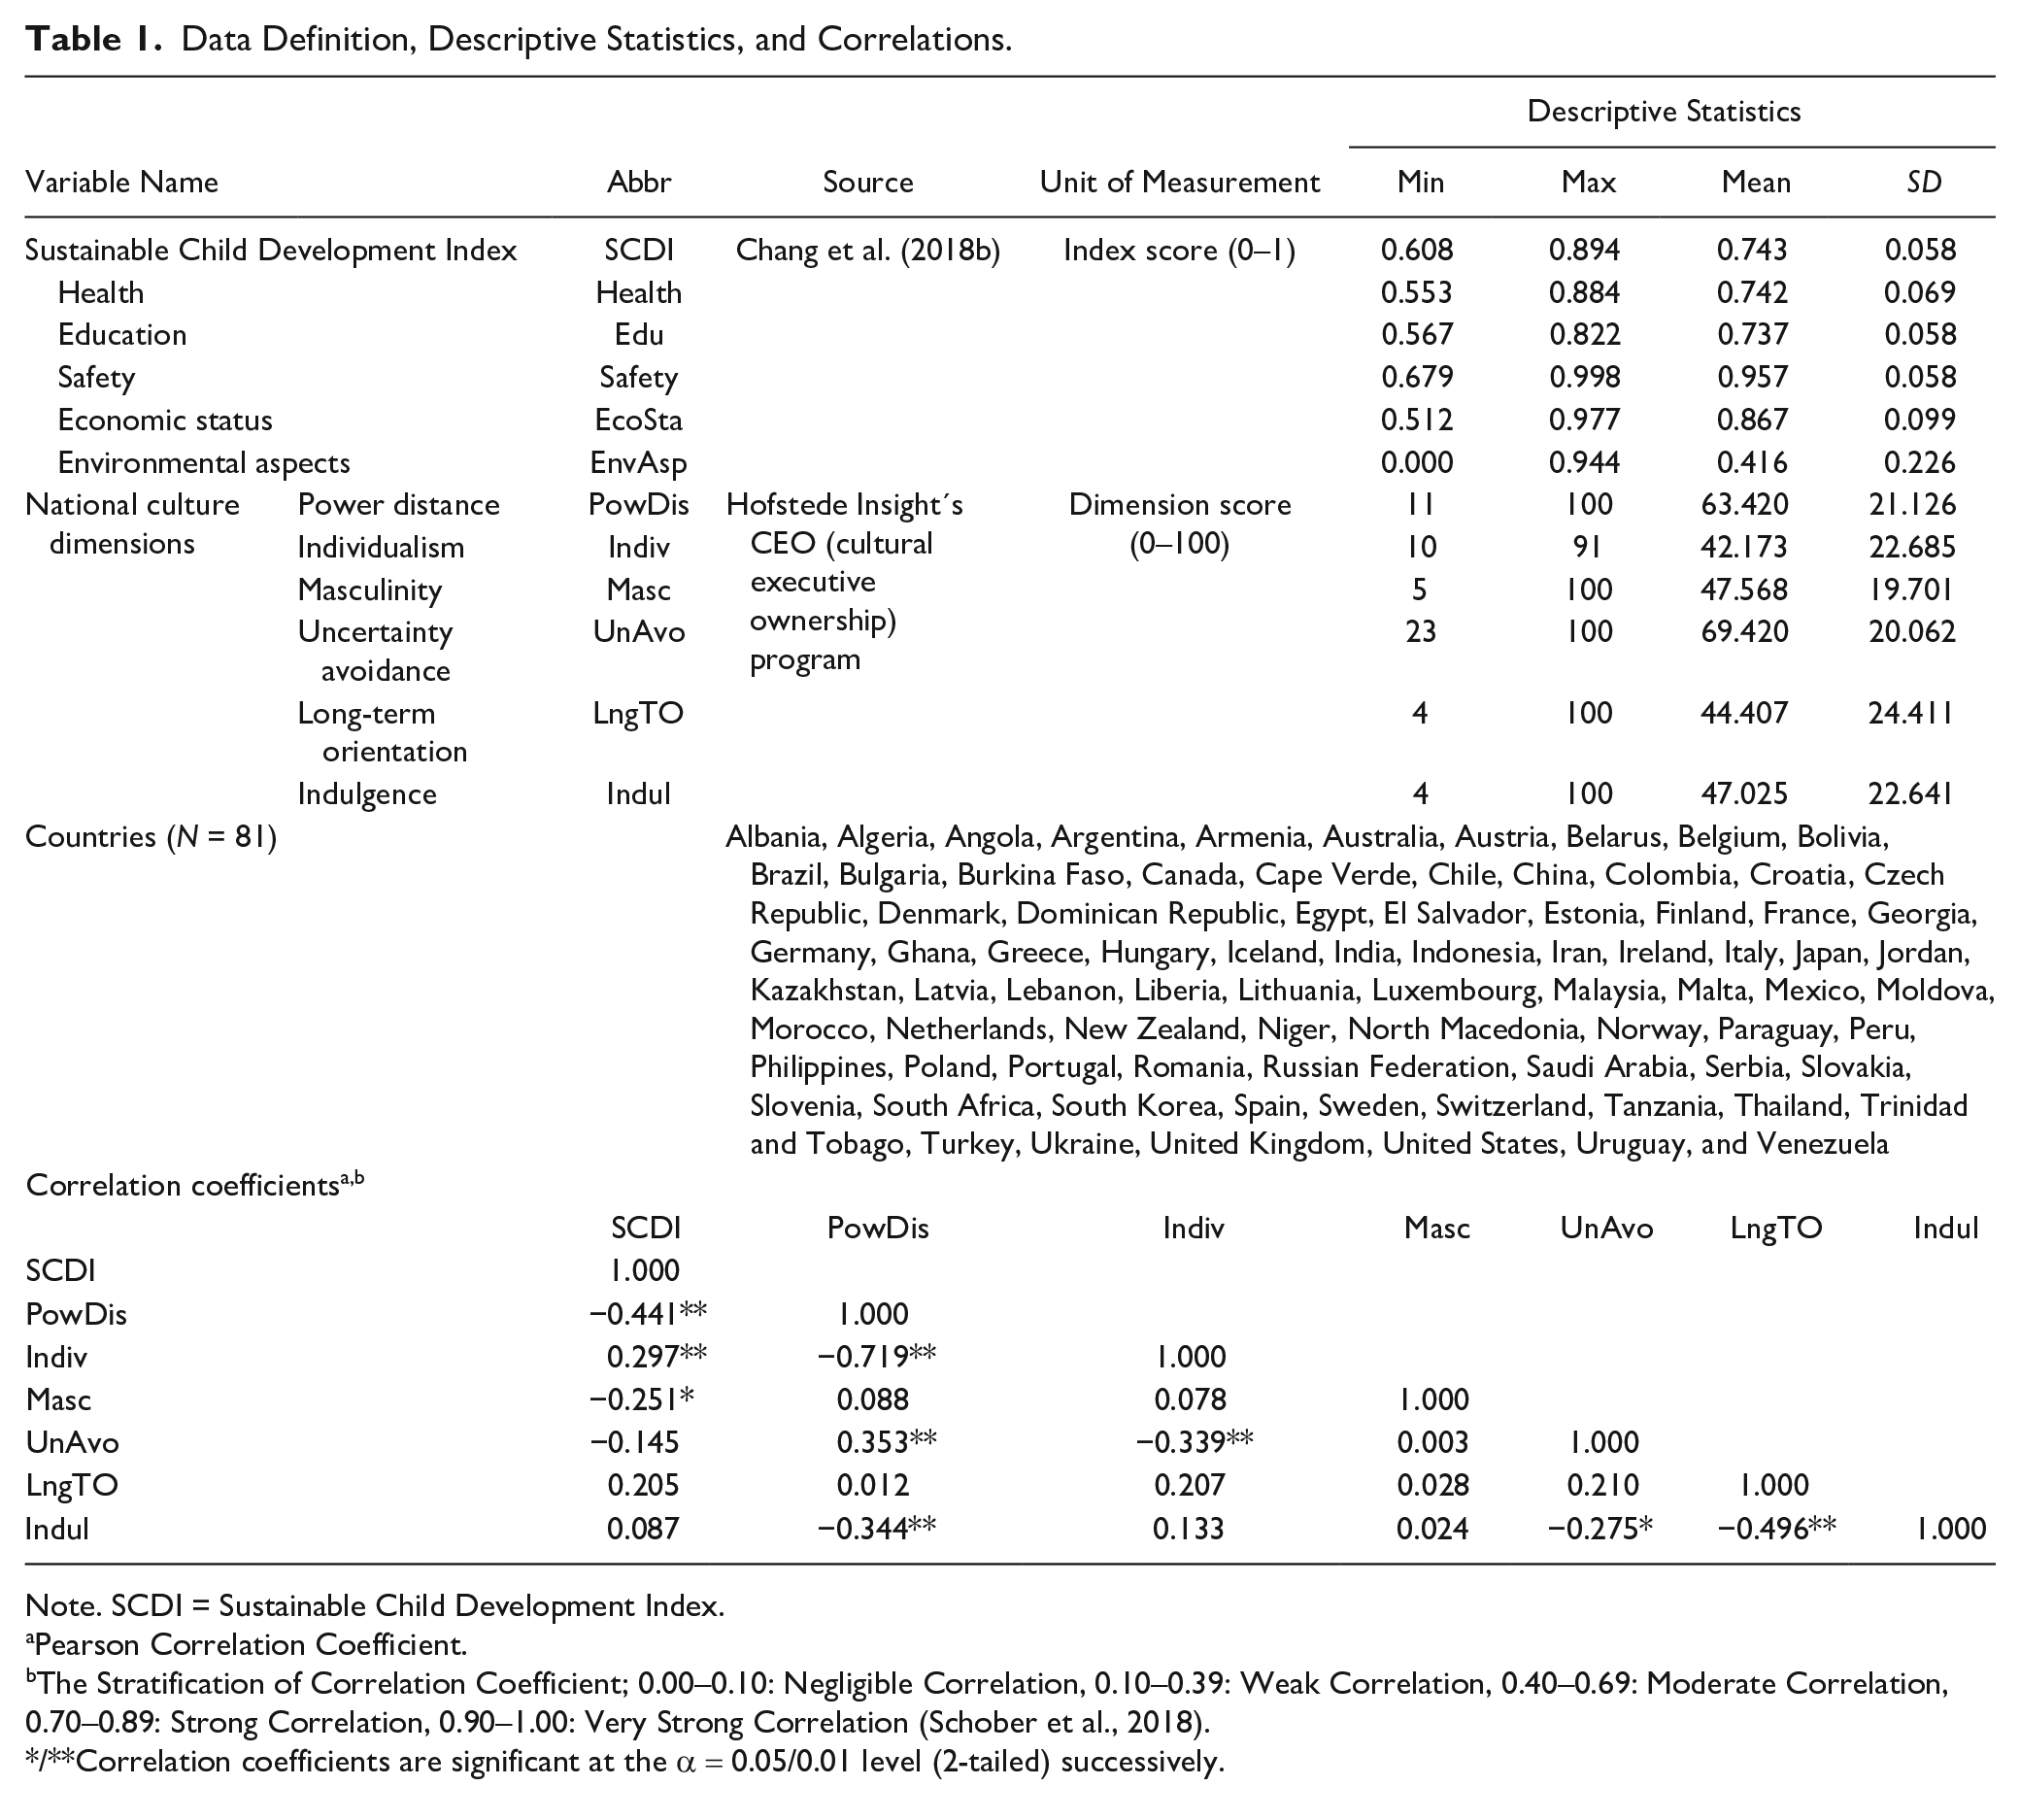
On the other side, the data of the NCD related to each country is gathered from Hofstede Insights Centre (HIC) (n.d.) website, which publishes huge data consisting of numerous countries. Due to the lack of data for both NCD and SCDI in some countries, we only found 81 countries that we could analyze in our research. The scatterplots of NCD and SCDI scores of countries are presented in Figure 2 and the data definition, descriptive statistics, and correlations of NCD and SCDI are expressed in Table 1.
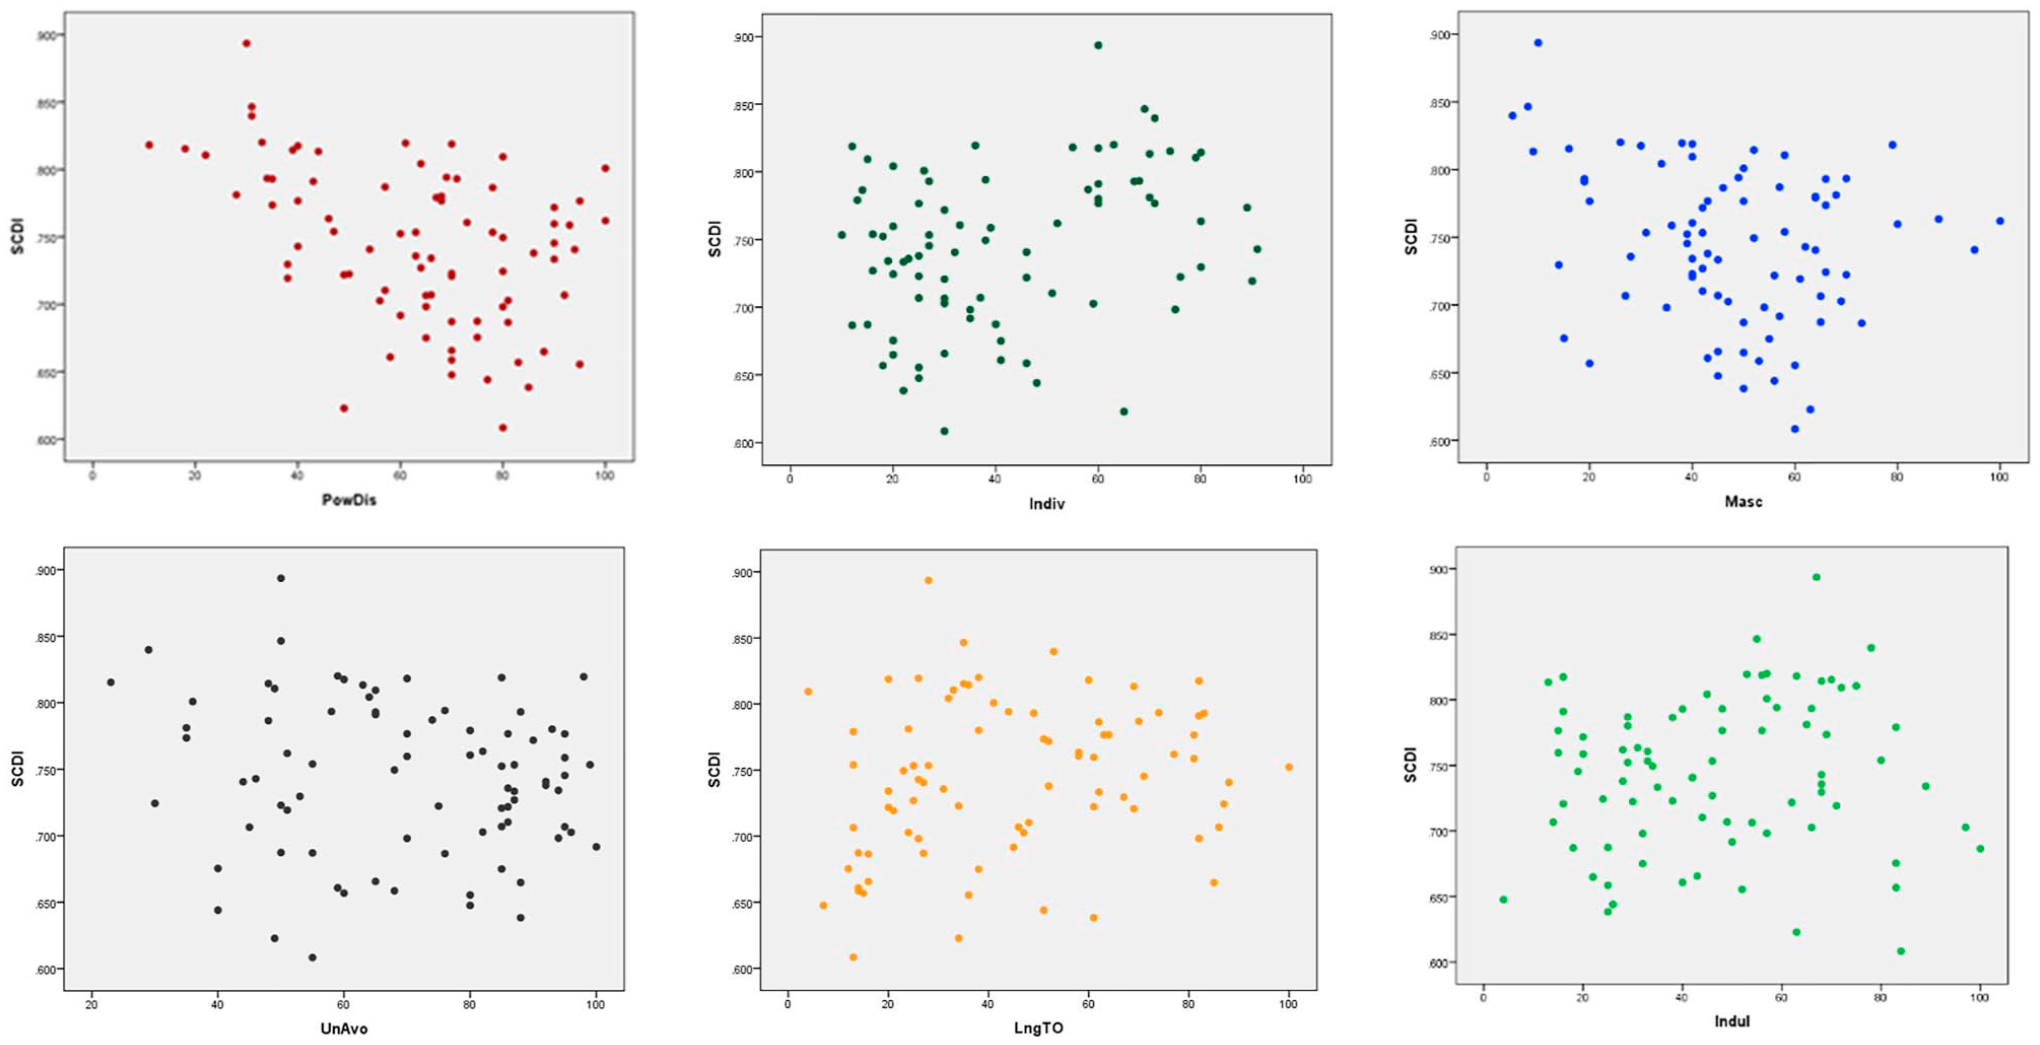
The scatterplot of NCD and SCDI scores of countries.
Data Definition, Descriptive Statistics, and Correlations.
Note. SCDI = Sustainable Child Development Index.
Pearson Correlation Coefficient.
The Stratification of Correlation Coefficient; 0.00–0.10: Negligible Correlation, 0.10–0.39: Weak Correlation, 0.40–0.69: Moderate Correlation, 0.70–0.89: Strong Correlation, 0.90–1.00: Very Strong Correlation (Schober et al., 2018).
/**Correlation coefficients are significant at the α = 0.05/0.01 level (2-tailed) successively.
Having examined scatterplot of the dependent and independent variables, we can see that there are roughly non-linear relationships between the endogenous and exogenous variables.
On perusing the correlation coefficients, there is a negative moderate correlation between SCDI and PowDis and a negative weak correlation between SCDI and Masc, and these correlations are statistically and significantly different from 0 at the 5% level of significance. Moreover, there is a positive weak correlation between SCDI and Indiv. Regarding correlation among NCD, there is a negative strong and negative weak correlation between PowDis and Indiv, and between PowDis and Indul, successively. Besides, there is a positive weak correlation between PowDis and UnAvo. Additionally, there is a negative weak correlation between Indiv and UnAvo, and between UnAvo and Indul, sequentially, and there is a negative moderate correlation between LngTO and Indul.
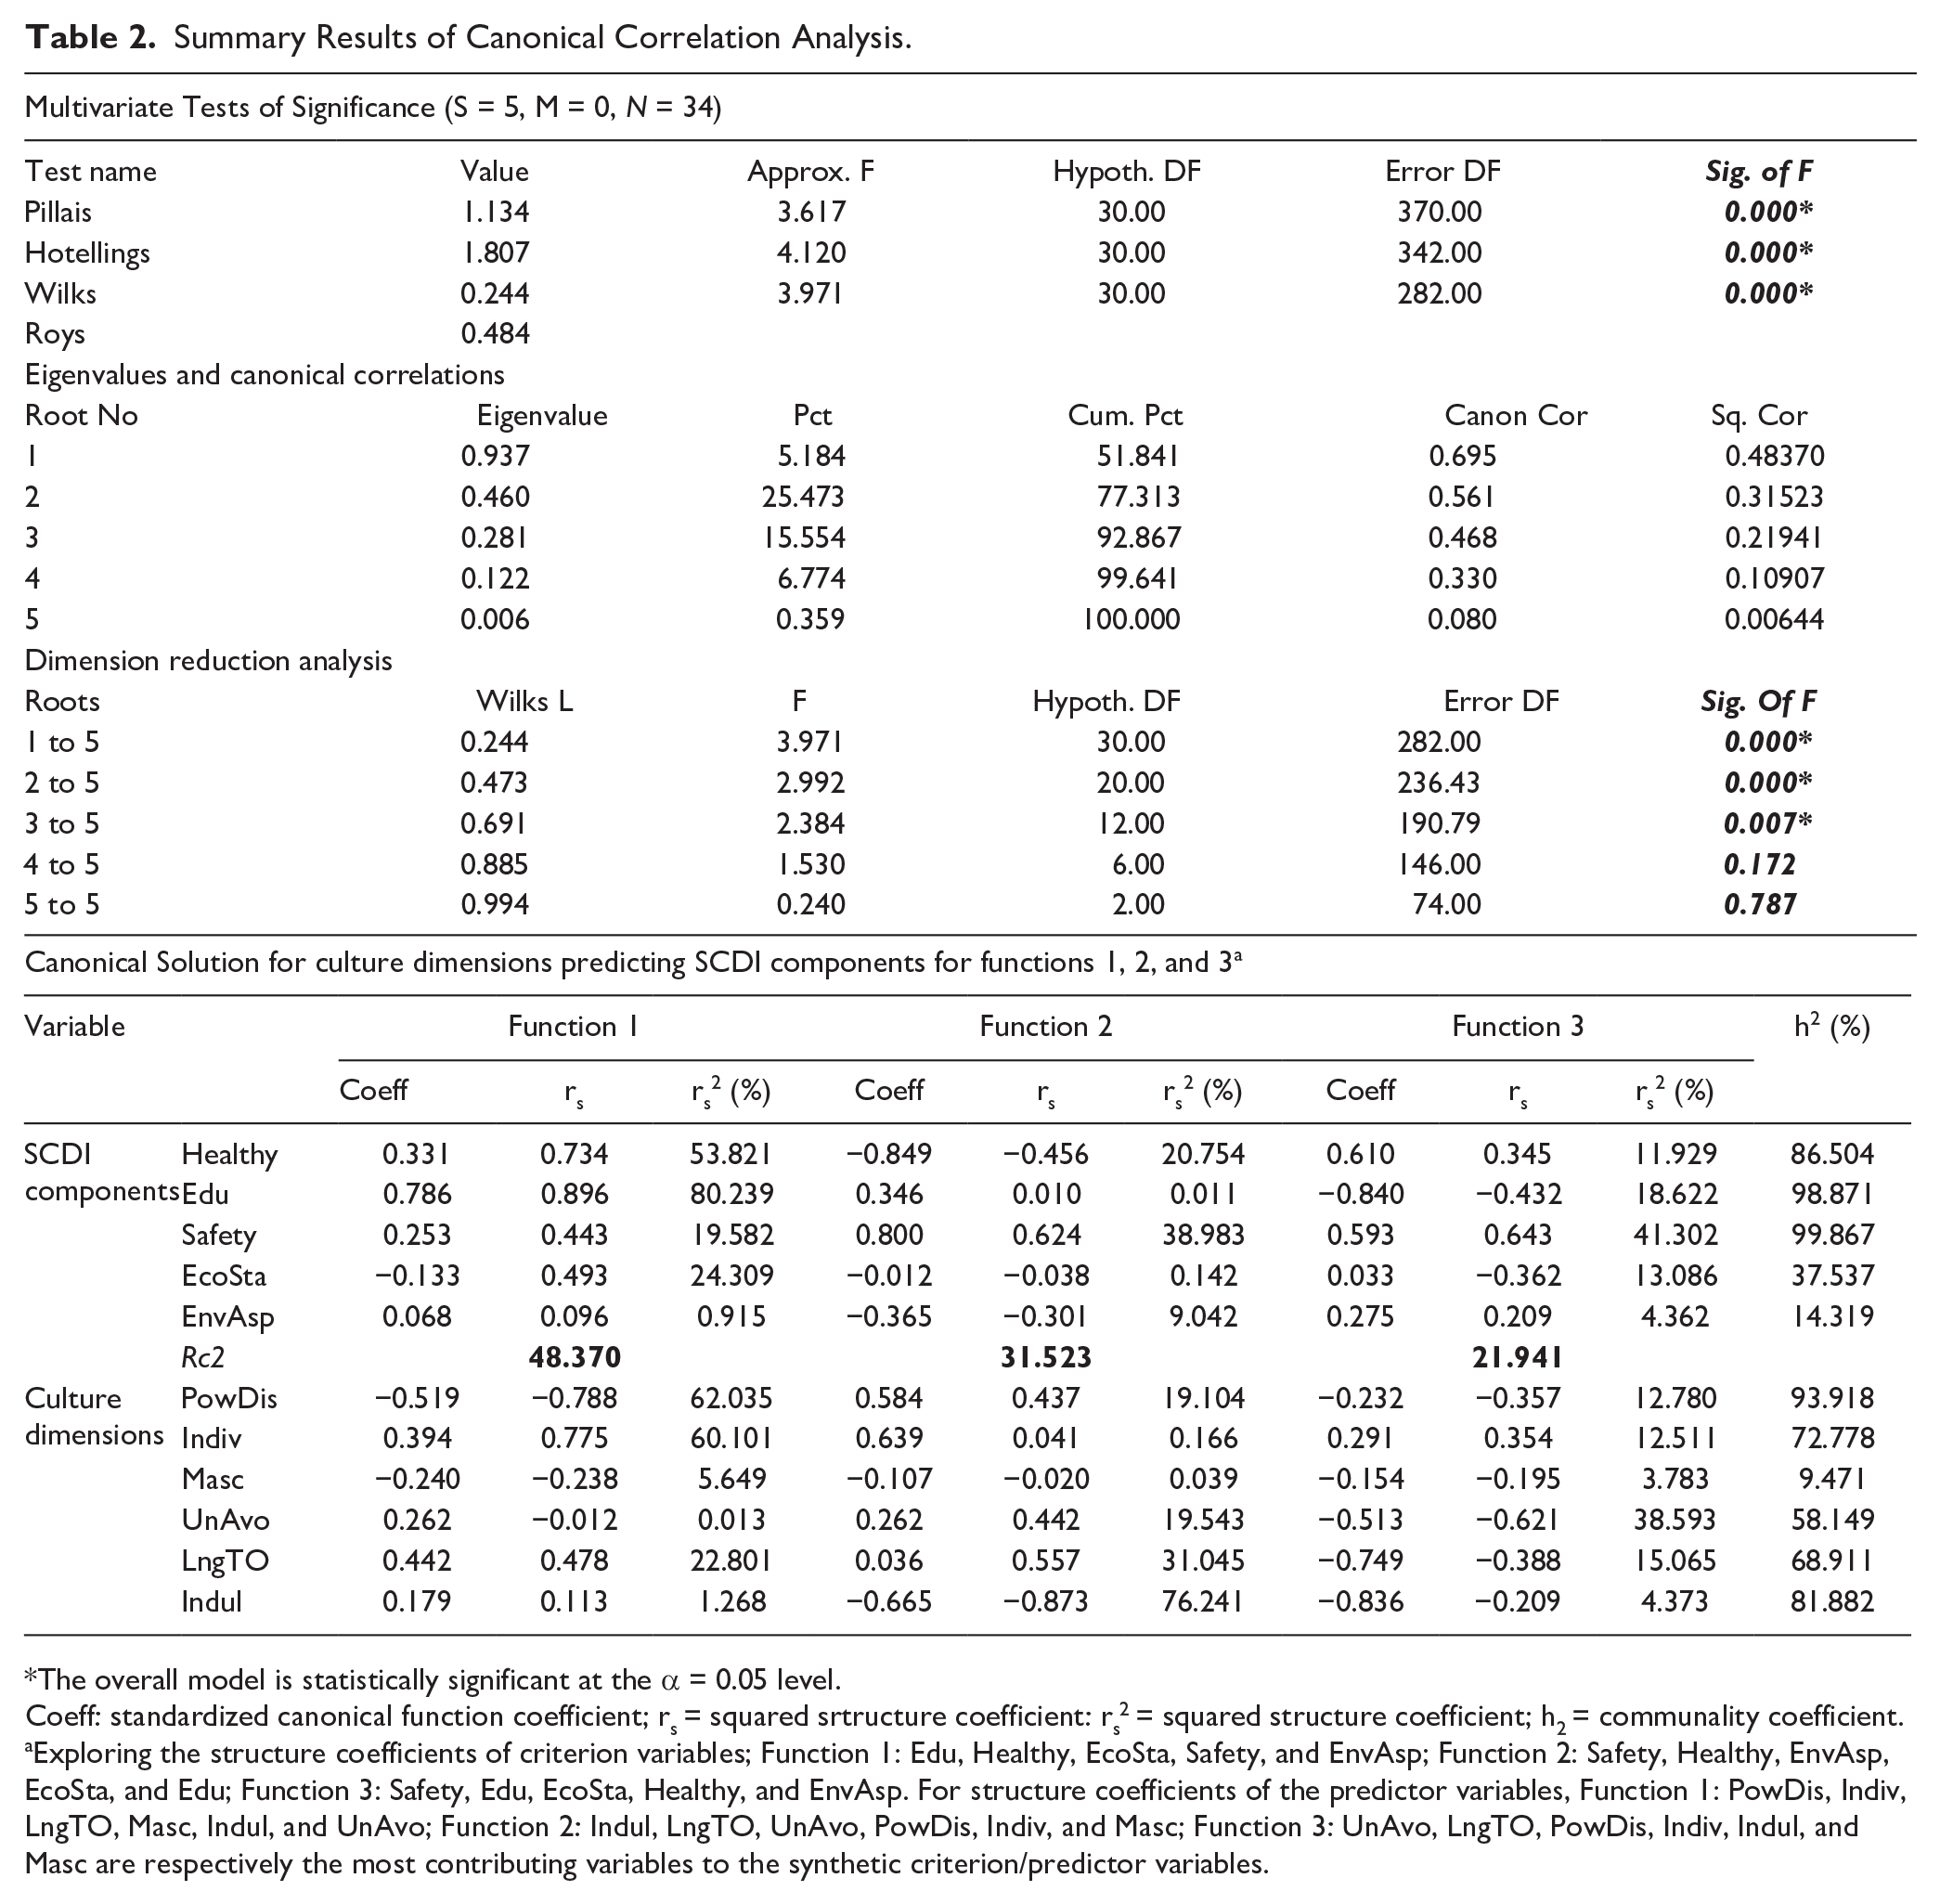
Before conducting a logarithmic multiple regression model explained in the pursuing part, to specify and measure the associations between data sets which cover components of SCDI and Hofstede’s cultural dimensions, Canonical Correlation Analysis (CCA) is performed and the summary results of CCA are presented in Table 2.
Summary Results of Canonical Correlation Analysis.
The overall model is statistically significant at the α = 0.05 level.
Coeff: standardized canonical function coefficient; rs = squared srtructure coefficient: rs2 = squared structure coefficient; h2 = communality coefficient.
Exploring the structure coefficients of criterion variables; Function 1: Edu, Healthy, EcoSta, Safety, and EnvAsp; Function 2: Safety, Healthy, EnvAsp, EcoSta, and Edu; Function 3: Safety, Edu, EcoSta, Healthy, and EnvAsp. For structure coefficients of the predictor variables, Function 1: PowDis, Indiv, LngTO, Masc, Indul, and UnAvo; Function 2: Indul, LngTO, UnAvo, PowDis, Indiv, and Masc; Function 3: UnAvo, LngTO, PowDis, Indiv, Indul, and Masc are respectively the most contributing variables to the synthetic criterion/predictor variables.
As examining the findings obtained from Table 2, the CCA generates five functions with squared canonical correlations, (
When scrutinizing the (
Exploring the standardized canonical function coefficients of criterion variables; Function 1: Edu, Healthy, Safety, EcoSta, and EnvAsp, Function 2: Healthy, Safety, EnvAsp, Edu, and EcoSta, Function 3: Safety, Edu, EcoSta, Healthy, and EnvAsp are respectively the most contributing variables to synthetic criterion variable. On the other hand, looking at canonical function coefficients of the predictor variables, Function 1: PowDis, LngTO, Indiv, UnAvo, Masc, and Indul; Function 2: Indul, Indiv, PowDis, UnAvo, Masc, and LngTO; Function 3: Indul, LngTO, UnAvo, Indiv, PowDis, and Masc are the most contributing variables to the synthetic predictor variable, respectively. Additionally, as checking the communalities (h 2 ) across the three functions for each variable; Safety, Edu, Healthy, EcoSta, and EnvAsp and PowDis, Indul, Indiv, LngTO, UnAvo, and Masc are seen as the most contributors to synthetic criterion/predictor variable successively.
As a summary, considering the direction of the sign of structure coefficients (rs) of the predictor variables (culture dimensions), especially the sign of structure coefficients in Function 1 having the most squared canonical correlations (explaining the most amount of variance between the variable sets), complies with the sign of correlation coefficients indicated in Table 1. On the other hand, it can be expected that the coefficients of canonical correlation and multiple regression often illustrate similar signs as alleged by Lutz and Eckert (1994), but this similarity may not occur in cases such as the logarithmic multiple regression model conducted in this study.
In our study, for examining the hypotheses, we try to explore the effects of NCD (PowDis, Indiv, Masc, UnAvo, LngTO, and Indul) on the SCDI by delineating explanatory modeling. However, the endogenous and exogenous variables have different measurement units. Thus, we recommend a logarithmic multiple regression model in which the coefficients do not change with the transformation, and which provides convenience in reporting alleged by Wooldridge (2012: 192). The logarithmic multiple regression model is explained in equation (1)
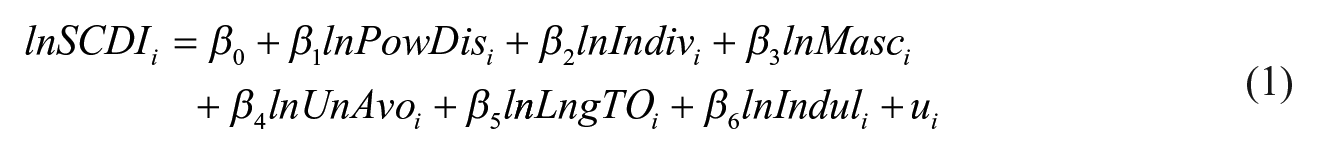
lnSCDIi: The natural logarithm of SCDI value of the ith country,lnPowDis: The natural logarithm of PowDis score of the ith country,lnIndivi: The natural logarithm of Indiv score of the ith country,lnMasci: The natural logarithm of Masc score of the ith country,lnUnAvoi: The natural logarithm of UnAvo score of the ith country,lnLngTOi: The natural logarithm of LngTO score of the ith country,lnInduli: The natural logarithm of Indul score of the ith country,ui,: The error (residual) term in the regression model.
Results of Analysis
To examine the hypotheses regarding our research, we apply a multiple logarithmic regression analysis for the model expressed below. The summary of multiple regression analysis is demonstrated in Table 3.

Endogenous Variable: lnSCDI.
For checking the normality assumption, the Jarque-Bera Normality Test is performed for the residual of regression and the null hypothesis (H0: The residual of regression is distributed normality) is accepted at the significance level of α = 0.05.
For examining the assumption of heteroscedasticity, the White Heteroscedasticity Test is conducted and the null hypothesis (H0: There is homoscedasticity in the model) is admitted at the α = 0.05 level.
The regression model and its coefficients are significant at the significant level of α = 0.05 level.
Due to the values of Tolerance and VIF of the exogenous variables are convenient for the threshold values (>0.1 and <10 successively), it can be concluded that there is no multicollinearity in the regression model (Hair et al., 2014).
By scrutinizing the results obtained from Table 3, it can be deduced that the regression model is overall statistically significant at the 95% confidence interval. The coefficients of exogenous variables (PowDis, Masc, and LngTO) in the regression model are significant at the significance level of α = 0.05 and these findings underpin the assumptions that three NCD (PowDis, Masc, and LngTO) have effects on SCDI. However, in contrast to our expectations, the coefficients of other exogenous variables (Indiv, UnAvo, and Indul) are not statistically significant at the α=0.05 level.
When the signs of the coefficients of exogenous variables are examined, the signs of coefficients of these significant variables (PowDis, Masc, and LngTO) comply with the hypotheses (
As a result, the signs of the exogenous variables (PowDis, Masc, and LngTO) match with the theory of our research, which based on the literature, as discussed in the former sections. The regression model also guarantees basic assumptions (multicollinearity, normality, heteroscedasticity, etc.,) of regression as noted in Table 3. Thereby, the outputs gained from the regression analysis support the robustness of the statistical analysis and elevate us to comment on these findings in the conclusion and discussion sections.
Conclusion and Discussion
This study was conducted to reveal whether cultural differences among societies may affect their child developmental goals; thus, we investigated the possible impact of national cultural dimensions on SCDI. The results have revealed that both PowDis and Masc have significant and negative predictive effects on SCDI scores. In addition, the findings show that LngTO has significant and positive predictive effect on the SCDI scores of countries.
There is some related empirical evidence in the interdisciplinary literature that is consistent with our findings. For instance, Figlio et al. (2019) reveal that students from countries with long term-oriented attitudes perform better in schools than students of short-term oriented countries. And also, Galor and Özak (2016) who found a positive correlation between preferences for delayed gratification and indicators of overall wealth of nations (e.g., education, technology adoption, and savings) in fact support our findings. Consistent with our finding that Masc has a negative, significant relationship to SCDI, Rodrigues and Blumberg’s (2000) study shows that masculine societies invest less on human development programs, particularly child development, when compared to feminine societies. Dealing with PowDis dimension of culture, Woldarsky et al. (2019) revealed that mothers in cultures with high power distance scores tend to prioritize more their children’s adaptation to their environment and less children’s desires and needs while the mothers in cultures characterized by a lower power distance focus more on development of their children.
On the other hand, the null hypotheses related to the impacts of Indiv (second hypothesis), UnAvo (fourth hypothesis), and Indul (sixth hypothesis) on the SCDI are rejected since their coefficients in the regression models are not statistically significant at the 95% confidence interval. There are several studies in the literature that might provide explanations for the rejected hypotheses. To begin with, dealing with the second hypothesis (Indiv has a significant and positive predictive effect on SCDI), Tamis-LeMonda et al. (2008) point to the blurred boundaries between collectivistic and individualistic orientations along with studies on the contrasting developmental goals of parents with different cultural roots. Parents’ approach and attitudes for developmental goals vary from situation to situation and change as children develop (Tamis-LeMonda, 2003), though Bartlett and Ghoshall (1997) have claimed that societies are transforming toward greater individualism because of globalism. Second, dealing with the forth hypothesis (UnAvo has a significant and positive predictive effect on SCDI), tolerance of uncertainty (UnAvo), while varying by country (Ferraro, 2002; Hofstede, 1980), also has been shown to be related to individuals’ personality (Coats-Crowson, 2004). In their study on uncertainty avoidance, Reimann et al. (2008) also draw attention to the factors such as personality, socioeconomic status, educational level, occupation, personal experience, age, and gender all of which can have possible effects on individual’s view of the environment and uncertainty. In this respect, individual differences might be considered as a useful complement to cultural differences (McCrae, 2001). With regard to the hypothesis regarding indulgence, it is possible that overindulgence is associated with several detrimental results as emotional and behavioral problems both for children (Cui et al., 2016; Slinger & Bredehoft, 2010) and even for parents (Bredehoft, 2013; Walcheski et al., 2007). Rehm et al. (2017) also concluded that parents not only decide to indulge but also diminish it in certain cases such as an unexpected financial turmoil.
Many studies (e.g., Figlio et al., 2019; Johnson, 2007) have been conducted on the relationship between various cultural attitudes and child-rearing styles of countries. However, to the best of our knowledge no studies have been carried out previously that specifically focused on the impact of cultural orientations on SCDI scores of countries. Our study shows that the general cultural orientations of the countries shape their child-rearing styles as well as their approaches and practices on this issue.
However, several general limitations of the current study need to be mentioned. First, with regard to sampling, since our study only included 81 countries with valid data, the inferences should be evaluated in the context of these countries. Second, since the main focus of this study was cultural dimensions, we did not consider other factors that could also affect SCDI.
With regard to the SCDI, there are a number of limitations. First, the data are from 2015 and updated data may lead to different conclusions. Second, another limitation of the SCDI data is that the validity of our study depends on the quality of data used to develop the SCDI scores. In particular, the lack of data for some countries and unreliability of data sources for others are among the key issues when developing such indices. Third, while calculating SCDI score (indicators, criteria, subthemes, and themes) were all considered equally important for aggregating the scores from the indicator, criterion, subtheme, theme to index the level; this procedure might not have been the most appropriate choice.
If SCDI and NCD data are updated and cover more countries, studies can be conducted for countries with different cultural characteristics or in different regions in future. If SCDI data are published periodically, studies for the countries determined within the scope of this research can be carried out to reveal the change over time. Moreover, since culture is not a variable that changes easily, other dependent variable the SCDI scores for countries can be refined and updated when additional topics, indicators, and data regarding sustainable child development become more available. Hopefully, the results obtained in this study will lead to further research on factors that can explain the variation in SCDI, especially for the children, that is the promise of our future.
Footnotes
Appendix
The Compounds of Sustainable Child Development Index
| Theme | Subtheme | Criterion | Indicator |
|---|---|---|---|
| Health | Nutrition | Low birth weight | Percentage of infants born with low birth weight (<2500 g) |
| Child mortality | Under 5 mortality | Under-five mortality rate (probability of dying by age five per 1000 live births) | |
| Mental health | Suicide | Suicide rate (per 100,000 aged 15–29 years) | |
| Hazardous pollutant | Household and ambient air pollution | Mortality rate attributed to household and ambient air pollution (per 100,000 population) | |
| Air pollution | Air pollution, population exposed to levels exceeding World Health Organization (WHO) value (%) | ||
| Immunization coverage | Diphtheria tetanus toxoid and pertussis (DTP3) immunization | Diphtheria tetanus toxoid and pertussis (DTP3) immunization coverage among one-year-olds (%) | |
| Risk behavior | Alcohol use | 15–19-years-old heavy episodic drinkers (population) (% by country) | |
| Adolescent fertility | Adolescent fertility rate (per 1000 girls aged 15–19) | ||
| Oral health | Dental treatments | DMFT(decayed, missing, or filled among 12-year-old | |
| Health expenditure | Public health expenditure | Health expenditure, public (% of total health exp.) | |
| Education | Attendance of education | Enrolment in primary school | Gross enrolment ratio, primary, both sexes (%) |
| Enrolment in secondary school | Gross enrolment ratio, secondary, both sexes (%) | ||
| Early childhood education | Enrolment of kinder garden | Gross enrolment ratio, pre-primary, both sexes (%) | |
| Gender equality | Gender equality in enrolment | Gross enrolment ratio, pre-primary, gender parity |
|
| Government support on education | Public expenditure on education | Government expenditure on education (% of GDP) | |
| Safety | Violence and crime | Criminal victimization | Intentional homicide count and rate per 100,000 population |
| Demographic structure | Sex ratio | Sex ratio at birth (ratio) | |
| Economic status | Housing quality | Electricity coverage | Access to electricity (% of population) |
| Youth unemployment | Youth unemployment rate (% of total labor force ages 15–24) | ||
| Macroeconomic situation | National debts | Public debt (% of GDP) | |
| Environmental aspects | Freshwater vulnerability | Risk of depleting freshwater resources | Water depletion index (WDI) (ratio) |
| Renewable energy consumption | Consumption of renewable energy | Renewable energy consumption (% of total final energy consumption) |
Declaration of Conflicting Interests
The author(s) declared no potential conflicts of interest with respect to the research, authorship, and/or publication of this article.
Funding
The author(s) received no financial support for the research, authorship, and/or publication of this article.