
Abstract
This study examines the influence of the Belt and Road Initiative on China’s inbound tourist market, generated from countries and regions along the Belt and Road, using a gravity model with a difference-in-differences method. Panel data for 2008–2016 indicate that the Belt and Road Initiative has direct and significant positive effects on Chinese international tourist-generating markets, but the annual treatment effects are only partly significantly positive. We also examined the heterogeneous effects and mechanism of the Belt and Road Initiative on the inbound tourist market by grouping countries according to the levels of trade openness with China and economic development. The heterogeneous effect tests reveal that China’s international tourist origin countries with low levels of trade openness with China and high levels of economic development benefit from the Belt and Road Initiative. The findings of this study provide policy guidance on expansion for China’s inbound tourism market.
Keywords
Introduction
China’s “Belt and Road Initiative” (B&R Initiative) has gained support from more than 100 countries, regions, and international organizations, arousing worldwide attention since it was first formulated. The Chinese government started the initiative with the goal of promoting a community with a shared future, given the complexities of a world characterized by global economic uncertainty, trade protectionism, and terrorism. Tourism was regarded as a sector possessing natural advantages in promoting connectivity among countries and regions along the B&R, enhancing the possibility of achieving a win–win result for all nations involved. Since the B&R Initiative was proposed by President Xi Jinping, China has striven to enhance its inbound tourist market and promote mutual exchange between the international tourist markets of the countries along the Belt and Road. First, China established a “Strategic plan for the cooperative development of the silk road economic belt and the 21st-century maritime silk road” that set out the high-level design of the B&R Initiative, with more detail provided in its 3-year action plan for 2015–2018. The “13th Five-Year Plan for Tourism Development,” issued in 2016, further defined the development path and goals for B&R tourism. To promote the development of tourism along the B&R, the Chinese government has made the following significant efforts.
First, a series of bilateral and multilateral tourism cooperation mechanisms have been established, including China–ASEAN, China–Central and Eastern Europe, and China–Russia–Mongolia mechanisms. The first China–ASEAN tourism sector meeting, the first China–South Asia tourism ministers’ meeting, and a conference of tourism ministers along the B&R were held to provide institutional guarantees for deepening the B&R program in tourism. In cooperation with key countries along the B&R, China established a “Year of Tourism” between China and other relevant countries, including Russia, Kazakhstan, and the ASEAN countries.
Second, regarding market development, the Chinese government defined the theme of the Year of Tourism as the “Beautiful China–Silk Road Tourism Year” for four consecutive years and carried out a series of effective publicity and promotion activities around the world to enhance the influence of the Silk Road tourism brand. The Maritime Silk Road Tourism Promotion Alliance and the Land Silk Road Tourism Promotion Alliance were established to advance cooperation among countries, regions, provinces, and cities along the B&R in terms of mutual delivery of tourists, joint construction of tourist routes, and destination marketing.
Third, the Chinese government strengthened connectivity and facilitated tourism access with initiatives in areas such as aviation, visas, and risk management. Under the B&R framework, the Chinese government contributed to launching direct flights between China and Central and Eastern Europe countries and continuously coordinated with relevant parties to simplify visa policies. At present, there are 21 visa-free and 37 visa-on-arrival countries and regions in China, which has greatly promoted travel between countries and regions along the B&R.
According to calculations by the China National Tourism Administration, the bidirectional scale of tourist flows between China and countries along the B&R exceeded 25 million trips, which is equivalent to 70% of the global international tourist market. The Chinese national tourism department expects that, during the period of China’s 13th Five-Year Plan, China will attract visits of 85 million people from countries along the B&R, boosting consumption by approximately US$110 billion. At the same time, China will send more tourists to countries along the B&Ritself. 1
However, there are two opposing perspectives regarding the influence of the B&R Initiative among countries and regions along the B&R. Most researches consider that the B&R Initiative will strengthen economic, trade, tourism, and cultural exchanges between China and neighboring emerging economies. However, a few people argue that there may be negative short-term effects from the B&R Initiative (Sun et al., 2017). Media reports state that tourism should be accelerated by the B&R Initiative. Nevertheless, the following questions arise: Will the effect of the B&R Initiative on the international tourist market be as significant to China as expected? How will the tourism market be influenced by the B&R Initiative? Is there any heterogeneity among China’s overseas tourist markets? Which countries or regions will be most significantly affected? These questions have yet to be answered.
The purpose of this article is to examine the influence of the B&R Initiative on China’s B&R-related inbound tourist market using an empirical methodology. One view is that, because most of the countries and regions along the B&R are developing economies, the capacity and capability of their outbound travel markets might not increase rapidly in the near future. Conversely, however, as the economic development of these countries and regions is interconnected and all of them will be stimulated by the B&R Initiative, the strength and potential of this market might grow significantly. Based on these contrasting views, we adopt a gravity model with a difference-in-differences (DID) method to determine the influence of the B&R Initiative on China’s major international tourist markets. The results provide important practical policy implications.
Empirical studies on the influence of the B&R Initiative on international tourism are few. In this context, this study makes the following theoretical and practical contributions. First, the theoretical contribution of this study is that it examines the influence of the B&R Initiative on inbound tourism under an origin–destination framework by treating the set of all origin–destination flows as a system. To focus on the systematic interaction of origin–destination flows, we use an augmented gravity model, which includes the economic, geographic, and psychological distance variables, as well as the origin and destination specific variables, respectively. Second, the study combines the gravity model of tourism with a DID method to test whether the B&R Initiative encourages inbound tourism demand in China. The model not only examines changes in any of the determinants in the function but also identifies the treated effect on China’s inbound tourism induced by the B&R Initiative to capture the net effect across the treated and untreated groups. This represents a methodological advance in policy assessment in tourism research. Third, in addition to the direct and net effect of the B&R Initiative on the inbound tourist market of China, this study examines the annual treatment effects and the heterogeneous effects of the B&R Initiative on the inbound tourist market based on grouping by economic development and trade openness levels, respectively. Fourth, it should be noted that this study eliminates the effect that visa policy makes. To be specific, the measure of 72-h Transit Visa Exemption for Foreign Nationals for citizens from 51 countries almost started contemporaneously with the “B&R Initiative.” 2 This contemporaneous policy changes of the visa may have effect on inbound tourist market of China, if not considered and included in this research, the effect arises from the visa policy would have been included in the influence of the B&R Initiative on the inbound tourist markets. Although the visa policy is only valid for four countries in the treated group and 20 countries in the untreated group, we include a dummy variable denoting this to ensure that the effect we measure for the B&R Initiative is accurate.
For our study period, we consider yearly observations from 2008 to 2016. The DID method requires data at least 1 year both before and after the policy implementation. Considering that global financial crisis in 2008 engendered a big blow on the international travel market, we choose 2008 as the starting point of our empirical study, to screen off the effects of the financial crisis and avoid long-term effects.
The remainder of the article is structured as follows. The second section presents a literature review and the theoretical framework. The third section presents our empirical strategy. The fourth section details the data collection and fifth section presents the estimation results. Sixth section presents the robustness tests. The final section provides a discussion and conclusion.
Literature review and theoretical framework
Literature review
The B&R Initiative is a significant national strategy-based policy that may change China’s inbound tourism market landscape by influencing tourist arrivals from the B&R countries. Policy instruments that may affect tourism include interest rates, anti-inflation policies, exchange rate controls, and indirect taxation (Prideaux, 2005). Empirical research indicates that policy can significantly influence international tourism demand (Qu and Lam, 1997), including the relaxation of visa requirements (Neumayer, 2010; Qu and Lam, 1997; Vietze, 2012), economic development policies (Casado, 1997), currency restrictions (Martin and Witt, 1987), and ecological and tourism taxes (Durbarry, 2008; Munoz, 2007). In addition, empirical studies prove that the impact of economic policy uncertainties on tourist flows is significantly negative (Balli et al., 2018; Ongan and Gozgor, 2018). However, there are multiple factors that may influence international tourism demand. The existing studies categorize the impacts according to three aspects: the origin, destination, and the interrelation of origin and destination.
When considering the tourist-generating region, income is a predominant aspect considered in most of the previous tourism demand studies, and it is a fundamental concept in the economic theory of demand (Duc Pham et al., 2017; Eilat and Einav, 2004; Eugenio-Martin et al., 2008; Vietze, 2012). Usually, income is proxied by per capita disposable personal income, gross domestic product (GDP) per capita, or gross national product per capita (Blake et al., 2006; Duc Pham et al., 2017; Lim, 1997). The relative price of tourism in the destination country is another important determinant of demand (Dogru et al., 2017; Peng et al., 2015). Existing studies conceptualize the price factor in terms of two components, prices in the destination country, and prices in substitute or competing destinations (Athanasopoulos et al., 2018; Goh, 2012; Martin and Witt, 1988; Shafiullah et al., 2019; Song et al., 2010; Uysal et al., 1984). The two components are standardized by a relevant exchange rate to account for currency differences between the origin country and the destination (Dogru et al., 2017). The empirical literature considers the exchange rate as a potential determinant of international tourism demand (Crouch, 1995; Garin-Munoz and Amaral, 2000; Lim, 2004; Martin and Witt, 1987; Ongan and Gozgor, 2018; Var et al., 1990; Witt and Martin, 1987), and it can reflect the relative prices between origins and destinations (Lim, 2006; Martin and witt, 1987). However, the inclusion of exchange rates in tourism demand equations has been controversial (Dogru et al., 2017). Some studies include the exchange rate and prices standardized by relevant exchange rates (Ibrahim, 2013; Martin and Witt, 1988), and some include only prices standardized by the relevant exchange rate (Lim, 2004; Song and Wong, 2003; Song et al., 2010). Others use exchange rates adjusted by consumer price indices as an appropriate measure of the cost of tourism (Martin and Witt, 1987) and there are studies that include the exchange rate and the consumer price index (Martins et al., 2017).
In addition to studies on the basic factors that influence international tourism demand, studies on factors that promoting and impeding international tourist flow have been conducted empirically. Trade openness is included as a significantly positive element in the study of international tourism demand (Eugenio-Martin et al., 2008; Ibrahim, 2013; Vietze, 2011; Zhang and Jensen, 2007). Noneconomic factors, such as geographic, cultural, and institutional barriers between origin and destination countries, are included in the function of international tourism demand. The gravity model considers that bilateral flows, including tourism flows, between two countries are inversely proportional to the distance between them (Morley et al., 2014), and geographers have identified distance as one of the main variables influencing the volume of flows (Prideaux, 2005). Usually, distance is contained in the gravity model to explain the international tourist flows (Keum, 2010; Khadaroo and Seetanah, 2008; Morley et al., 2014). Cultural factors are considered in the modeling of international tourism demand, including either cultural proximity (Vietze, 2012) or cultural distance (Ahn and Mckercher, 2015; Liu et al., 2018; Yang and Wong, 2012). An empirical study by Vietze (2012) shows that vacation traveling was driven by the cultural proximity between the origin country and destination in the case of the United States. Yang and Wong (2012) find that cultural differences between the country of origin and the United States impede international travel, while Liu et al. (2018) discovers that cultural distance has a U-shaped relationship with China’s outbound tourism flow. Moreover, high-quality governance institutions may signal a high level of security, which may improve inbound tourism demand (Tang Chor Foon, 2018). Thus, the quality of institutions in country of origin is included in the tourism demand studies (Balli et al., 2016; Tang Chor Foon, 2018; Vietze, 2012).
In addition, an autoregressive term or lagged dependent variable is considered to capture word-of-mouth, changing travel tastes, tourist expectations and habit persistence, transportation costs, and marketing efforts (Croes and Vanegas, 2005; Crouch, 1995; Duc Pham et al., 2017; Lim, 1997; Song and Wong, 2003; Song et al., 2010). Empirical studies have also examined the possible effects on the international tourism demand of security (Zamparini et al., 2017), crime (Biagi and Detotto, 2014; Ross, 1992), the global financial crisis (Dogru et al., 2017; Kim et al., 2018), political instability and terrorism (Buigut and Amendah, 2016; Drakos and Kutan, 2003; Naudé and Saayman, 2005; Sönmez and Graefe, 1998; Yap and Saha, 2013), climate (Goh, 2012; Pintassilgo et al., 2016; Zamparini et al., 2017), health (Naudé and Saayman, 2005), epidemic disease outbreaks (Song et al., 2010), and foreign direct investment, particularly for business travel (Tang et al., 2007).
A variety of econometric models are utilized in tourism demand studies. The most basic model involves a single static regression, whereas the autoregressive distributed lag model and the error correction model extend the static single equation model by introducing time dynamics (Song et al., 2019). Panel data regressions are also often used in tourism demand studies (Song et al., 2019). The gravity model is another method used in empirical analyses of tourism demand. Although this method is sometimes criticized for its lack of theoretical background (Morley et al., 2014), studies have shown that it is valid in service trade (Kimura and Lee, 2006) and tourism studies (Keum, 2010; Morley et al., 2014), validating the use of the gravity model as the theoretical foundation for our study.
As tools of stimulation or restriction for inbound tourism demand, policies are shocking from outside. China’s usual practice is to stimulate industries using strategic industrial policies. Thus, Chinese scholars have been concerned about the effects of such policy changes as off-island duty free for Hainan International Tourist Island and visa exemptions for China’s inbound tourists (Song et al., 2018; Wu et al., 2013; Yan et al., 2013). Domestic and abroad policies that are included in previous international tourism demand studies are single policy, while the “B&R Initiative” is comprehensive policy. It takes time to formulate and then implement both the general and the tourism-specific policies of the B&R Initiative that may impact on tourism. The evaluation of this comprehensive policy framework is one of the contributions this study might make. By setting dummy variables to denote a specific policy, the previous studies on specific policy effect assessment could not analyze the annual treatment effect of the policy over year. The current study adopts the DID method to solve this problem.
After the launch of the B&R Initiative, an abundance of descriptive studies on inbound tourism development were conducted, including historical reviews, qualitative analyses of the B&R implementation, and development planning for tourism produced by the B&R Initiative (Xie et al., 2016; Yao and Hou, 2017). In addition, there are some quantitative studies on the inbound tourist market trends and temporal–spatial structures based on the B&R Initiative (Lin et al., 2016; Wang et al., 2017). However, empirical studies of the B&R Initiative and its effect on international tourism are rare owing to the very short time that the policy has been implemented. Tang and Feng (2018) estimate the effect of the B&R Initiative on the inbound tourism of China using a DID method and find that the effect is significantly positive. However, this study does not control for the common trend of growth, resulting in an artificially high estimate of the effect of the B&R Initiative. Moreover, a placebo test is not conducted and nor are the annual treatment effects of the B&R Initiative tested (Tang and Feng, 2018). In contrast to this perspective, another study argues that the B&R Initiative has increased the inefficiency of the tourism trade (Yin et al., 2015). The conflicting results of Tang and Feng (2018) and Yin et al. (2015) and the gaps in the former framework leave scope for further investigation. Therefore, we need to establish a robust econometric model to estimate the real effect of the B&R Initiative on the inbound tourist market to China.
Theoretical framework
Based on the literature review, we found that tourism demand depends on the interaction of a wide range of factors, including income, price, trade openness, culture, government regulations, political instability, terrorism, security or fear of crime, climate, health, and policies. These factors are relevant and have been considered from the origin and destination sides as well as in terms of the interrelations of the origin and destination. However, few studies have established a systematic structure or specific theoretical framework to explain the bilateral operation between origin and destination. The theoretical model of tourism demand that is applied most frequently in the literature is based largely on consumer theory (Morley et al., 2014), with some studies examining the supply side to explain the determinants of tourism demand (Goh et al., 2008; Hamilton et al., 2005; Naudé et al., 2005; Yap and Saha, 2013; Zhang and Jensen, 2007).
Most previous research based on the consumer economics approach and demand modeling of tourism flows tends to neglect supply-side concerns (Morley et al., 2014). However, characterizing tourism flows as a trade in services and applying economic trade theory means that considering the supply side and destination-linked factors is a necessity (Marrocu and Paci, 2013). Eugenio-Martin et al. (2008), Khadaroo and Seetanah (2008), and Eilat and Einav (2004) include factors that influence tourism demand in their modeling, based on destination and origin specific factors and factors relevant to the origin–destination relationship. Extending their frameworks takes into account the systematic interaction of tourism flows, by using gravity models and treating the set of all origin–destination flows as a system, with the influence of each factor on tourism demand reflected. Based on the previous bilateral tourism research, the conceptual processes of this research framework could be explained by theories of push–pull and distance decay, enabling the augmented gravity model to be applied well (Morley et al., 2014).
In this research, the B&R Initiative policy is the core independent variable and the theoretical framework is as follows: The B&R Initiative is a national strategy-based policy put forward by China, which is the destination country in this research. It is a comprehensive government-driven policy that politically, economically and culturally affects China and relevant countries along the B&R. The tourist flow is one of the most important areas influenced by the initiative. The B&R Initiative can be considered as a policy made by the destination government to pull the inbound arrivals from the B&R countries to China. The income level in the origin region is captured by the per capita GDP (Morley et al., 2014), which is the variable determining the push factor. It is used to measure how the traveling habits of people in the origin country respond to a change in their wealth levels (Eilat and Einav, 2004; Prideaux, 2005). The destination country’s GDP per capita is interpreted as an indicator of the destination’s development level and quality of life (Morley et al., 2014). It is expected to proxy factors such as the quality of infrastructure, communication, services, security, and health in the destination country. It acts as a catalyst of pull force for attracting foreign tourists (Cannonier and Burke, 2019; Oh, 2005; Zamparini et al., 2017). Relative price and economic, physical, and psychological distance can denote factors that facilitate or impede tourist flows interrelating the origins and destinations, following the theory of distance decay. Relative real exchange rates adjusted for inflation in both the origin and the destination countries can proxy the relative prices between the origin and destination countries (Durbarry and Sinclair, 2003; Martin and Witt, 1987). The trade openness of the origin country to the destination country can be interpreted as an indicator of the economic distance and connection, and geographic distance signifies the physical distance between the origin and destination countries. Cultural and institutional differences can proxy the psychological distance between origin and destination (Morley et al., 2014; Prideaux, 2005; Vietze, 2012) and other psychological distance factors can be included, such as to be neighbors.
Empirical strategy
Model specification
Based on the theoretical framework that we establish, the gravity model is adopted in this research as a valid tool to assess the effects of tourism-related policies, such as tourist taxes or promotional expenditure policies, which should have the same validity as those derived from traditional tourism demand models when examining changes in any of the determinants in the equation (Morley et al., 2014). Taking the log-linear form, the reduced-form augmented gravity model for tourism flows is written as follows:

where the dependent variable Y
ct is the number of tourist arrivals generated from country c to destination country i in year t;
The DID method is used to capture a clean estimator of the policy effect on China’s inbound tourist market caused by the B&R Initiative. In the most cases, the traditional method of evaluating a policy effect in the gravity model is to establish a dummy variable that defines whether the policy is implemented. Hence, the estimator obtained is not a pure policy effect. Using this traditional approach, it is likely that time trends and other factors will influence the year dummy variable. Further, the annual treatment effect of the policy cannot be investigated. Our empirical strategy distinguishes the annual treatment effect on the inbound tourism market from 2014 to 2016 which are differentially affected by the B&R Initiative. To be specific, a series of related supporting policies are studied and formulated consecutively in the periods that follow the launch of the B&R Initiative. Using the DID method, we have to compare pretreatment trends for the treated and untreated groups to ensure that the two groups share a common trend. In addition, DID can largely avoid the issue of endogeneity problems because policies are generally exogenous.
Based on model (1), to estimate the policy effect of the B&R Initiative on China’s inbound tourist market using the DID method, the equation becomes:

where the dummy variable
Measuring annual treatment effects
To evaluate how the impact of the B&R Initiative on the inbound tourist markets along the B&R evolved over time, we decomposed the post dummy into multiple year dummies, keeping 2014 as the benchmark. Thus, we also include treat × year12, treat × year13, treat × year15, and treat × year16 in model (2), enabling us to examine the difference between the treated and untreated groups before and after the occurrence of the B&R Initiative (Hering and Poncet, 2014).
Measuring the heterogeneous effect in subgroups
We divid Groups to distinguish the level of trade openness with China: Depending on their levels of trade openness to China, we divide the tourist-generating countries into a high-level group (when openness is higher than the average level of all samples) and a low-level group (when openness is lower than the average level of all samples). Groups to distinguish the economic development level: when a tourist-generating country’s GDP per capita is higher than the average level of all samples, we place it in a high-level economic development group, with the remaining countries being placed in a low-level group.
Robustness checks
We implement numerous alternative robustness checks. First, we conduct a placebo test to exclude the possibility that might influence the common trends between the treated and untreated group. Then, we run additional robustness checks, including regressions controlling for preexisting time trends and reducing the time frame of the research.
Data
Data on the treatment: Countries along the B&R that generate tourist flows to China
Our treatment group consists of 19 countries along the B&R that generate tourist flows to China, and for which the appropriate statistical data are available. The 19 countries are Singapore, Malaysia, Thailand, Indonesia, Mongolia, the Philippines, Vietnam, Myanmar, Poland, Russia, Kazakhstan, Turkey, Ukraine, Uzbekistan, India, Pakistan, Israel, Iran, and Egypt. The remaining tourist-generating countries for which statistics can be obtained, comprising 22 countries, are regarded as the untreated group (see Figure 1 and Table 1).
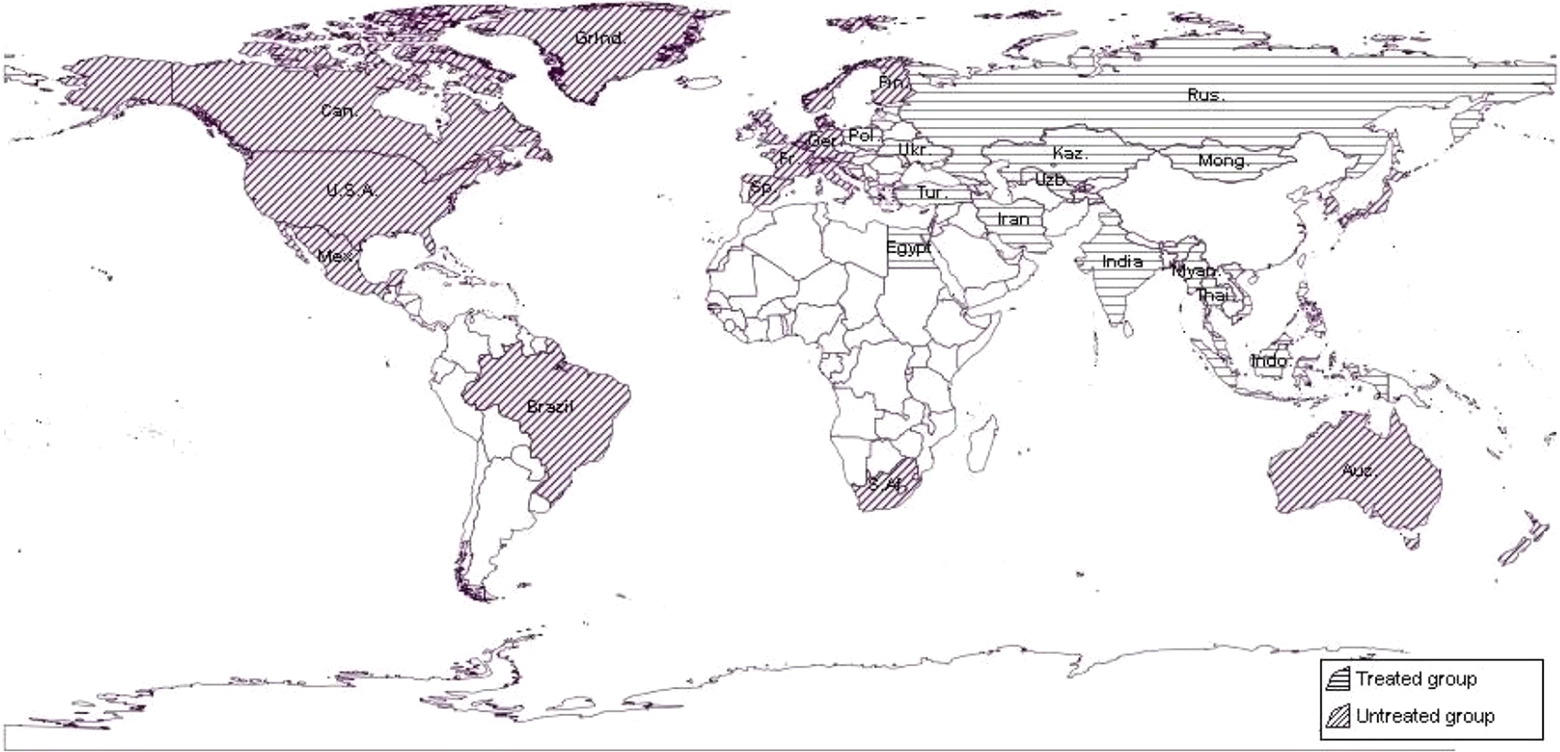
Map of sample countries. Source: Data from the National Bureau of Statistics of China.
List of sample countries.
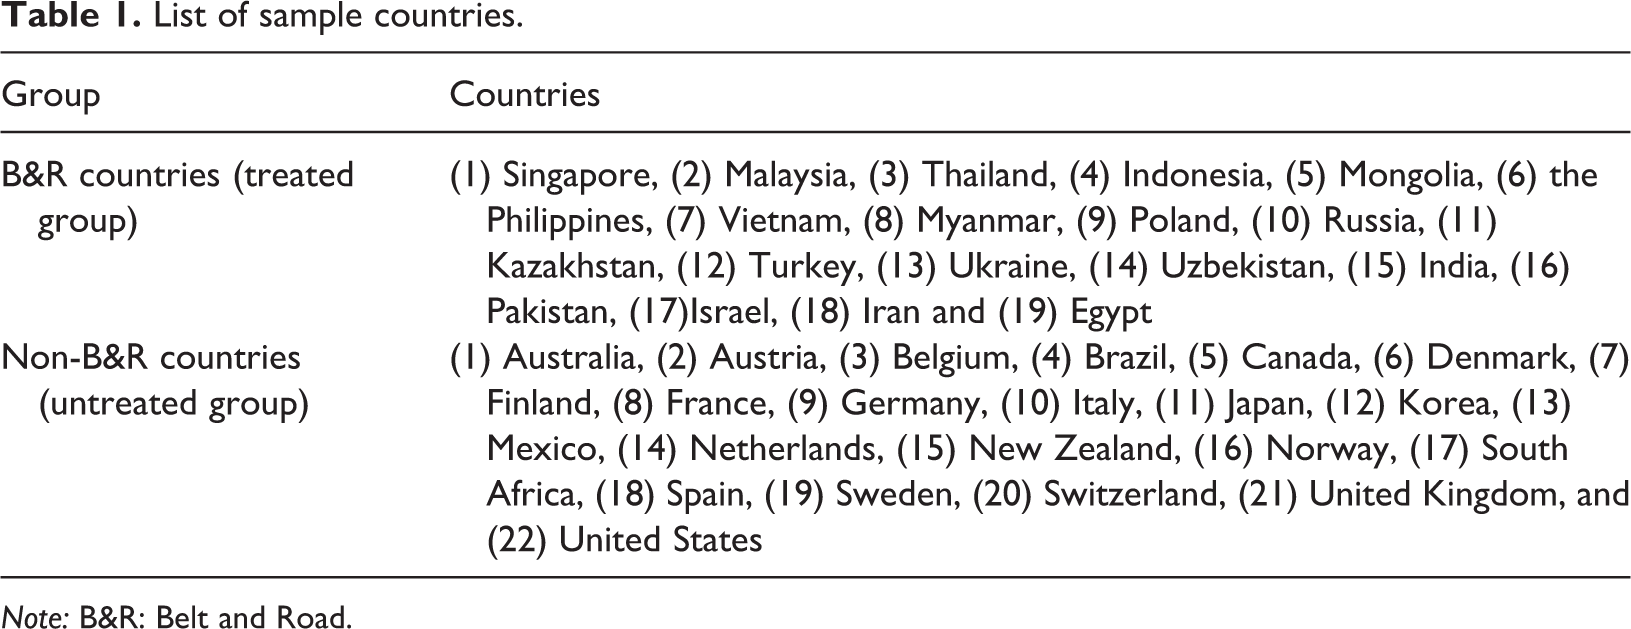
Note: B&R: Belt and Road.
Indicators and data
Dependent variable (
)
Inbound arrivals are frequently used in models explaining aggregate tourist flows to a single destination (Fuleky et al., 2014; Song and Li, 2008), and Vietze (2012) argues that the number of tourist arrivals is a more valid indicator than receipts as it measures tourism flows more accurately. Therefore, we use the number of annual international tourist arrivals from country c to China as a dependent variable, using data obtained from the National Bureau of Statistics of China.
The control variables
The income level in the origin country (
)
GDP per capita represents the main measure of development of an area (Zamparini et al., 2017). It is often used to proxy the income of the origin country (Croes and Vanegas, 2005; Eugenio-Martin et al., 2008; Song et al., 2010). Given that our panel comprises developing and developed countries, we use GDP per capita in 2010 constant prices to represent the purchasing power or income level that determines the number of people able to participate in travel (Prideaux, 2005). These data are acquired from the World Bank’s World Development Indicators.
Development level and quality indicator of the destination (
)
Rapid economic growth in destination represents improved infrastructure, communication, transportation, safety, and a higher quality of a wide range of services, all of which may constitute attractors of tourism demand (Cannonier and Burke, 2019; Oh, 2005; Zamparini et al., 2017). In this study, the GDP per capita of the destination country is interpreted as a destination development and quality indicator, measured in constant 2010 prices. These data are obtained from the World Bank’s World Development Indicators.
Relative price between origin and destination countries (
)
Martin and Witt (1987) suggest that exchange rates adjusted by consumer price indices are an appropriate measure of the cost of tourism. The usual justification for including an exchange rate variable in international tourism demand functions is that consumers are more aware of exchange rates than of destination costs of living for tourists and, hence, use the exchange rate as a proxy variable (Martin and Witt, 1987). We use the bilateral real exchange rate to denote relative prices between the origin and destination countries, and an increase in the real effective exchange rate indicates a currency appreciation in the origin. These data are obtained from the United Nations Conference on Trade and Development directly.
Geographic distance between origin and destination countries (
)
People generally initially depart from and arrive in big cities when traveling, owing to their accessibility and high-quality transport infrastructure. Therefore, previous studies use the distance between the capitals of the origin and destination countries to denote the geographic distance indicator (Khadaroo and Seetanah, 2008; Vietze, 2012). For example, when examining the cultural effects on inbound tourism into the United States, Vietze (2012) uses the distance between Washington and the capitals of the origin countries to proxy the distance indicator. In this study, we use the distance between two countries based on the bilateral distances between the biggest cities of those two countries, with the intercity distances being weighted by the share of the city in the country’s overall population. These data are obtained from the Centre d’Etudes Prospectives et d’Informations Internationales.
Economic distance between origin and destination countries (
)
The trade openness between the origin and destination countries can be interpreted as an indicator of economic distance and connection. We use total trade (imports and exports with China) as a proportion of GDP to measure the trade openness (Jensen and Jie, 2013; Su et al., 2013), using data accessed from the official website of the National Bureau of Statistics of China.
Cultural distance between origin and destination countries (
)
Cultural distance is an indicator that proxies the psychological distance between origin and destination countries, which may impact the international tourism flows. We use composite index based on Geert Hofstede’s cultural dimensions built by Kogut and Singh (1988) to represent cultural distance. The data for the power distance, uncertainty avoidance, individualism, and masculinity indexes were obtained from Hofstede’s homepage. The composite index (Kogut and Singh, 1988) is calculated as follows:
Institutional distance between origin and destination countries (
)
Institutional distance is another indicator to proxy psychological distance between origin and destination. We use the World Bank’s composite index of Worldwide Governance Indicators to represent institutional distance. Data for political stability and the absence of violence, control of corruption, government effectiveness, rule of law, regulatory quality, and voice and accountability are obtained from this index. The calculation method is the same as for cultural distance.
Dummy variables denoting neighbors (
) and visa exemption policy (
)
Dummy variables that denote speaking the same language, having or previously having a colonial relationship, being neighbors and sharing a common religion are often included in the gravity model (Eilat and Einav, 2004; Morley et al., 2014; Vietze, 2012). Based on China’s specific circumstances, we use only one such dummy variable, which denotes whether countries are neighbors with China. Dummy variable denotes the 72-h Transit Visa Exemption Program for foreigner tourist from 51 countries, which started in 2013 is included in this research. We obtained the detailed information about applicable countries for visa exemptions from the official website of the Ministry of Foreign Affairs of China.
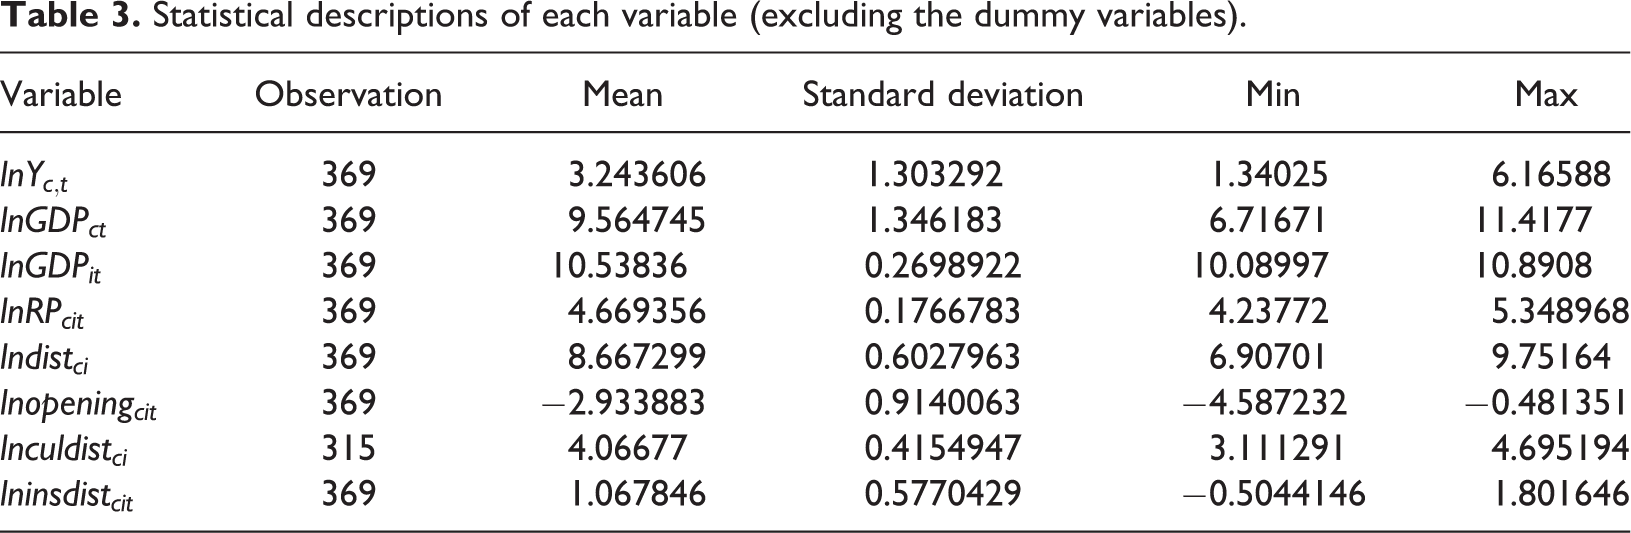
The definitions of variables are provided in Table 2. The dependent variable and the control variables, except for dummy variables, are in logarithmic form. The statistical description of each control variable is provided in Table 3.
Definition of study variables.
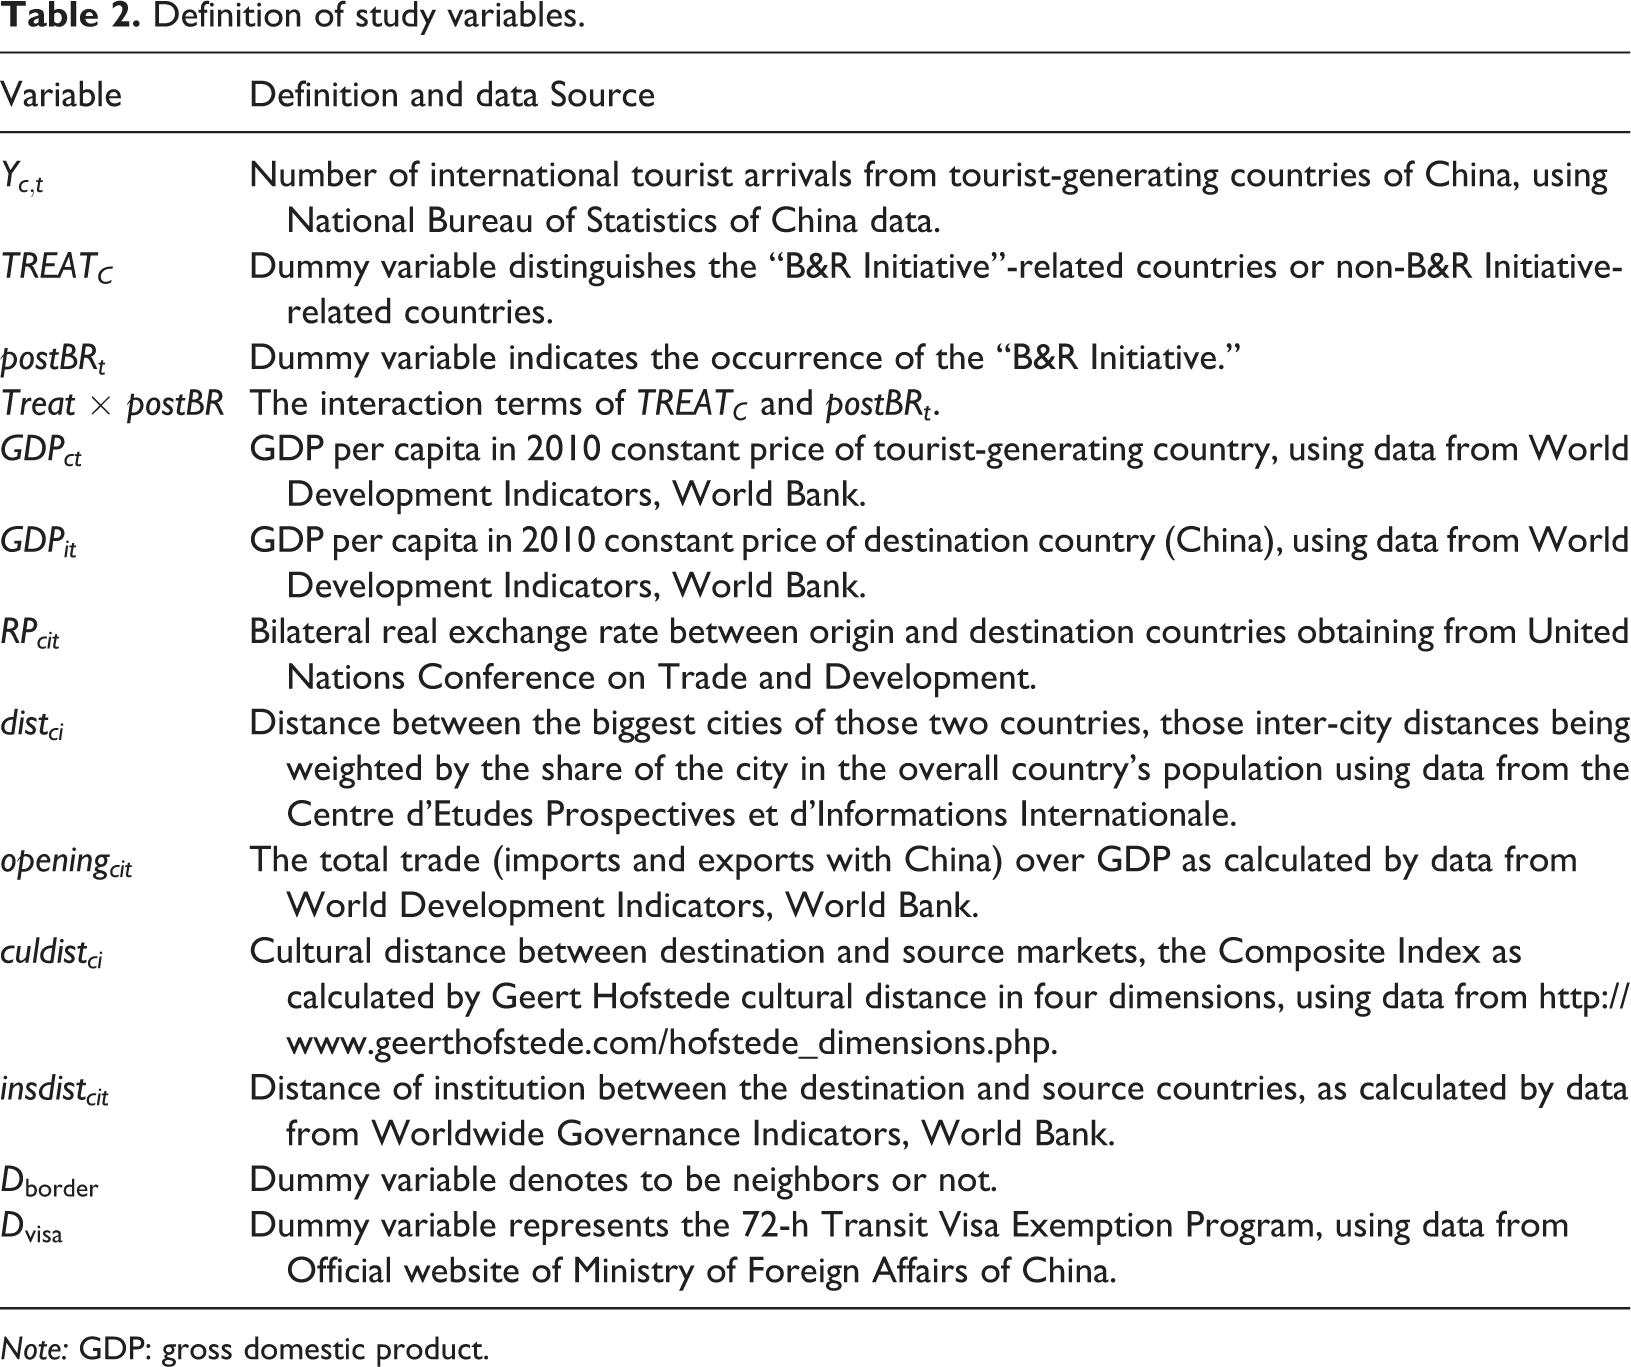
Note: GDP: gross domestic product.
Statistical descriptions of each variable (excluding the dummy variables).
Results
Comparing the pretreatment trends for the treated and untreated groups
This test shows no preexisting differences across the treated and untreated groups. We plot the natural logarithm of the total tourist arrivals for both groups in Figure 2. It is evident that the treated and untreated groups share a common trend prior to implementation of the B&R Initiative. The hypothesis of parallel trends is proven by the fact that there are no preexisting differences across the treated and untreated groups (see Figure 3).

The time trend of total tourist arrivals for the treated and untreated groups.
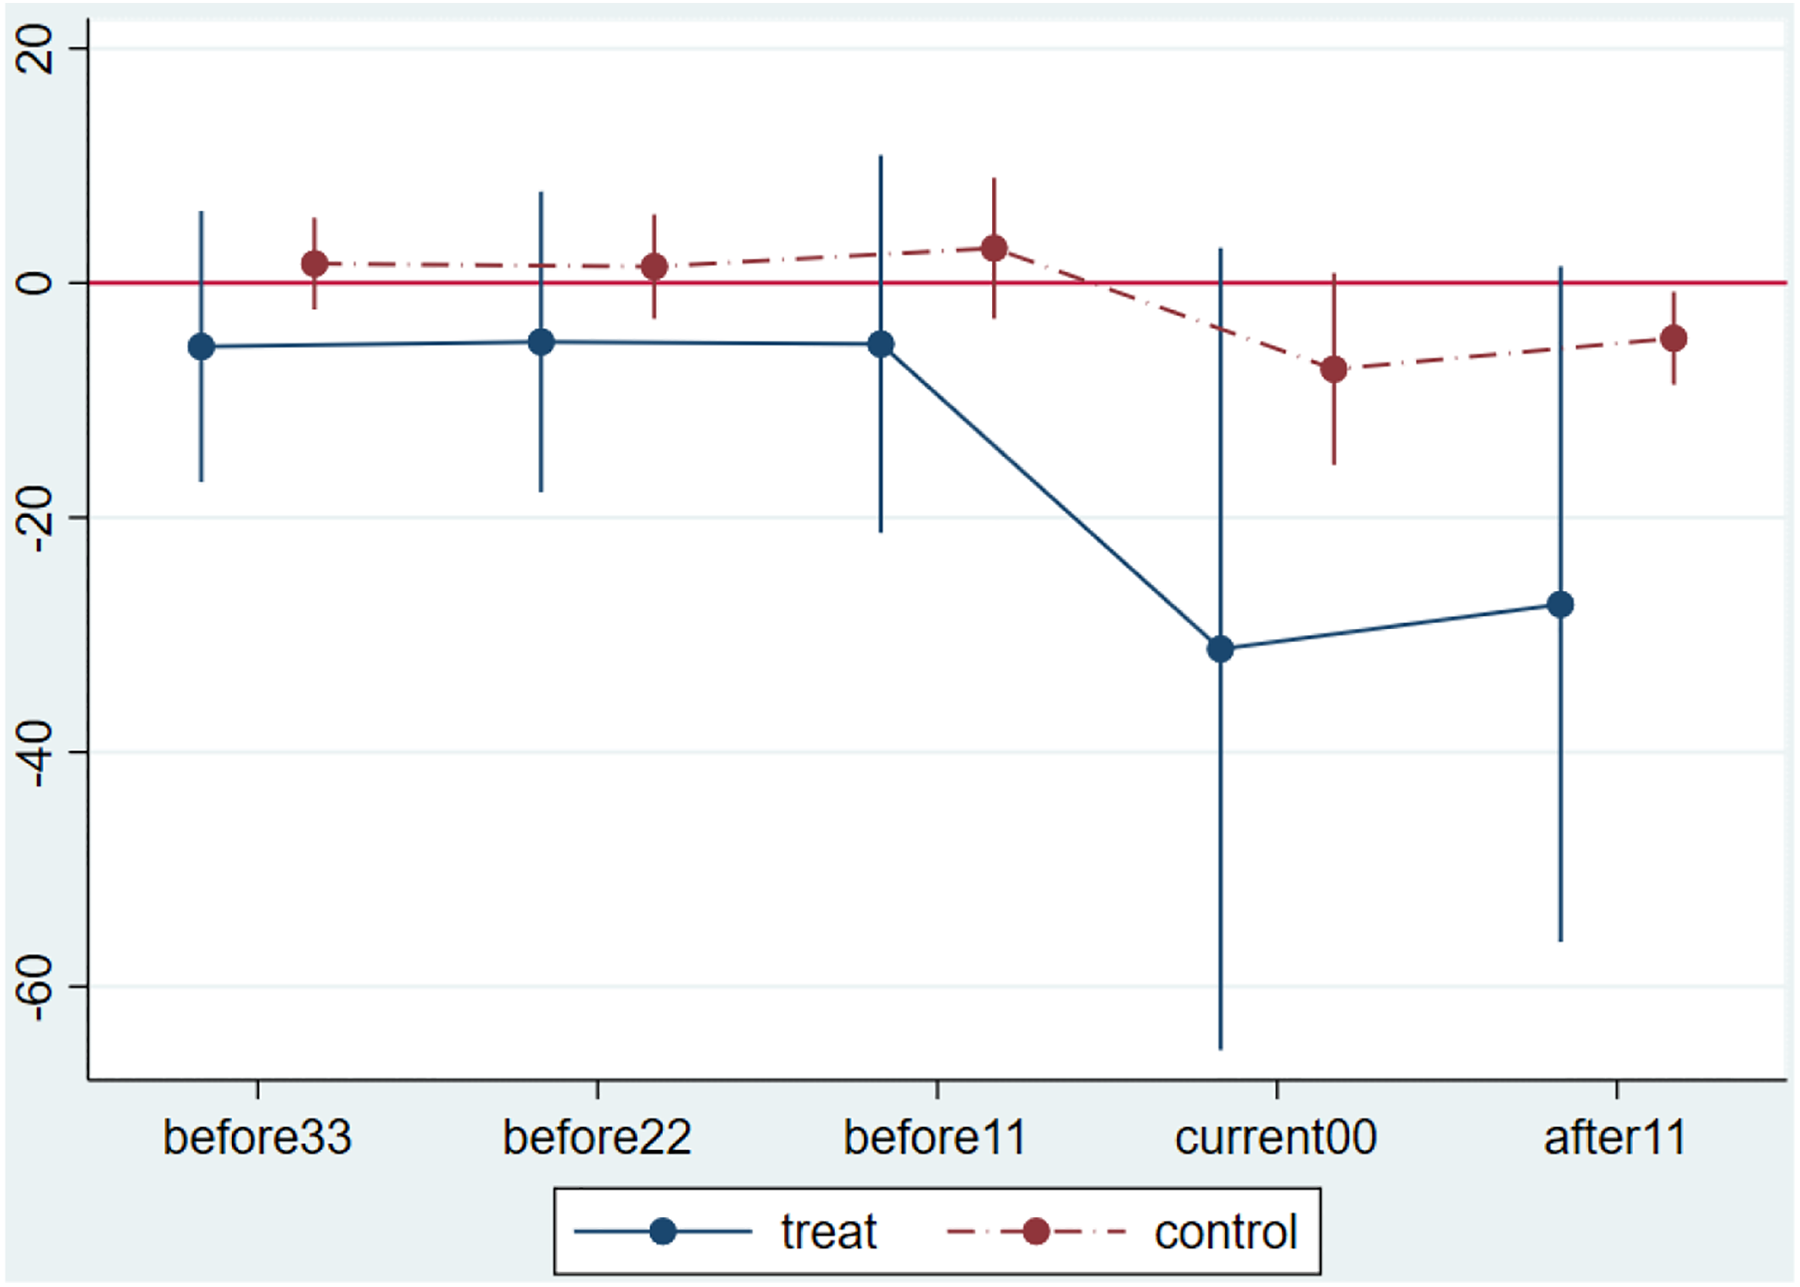
The results of the parallel trend hypothesis test.
General regression analysis
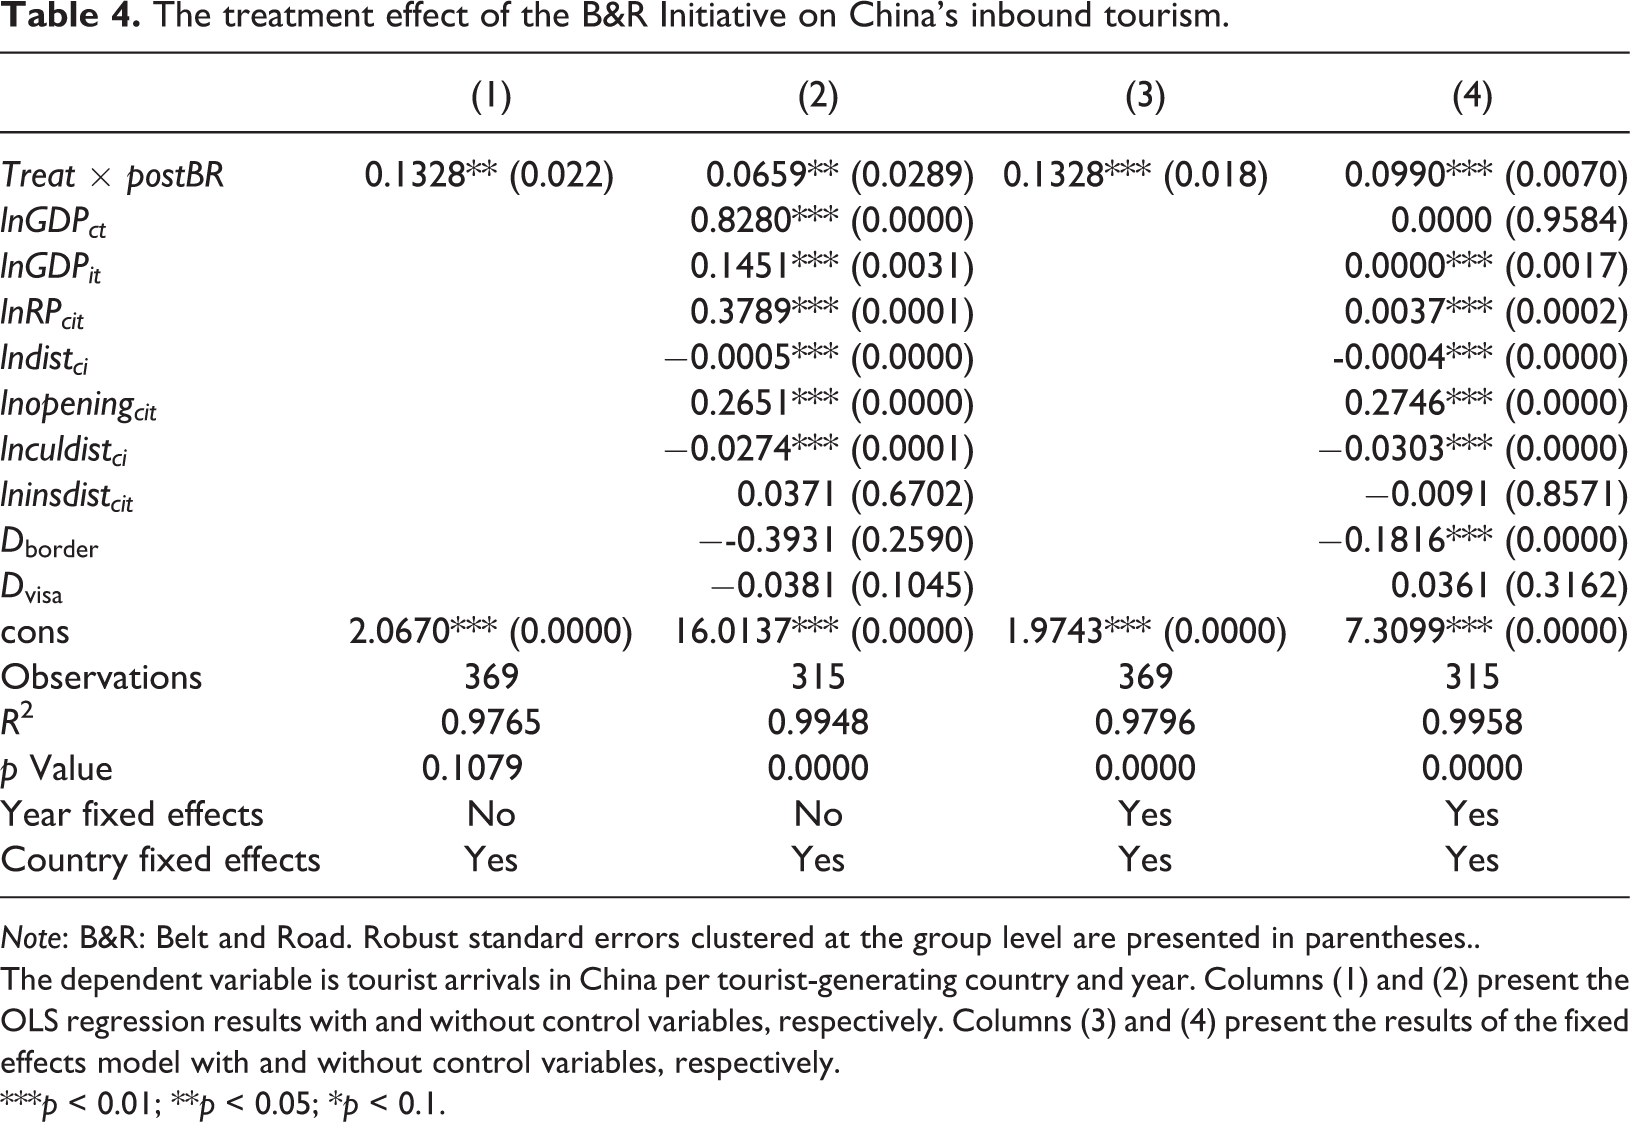
As reported in the regression results, the R 2 and p values indicate that the overall model is statistically significant, and the model setting and control variables selection are relatively reasonable. The result of the ordinary least squares (OLS) regressions (see Table 4) with and without control variables shows that the coefficients of the interaction terms of TREAT and postBR are significant and positive, which suggests that the B&R Initiative has a statistical correlation with the development of China’s inbound tourist market. The coefficient (0.1328, significant at the 5% level, without any controls) reveals that Chinese inbound tourist markets benefit from the B&R Initiative. Control variables have a measurable influence on treatment effects, and the coefficients remain significant and positive when considering the control variables. Building on the OLS regression, we use the fixed effects model to estimate the treatment effect of the B&R Initiative and find that the coefficients remain positive and highly significant.
The treatment effect of the B&R Initiative on China’s inbound tourism.
Note: B&R: Belt and Road. Robust standard errors clustered at the group level are presented in parentheses..
The dependent variable is tourist arrivals in China per tourist-generating country and year. Columns (1) and (2) present the OLS regression results with and without control variables, respectively. Columns (3) and (4) present the results of the fixed effects model with and without control variables, respectively.
***p < 0.01; **p < 0.05; *p < 0.1.
Heterogeneous effects
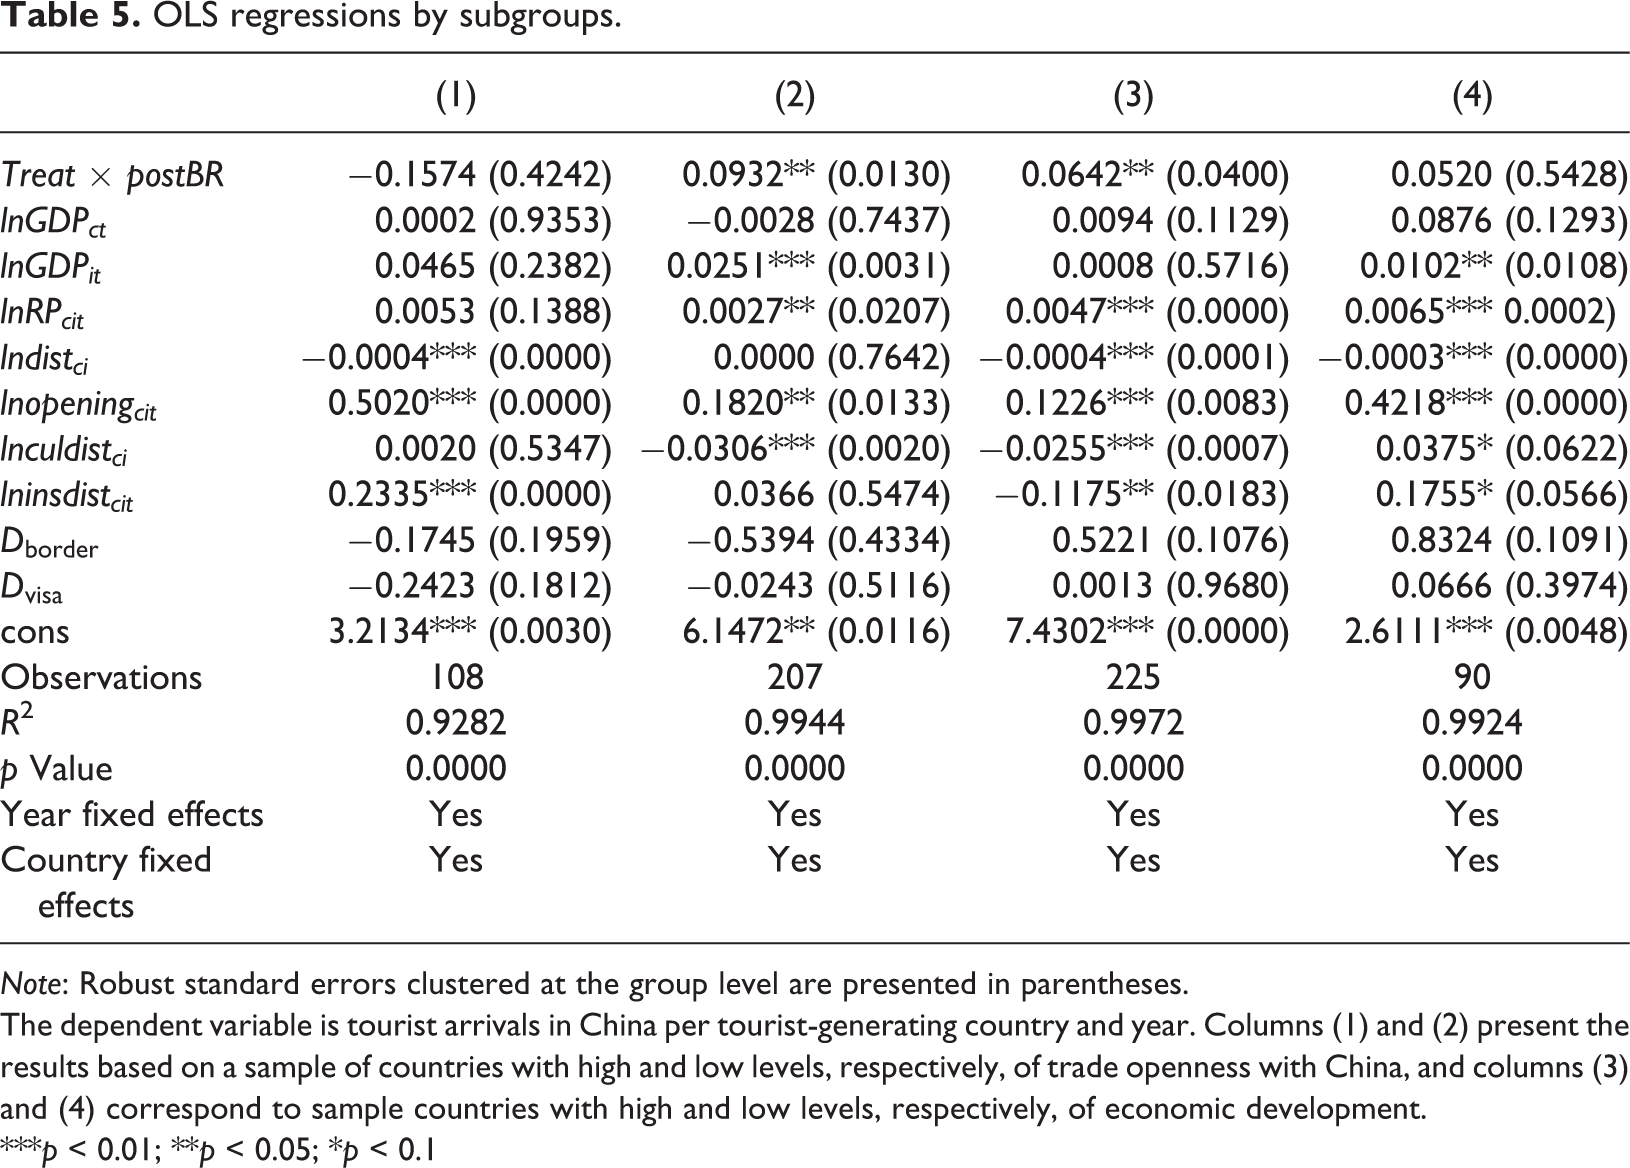
Although we have found that the B&R Initiative has a significantly positive effect on the inbound tourist markets along the B&R, it remains uncertain whether there is value in developing all of China’s inbound tourist markets along the B&R. Particularly in the early days immediately after the launch of the B&R Initiative, there was a negative response and opposition from a number of developed countries and regions. Therefore, the question arises as to whether there is heterogeneity inside the treated group. To clarify the characteristics of the origin countries sending tourists to China that are likely to be significantly and positively influenced by the B&R Initiative, we grouped countries according to their degree of trade openness with China and their economic development levels, respectively. This enables us to examine the heterogeneous effects and mechanism of the B&R Initiative on China’s inbound tourist market to determine which countries or regions are the key markets that China should focus on developing. The results of the treatment effects for the subgroups are shown in Table 5.
OLS regressions by subgroups.
Note: Robust standard errors clustered at the group level are presented in parentheses.
The dependent variable is tourist arrivals in China per tourist-generating country and year. Columns (1) and (2) present the results based on a sample of countries with high and low levels, respectively, of trade openness with China, and columns (3) and (4) correspond to sample countries with high and low levels, respectively, of economic development.
***p < 0.01; **p < 0.05; *p < 0.1
Tests for the treatment effects regarding heterogeneity substantiate that heterogeneous effects between subgroups do exist. The OLS regressions indicate that the effects of the B&R Initiative are not significant for those inbound tourist-generating countries that have a high level of trade openness with China. In contrast, the B&R Initiative does affect countries with a low level of trade openness, as indicated by a coefficient of 0.0932, which is significant at the 5% level when the control variables are included. For the tourist markets in low-level group, GDP per capita of destination countries, trade openness, and relative price have significantly positive effect on China’s inbound tourism, with elasticity coefficients of increases in inbound tourist trips of 0.0251, 0.1820, and 0.0027, respectively. In contrast, cultural distance has a significantly negative effect. This indicates that destination quality and relative price are attracting factors for tourist markets with a low level of openness with China and that the market size will increase with further opening up and reduction in cultural distance with China. For the group of countries with a high level of openness with China, the influence of trade openness on the outbound tourism market to China is significantly positive, indicating that the international tourism market to China for this group will continue to grow with the expansion of bilateral trade. For this group, geographic distance has a negative influence on the tourist market to China and institutional distance has a positive influence.
In terms of the results from grouping countries by economic development levels, there is obvious heterogeneity between the groups with high and low levels of economic development. The OLS results, when controlling for variables that may also affect the inbound tourist market, show that the effects of the B&R Initiative on the group with a high level of economic development are significantly positive at the 5% level, with a coefficient of 0.0642, whereas the result for the low-level group was not significant. For the group with high levels of economic development, the influences of relative price and trade openness on inbound tourism are highly significant and positive, whereas geographic, cultural, and institutional distance are significantly negative. In this case, the origin market in the group with high levels of economic development is sensitive to the relative prices between the origin and destination countries, and the trade openness stimulates international travel to China. In regard to the distance variables, the origin market size increases as the geographic, cultural, and institutional distances to China shorten. For the low-level economic development group, the development level and quality of the destination, relative prices, trade openness, and the institutional and cultural distance have significantly positive effects on international travel to China, whereas geographic distance plays a negative role.
The results of the two grouping tests may reveal that the policy effect of the B&R Initiative for the whole sample statistically originates from the groups with a high level of economic development or a low level of trade openness with China. We examine the reasons why the OLS results are not significant for the inbound tourist markets generated from the groups of countries that are less developed and have a high level of trade openness with China. First, the majority of countries along the B&R are developing countries, and they cannot sustain a large-scale outbound tourism market at their present economic development levels. Second, for the main trading partners of China (the high-level trade openness group), bilateral economic cooperation and trade as well as tourist exchanges have already been large and extensive, which needs to make more efforts to achieve persist rise. However, for those countries of low-level trade openness with China, it would be easier to increase in trade and tourist exchanges in general. Third, the “B&R Initiative” is a national strategy-based policy, the favorable and detailed policy sustaining which needs time to formulate, implement, and deepen. Thus, owing to this time lag, the effects of the B&R Initiative that are not yet evident in some economies still need more time to completely appear.
Annual treatment effects
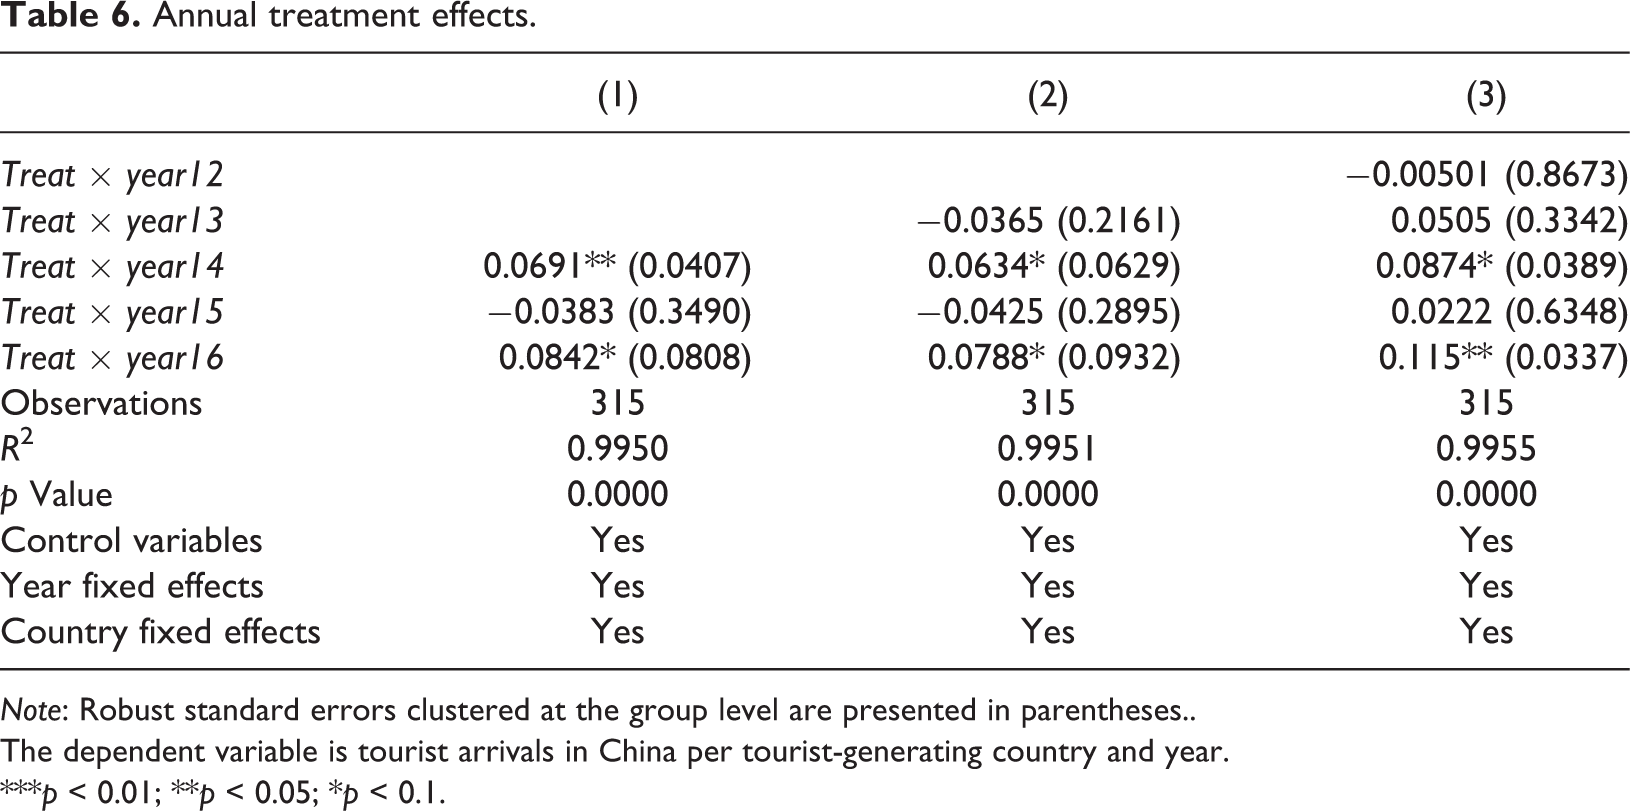
Columns (1)–(3) in Table 6 present the estimation of the annual treatment effects of the B&R Initiative. The OLS results reveal the dynamic effects of the B&R Initiative over year. As the table shows, the coefficients of treat × year14 and treat × year16 are significantly positive, and the annual treatment effect for 2016 is larger than that for 2014 when the B&R Initiative had only just launched. The results in columns (2) and (3) show that the coefficients of treat × year12 and treat × year13 are not significant, adding to the proof that there was no preexisting difference across treated and untreated groups before the B&R Initiative launched. However, neither of the coefficients for treat × year15 is significant.
Annual treatment effects.
Note: Robust standard errors clustered at the group level are presented in parentheses..
The dependent variable is tourist arrivals in China per tourist-generating country and year.
***p < 0.01; **p < 0.05; *p < 0.1.
In short, the annual treatment effects for three consecutive years are partly significantly positive, but the effects of the B&R Initiative were not stable in the first few years. This instability in estimated effects is likely to arise from the factors noted above, namely the time lag in development and implementation of the detailed policies and the initially negative attitude toward the B&R Initiative from part of the international community. Restrictions on the statistical data obtained may also contribute to the instability found for the annual treatment effects of the B&R Initiative.
Robustness checks
Although we have already examined the common trends prior to the implementation of the B&R Initiative, concern may remain regarding whether there are other incidences that might influence the common trends across the treated and untreated groups. Therefore, we conduct a placebo test to exclude this possibility. Additional robustness checks include regressions controlling for preexisting time trends and reducing the time frame covered by the research. All checks showed that the treatment effects between the treated and untreated groups resulting from the B&R Initiative are robust.
Placebo test
Columns (1)–(4) in Table 7 show the results of the placebo tests using data from 2008 to 2013, rather than from 2008 to 2016, and which treat 2009, 2010, 2011, and 2012, respectively, as the year when the B&R Initiative occurred. The coefficients of the interaction terms were not significant, and the trend changes after the occurrence of the B&R Initiative were actually caused by it.
Placebo treatments.

Note: Robust standard errors clustered at the group level are presented in parentheses.
The dependent variable is tourist arrivals in China per tourist-generating country and year. Columns (1)–(4) are placebo tests, using data from 2008 to 2013 (rather than to 2016), and treating 2009, 2010, 2011, and 2012 respectively, as the year in which the B&R Initiative occurred.
***p < 0.01; **p < 0.05; *p < 0.1.
Controlling for preexisting time trends
A potential problem with the DID method is that it may confound the dynamic effects of the policy with preexisting differences in time trends across treated and untreated groups (Moser and Voena, 2012). To address this problem, we follow the method of Moser and Voena (2012) to include a linear time trend for all treated group for the period prior to the B&R Initiative:

where
According to Moser and Voena (2012), there is an alternative test:

where t and t 2 denote linear and quadratic time trends.
The results in columns (1) and (2) in Table 8 show that the treatment effects remain significantly positive when controlling for preexisting time trends, which indicates that the results of this empirical study are robust.
OLS regressions controlling for preexisting time trends and shortening the research time frame.
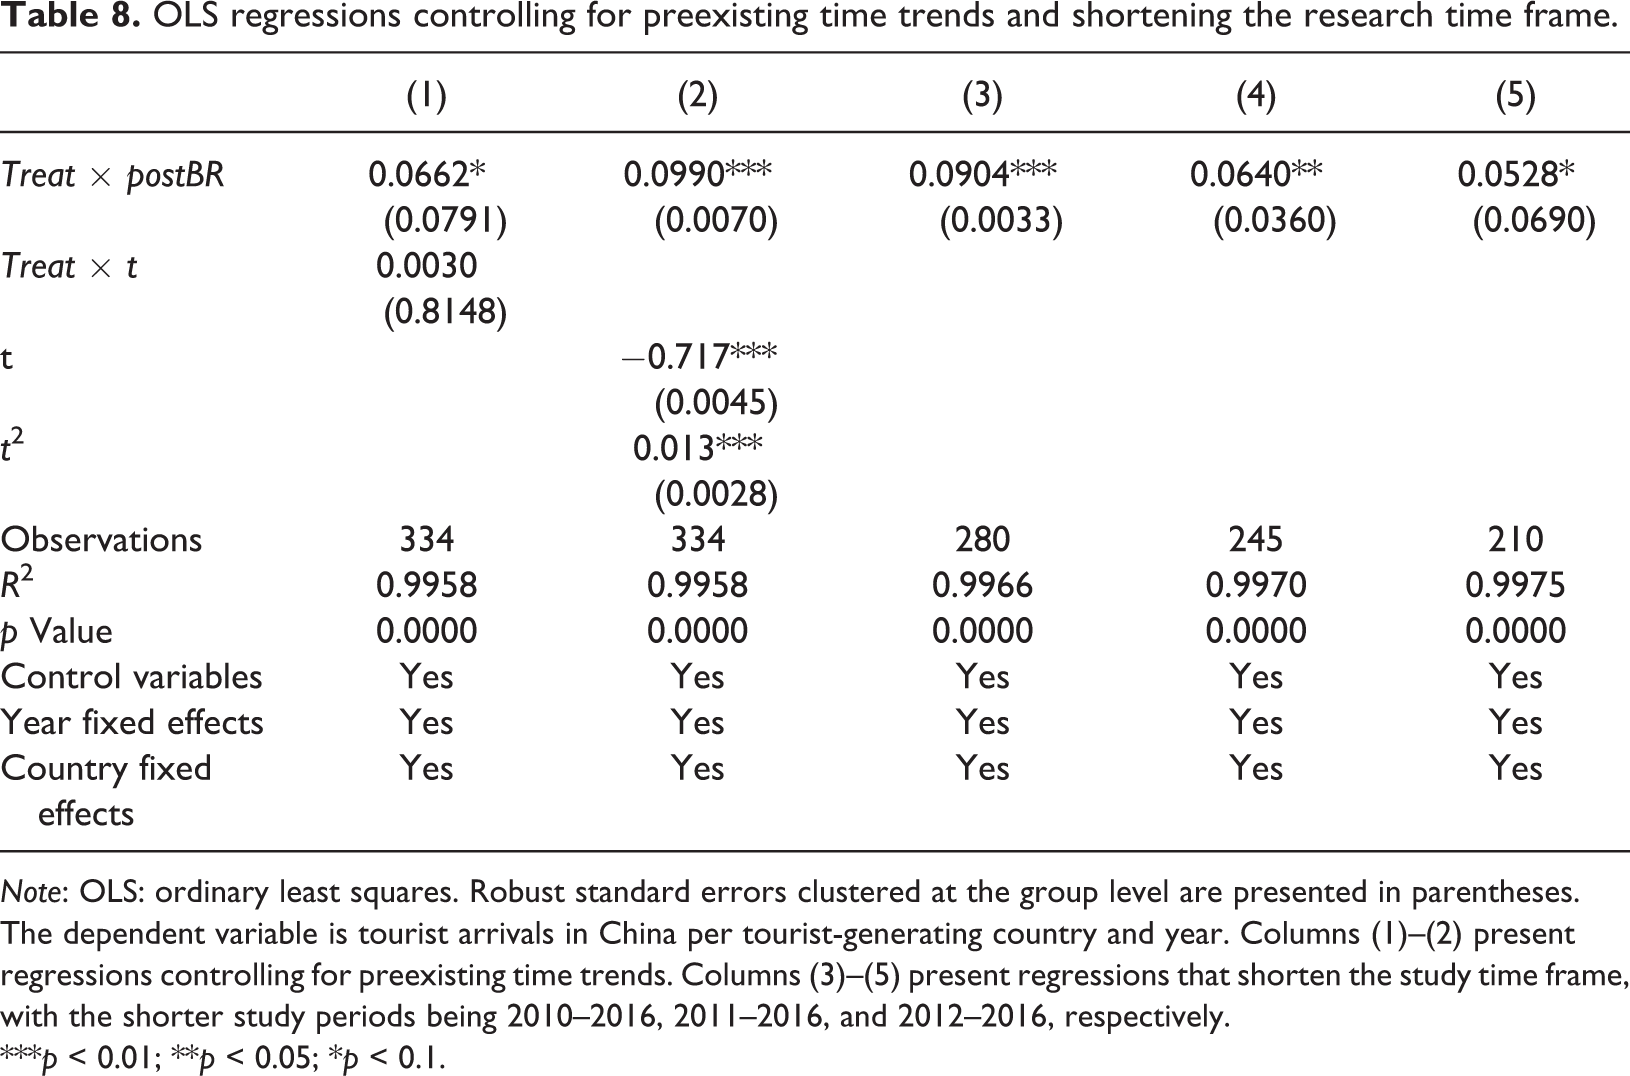
Note: OLS: ordinary least squares. Robust standard errors clustered at the group level are presented in parentheses.
The dependent variable is tourist arrivals in China per tourist-generating country and year. Columns (1)–(2) present regressions controlling for preexisting time trends. Columns (3)–(5) present regressions that shorten the study time frame, with the shorter study periods being 2010–2016, 2011–2016, and 2012–2016, respectively.
***p < 0.01; **p < 0.05; *p < 0.1.
Robustness check by shortening the time frame
Finally, we conduct a robustness check by shortening the time frame of the research. Again, the regressions indicate that the treatment effects of the B&R Initiative on the inbound tourist market of China remain significantly positive (see columns (3)–(5) in Table 8).
Discussion and conclusion
Literature on scientific evaluation of policy is relatively few (Criscuolo et al., 2012), and studies on evaluating the effect of the B&R Initiative are fewer in particular, despite the international attention it has drawn. The strongest distinction between the B&R Initiative and other policies examined in previous tourism studies is that the former is a comprehensive policy framework, whereas the latter tend to focus on a single policy, which may lead to differences in assessment techniques required and utilized. This article combines the gravity model of tourism with a DID method to determine whether the B&R Initiative encourages China’s inbound tourist demand. It represents a methodological advance in policy assessments within tourism research. The use of the gravity model to analyze international tourism from a consumer theory perspective has been justified by Morley et al. (2014), and it has been shown to be a valid tool to assess the effects of tourism policies by examining changes in any of the determinants in the function (Morley et al., 2014). The gravity model allows us to control for the possible factors influencing tourism demand as required to ensure an accurate estimation of policy effects. DID estimation is used for assessing public policy effectiveness worldwide (Blundell and Dias, 2002; Lechner, 2011), and this article uses the DID method to identify the treated effect on China’s inbound tourism induced by the B&R Initiative for the purpose of capturing the net effect across the treated and untreated groups.
In contrast to studies by Durbarry (2008), Martin and Witt (1987), Munoz (2007), Neumayer (2010), Qu et al. (1997) and Vietze (2012), our policy evaluation excludes effects caused by contemporaneous policies, using DID method. Although Durbarry (2008) also uses the gravity model to control for policy effects, he measures the indirect effect of tourism taxes on traveling market through their effect on prices, whereas we used the DID method to estimate the direct and net effect of the B&R Initiative. Another contribution of this article is to distinguish the annual treatment effects of the B&R Initiative from the general effects, whereas Durbarry (2008), Martin and Witt (1987), Munoz (2007), Neumayer (2010), Qu and Lam (1997) and Vietze (2012) identify only the general effect of policies. Although Tang and Feng (2018) examines the effects of the B&R Initiative on China’s inbound tourism, they do not run the annual treatment effect test. Compared with Tang and Feng (2018), we make progress in heterogeneous effect tests by grouping analyses according to level of trade openness with China and the origin country’s economic development level. Furthermore, this study eliminates the possible effect of contemporaneous visa policy changes on the inbound tourist market to ensure that the estimate of the effect of the B&R Initiative is accurate. The general result and those for the subgroup regressions show that visa policy is not significant.
Based on the bilateral tourism research by Prideaux (2005), our theoretical contribution is to examine the influence of the B&R Initiative on inbound tourism using an origin–destination framework, treating the set of all origin–destination flows as a system. Unlike Eugenio-Martin et al. (2008), Khadaroo and Seetanah (2008), and Eilat and Einav (2004), the theoretical framework of this study pays more attention to the systematic interaction of origin–destination factors using the augmented gravity model, including the economic, geographic, and psychological distance variables in the model, as well as the origin and destination specific variables, respectively.
The data on inbound tourist markets of China per generating country from 2008 to 2016 indicate that the B&R Initiative has direct significantly positive effects on China’s international tourist-generating markets generally. The annual treatment effects are not stable due to the nonsignificant effect in 2015. Empirical studies using grouping tests show that the B&R Initiative does have heterogeneous effects. Various robustness checks conducted testify that the results are significant and robust, including a placebo test for false policy occurrence years and regressions controlling for preexisting time trends and a reduced study time frame.
In addition, we examine the heterogeneous effects and mechanism of the B&R Initiative on the inbound tourist market by grouping countries according to their trade openness with China and economic development level. The results indicate that the treatment effects are significant for the groups with a low level of trade openness to China and a high level of economic development. The grouping results enrich the knowledge on the effects of the B&R Initiative. The B&R Initiative did not boost the China’s tourist-generating markets that were trading with China on a large scale or which already more open to China. It might explain the reason why the major foreign market of China inbound tourism approached saturation and the increase of the market was slowing down, especially given the context of the world economic downturn. While the emerging economies are developing rapidly, the potential to traveling abroad might be stimulated by contacts made with China through the B&R Initiative. This finding may provide substantial guidance for strategy development in regard to China’s inbound tourism marketing.
The policy implications are clear and of great significance. China’s inbound tourism market reached a phase of slow or negative growth after the 2008 global financial crisis. The alarming signals of geopolitical risk and trade protectionism may also present a challenge to the continued growth of China’s tourism market. The findings in this study indicate that if China wishes to develop an overseas tourism marketing strategy to entice visitors from among its major tourist-generating countries, those countries with relatively low levels of trade openness with China and with high economic development levels should be the selected targets. These countries include Indonesia, Iran, Israel, Kazakhstan, Malaysia, Pakistan, Poland, Russia, Singapore, Turkey, Ukraine, and Uzbekistan. If China focuses on these promising sources of tourism, it may be able to revive its inbound tourism market growth.
Due to the spillover effect caused by the B&R Initiative for countries and areas that do not belong to the Belt and Road, we will aim to exclude it from the treatment effects in future research. For this, regression discontinuity design should be considered.
Footnotes
Acknowledgements
The authors thank the editors and two anonymous referees for numerous useful comments and suggestions.
Declaration of conflicting interests
The author(s) declared no potential conflicts of interest with respect to the research, authorship, and/or publication of this article.
Funding
The author(s) disclosed receipt of the following financial support for the research, authorship, and/or publication of this article: The authors received financial support for the research and publication of this article by National Social Science Fund Project (no. 14CGL022), Program for Innovative Team of Guangxi University of Finance and Economics, Research Initial Funding for PHD (BS201719) of Guangxi University of Finance and Economics, and Business Administration Discipline Development Project by Guangxi University of Finance and Economics (2018-GSXKB09).