



Abstract
The joints are crucial for influencing the overall mechanical performance of precast shear wall constructions under seismic actions. The existing joint connections are complex and not efficient enough. To maximize the potential of prefabricated structures, this study proposed innovative prefabricated shear walls with steel double tube connections. Two pseudo-static tests were conducted to investigate the influence of axial compression ratio on the seismic behavior of the innovative shear walls. The failure modes were all bending failures, and it had been discovered that increasing the axial compression ratio can improve the carrying capacity and energy dissipation capacity. Seven models with different axial pressure ratios were established to conduct nonlinear finite element analysis. The result showed that as the axial compression ratios raised, the carrying capacity and stiffness of the models increased, but the decreasing trend of force–displacement curves were also more distinct. Therefore the recommended axial pressure ratio of the models did not exceed 0.4. Finally, the calculation method of the loading capacity of novel shear walls was proposed, which provided the basis for the design of innovative shear walls.
Keywords
Introduction
With its high degree of mechanisation, fast construction, and reliable quality, assembled concrete shear walls have been extensively researched in recent years, especially in the form of connections for prefabricated elements (Guo et al., 2019; Li et al., 2020; Liu et al., 2017; PCI Industry Handbook Committee, 2017). Through testing and numerical analysis of precast reinforced concrete shear walls (PSWs) with different connection methods, it is concluded that assembled shear wall structures have better seismic performance (Gu et al., 2022; Sun et al., 2016; Wu et al., 2020; Zhong et al., 2022). The ability of the prefabricated construction to meet the “equivalent cast-in-situ” requirements is largely dependent on the mechanical properties of the joint of PSWs, which is important for maintaining structural integrity and transmitting loads (Zhang and Li, 2021; Hemamalini et al., 2021). Currently, there are two types of connection joints for PSWs, wet and dry (Li et al., 2022). The seismic behavior of dry and wet connections in assembled shear walls has been the subject of extensive research. Wet connections can produce favorable mechanical behaviors and are easy to build (Sun et al., 2016; Lu et al., 2016). Many studies have been carried out on PSWs with wet connections (Xue et al., 2022; Jia et al., 2022; Xu et al., 2017). Qian et al. (2011) studied the seismic behavior of PSWs with vertical reinforcement connected by grouting sleeves, and the experimental result demonstrated that the grouting sleeve connections can efficiently transfer the stress of rebars. Alias et al. (2013) investigated the impact of parameters including anchorage distance and sleeve component dimensions on the strengths of the connection. The experimental findings demonstrated that when the anchorage distance increased, the stiffness of the joint increased, and the reasonable sleeve inner diameter can effectively constrain the grouting material. Wu et al. (2020) carried out low cycle loading of PSWs connected by grouting sleeves and monolithic shear walls. The experimental results show that the rebars connected by the grouting sleeve were safe before yielding, but the bonding strength of the grouting material and sleeve connecting reinforcement decreased after yielding. Jia et al. (2022) conducted experiments on joints of the frame-shear wall with grouting sleeves, and the experimental phenomena indicated that the seismic performance of joints connected by grouted sleeves was similar to that of monolithic joints. Nevertheless, the issue with construction tolerance was unavoidable, and the energy dissipation capacity was inadequate (Gu et al., 2019; Ameli and Pantelides, 2016). Wet connections (Lu et al., 2016; Sorensen et al., 2016) cannot achieve the full potential of PSWs, despite being simple to build and capable of displaying performance comparable to monolithic joints. Given this context, many academics have become interested in the dry connections at the construction site that do not involve any casting activities. Wang et al. (2018) proposed an innovative connection joint of PSWs, which used steel plates to connect the prefabricated members. Results illustrated that the seismic performance of the new connection joint was similar to the cast-in-situ joint. El et al. (2015, 2017) designed a novel joint with threaded anchor bolts and nuts. The final failure of the joints was due to the severe crushing of the concrete. Shaking table tests were carried out by Guo et al. (2019) on three-story PSWs with connection joints bolted by pre-buried steel plates welded to rebars. According to the experimental findings, the joints had high stiffness and high carrying capacity. Cheng et al. (2021) designed an innovative C-shaped steel plate to guard against cone breakout failure of the concrete, demonstrating that the new type of connection increased the ability to dissipate energy. Han et al. (2020) presented a new type of horizontal joint connection method using steel sections to connect PSWs. The new horizontal joint can effectively enhance the stiffness and carrying capacity of PSWs and keep the damage of connecting walls from appearing at the joints.
In comparison to other connection methods, prefabricated shear walls with bolted connections often have the benefits of high quality, quick construction, and lower labor costs (Psycharis et al., 2018). Therefore, this paper propsed a novel horizontal joint of PSWs with steel double tube connections (SDTCs). As shown in Figure 1, the innovative dry connection joint is composed of upper wall, lower wall, SDTCs, high-strength screw rod, construction hand hole, straight screw sleeve, and nut. The SDTC is welded by two steel pipes with a threaded inner wall and a smooth inner wall. The SDTCs are pre-buried in the upper wall and the threaded internal wall is anchored to the upper longitudinal bars. Pre-embedded straight-threaded sleeves in the lower wall are threaded to the lower longitudinal bars. First of all, the high-strength screw rod passes through the smooth wall of the SDTCs to connect to the straight screw sleeve and the construction hand hole provides the operating space. Then the nut is tightened with a spanner to the high-strength screw rod, and the upper longitudinal bar, SDTCs, and lower longitudinal bar are connected as a whole. Finally, the construction hand hole is plugged with high-strength mortar after the connection is completed. Horizontal cyclic tests were carried out on two novel PSWs with different axial compression ratios to examine the seismic performance of PSWs. The experimental results, including the failure modes, carrying capacity, stiffness degradation, energy dissipation capacity of the wall, and those in the connections are presented and discussed. Finally, the effect of various axial pressure ratios on the seismic behavior of the novel PSWs was investigated by numerical simulations. This new type of precast concrete shear wall connection method does not require extensive on-site wet work, and the manufacturing of SDTCs does not require special processes, making it cost-effective. Demonstration diagram of the novel PSWs with SDTCs.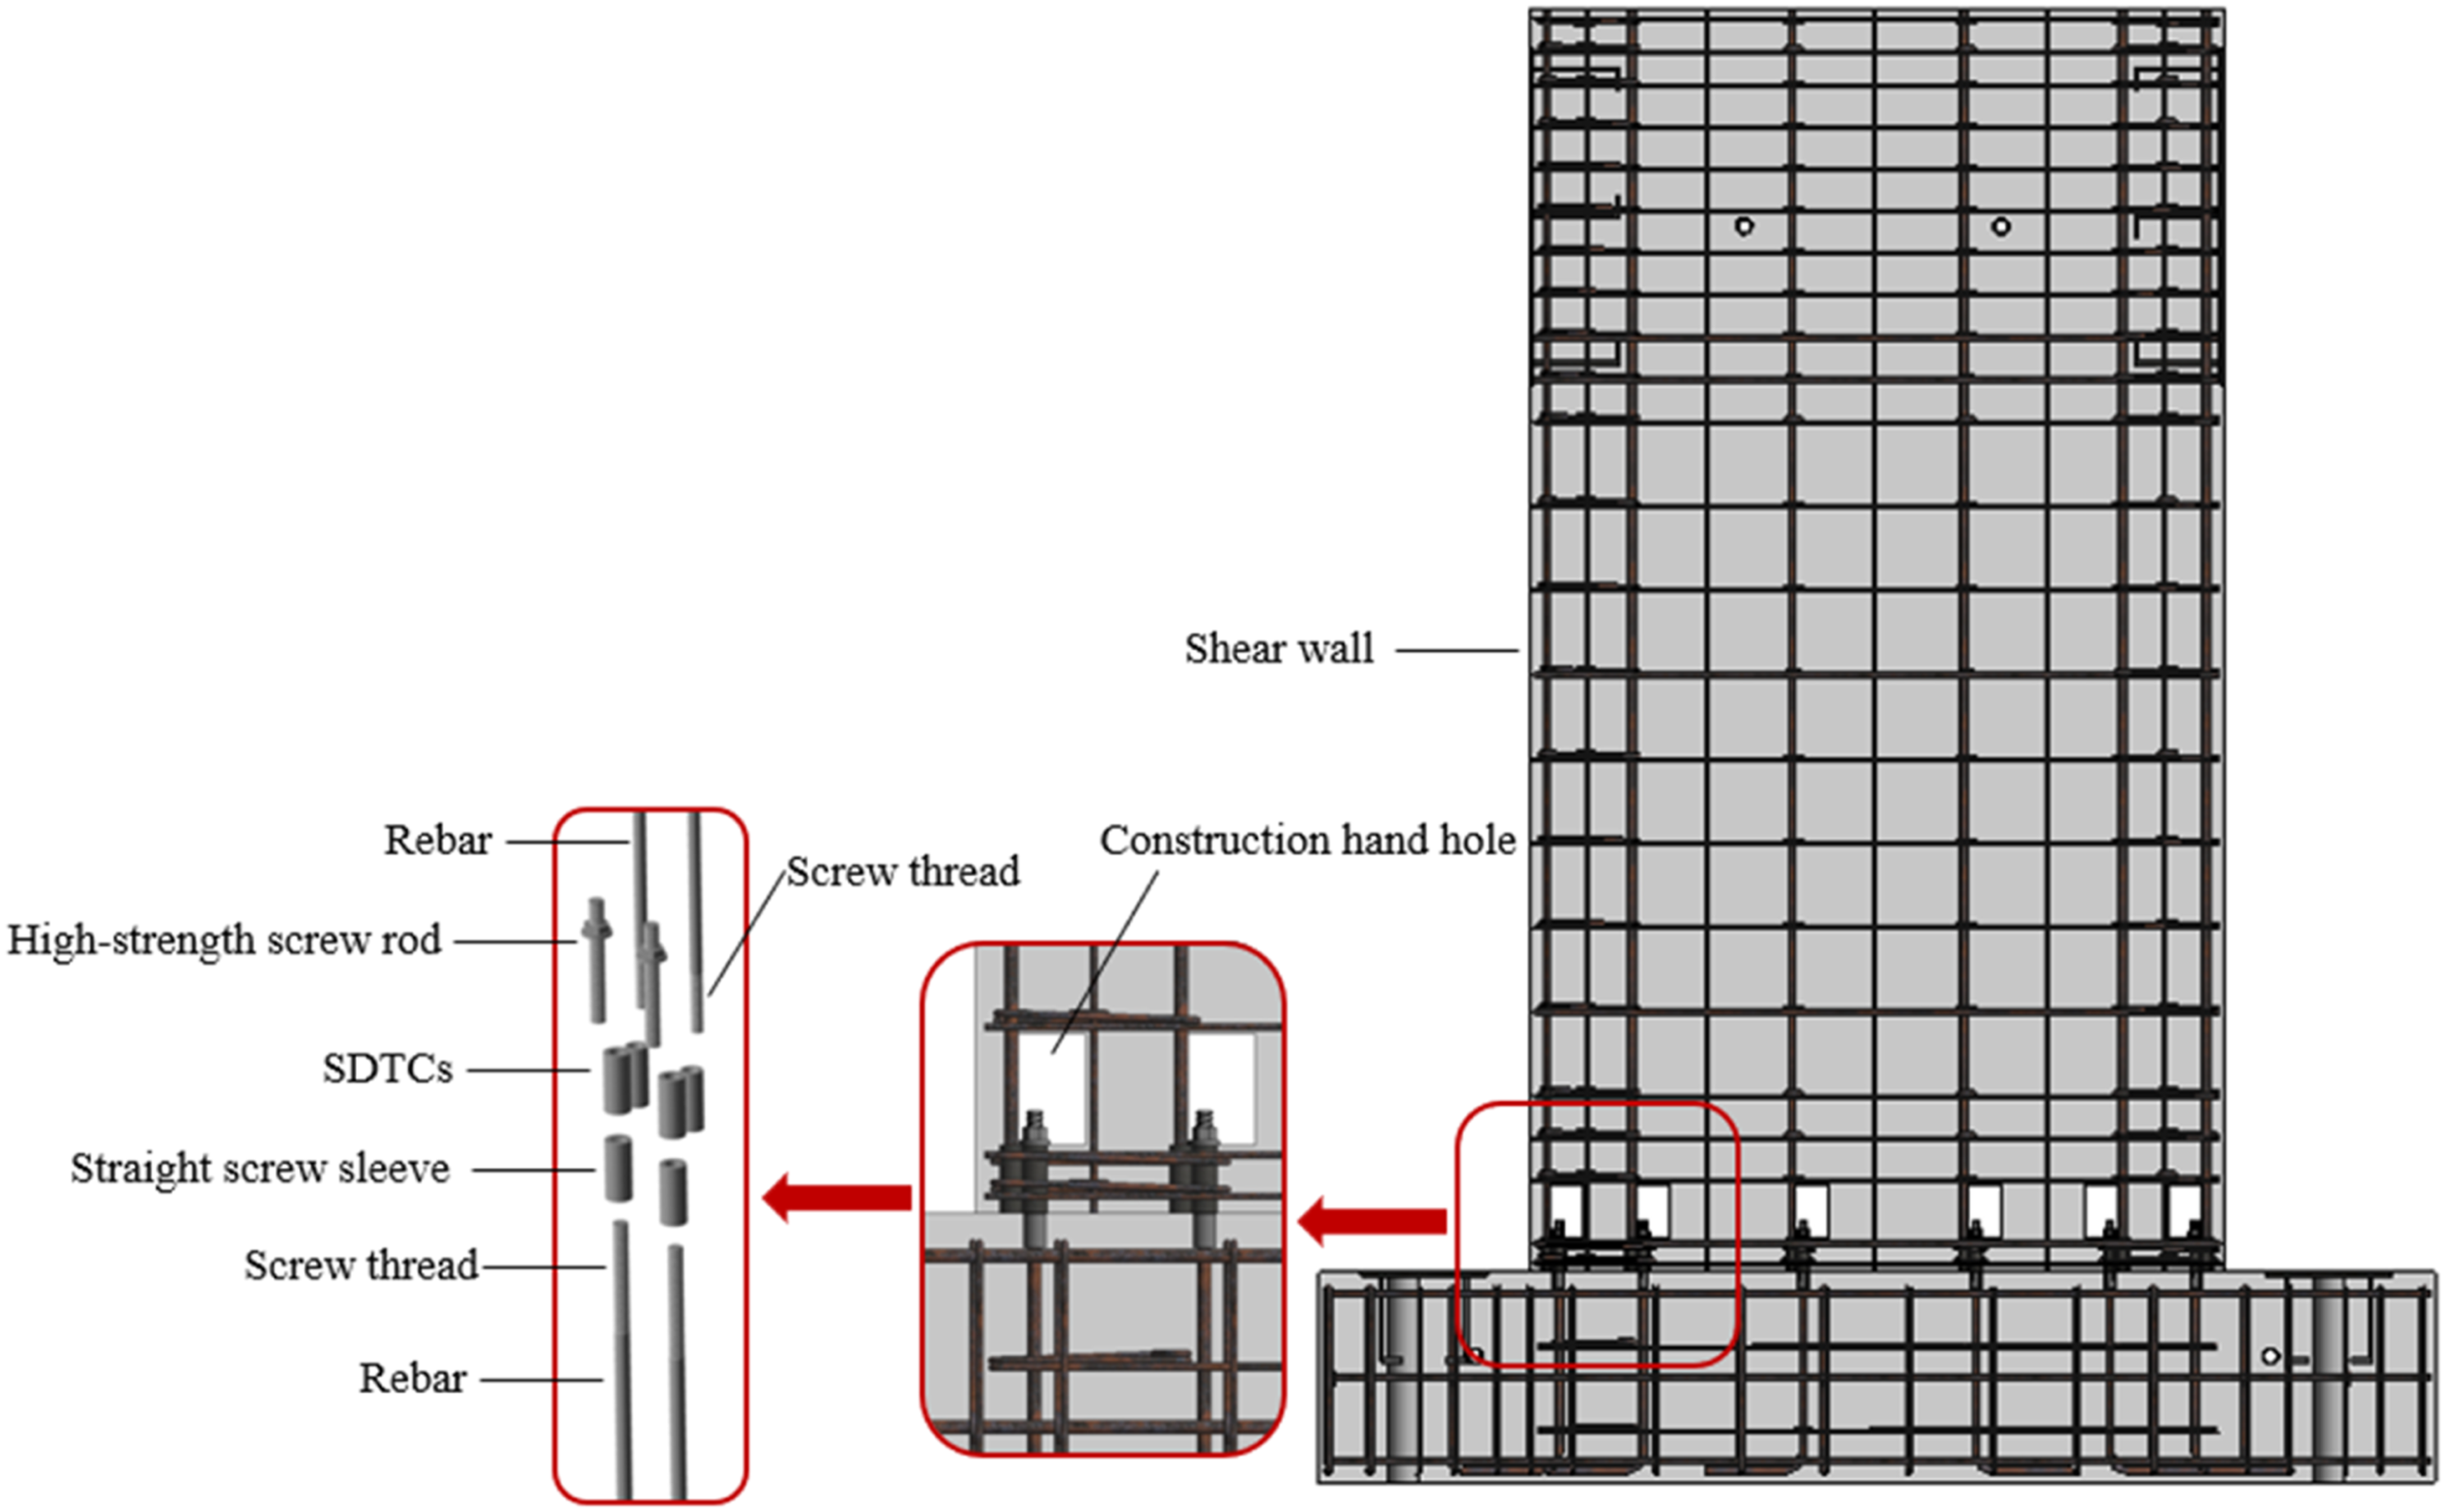
Test scheme
Details of shear wall specimens
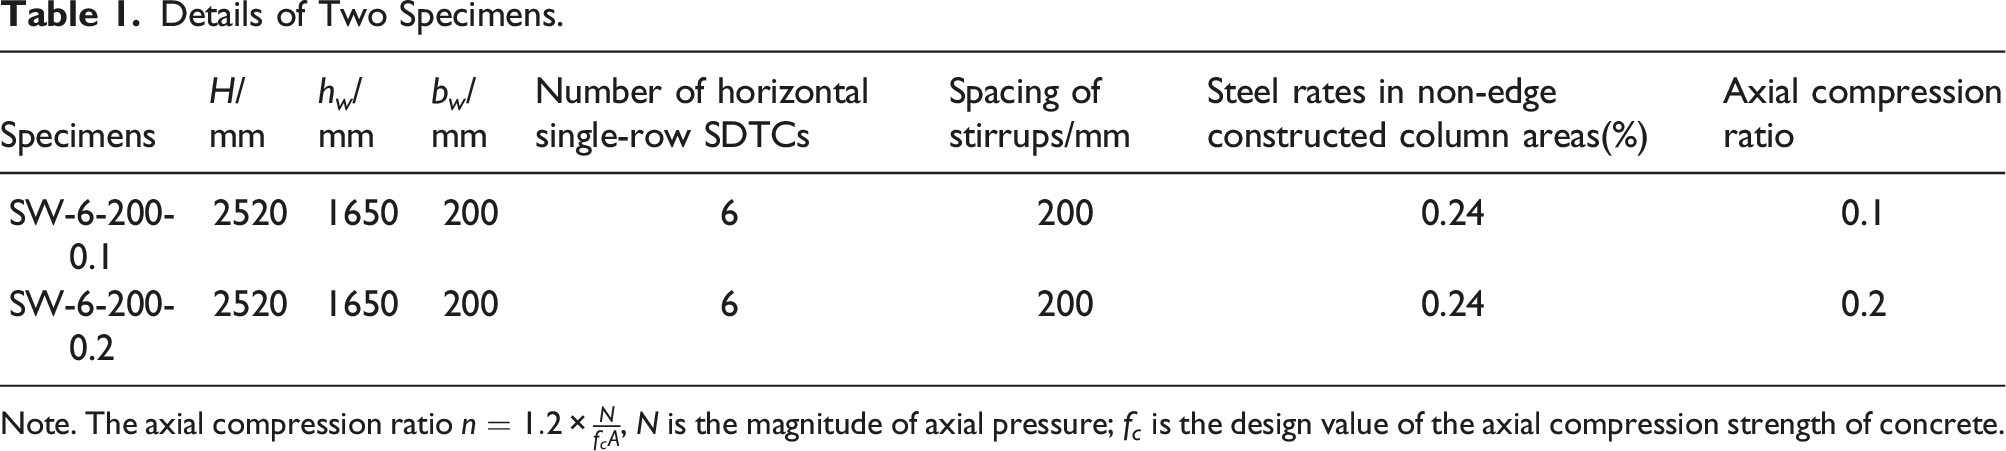
All of the specimen sizes were designed in full size to guarantee the reliability of the experimental findings. The size and rebar diagram of the specimens is shown in Figure 2, namely SW-6-200-0.1 and SW-6-200-0.2, by the specification JGJ 1-2014 (2014). The design of the two specimens referred to Wu (2023). Table 1 listed the specific details for the two specimens that were taken into consideration for this study. The rebar details, the arrangement of SDTCs, and the section size of the two specimens were identical besides the axial compression ratios. The concrete of two specimens adopted C30 grade, the steel reinforcements were HRB400 grade steel, and the steel grade of SDTCs was Q235. The mechanical properties of six standard test blocks (side length of 150 mm) were tested, and the results were listed in Table 2. Three replicate tensile tests were carried out on steel reinforcement and steel, and Table 3 showed the average values of the three tests. Details of SW-6-200-0.1/0.2 (Unit: mm). Details of Two Specimens. Note. The axial compression ratio Mechanical Properties of Concrete. Properties of Rebars and SDTCs.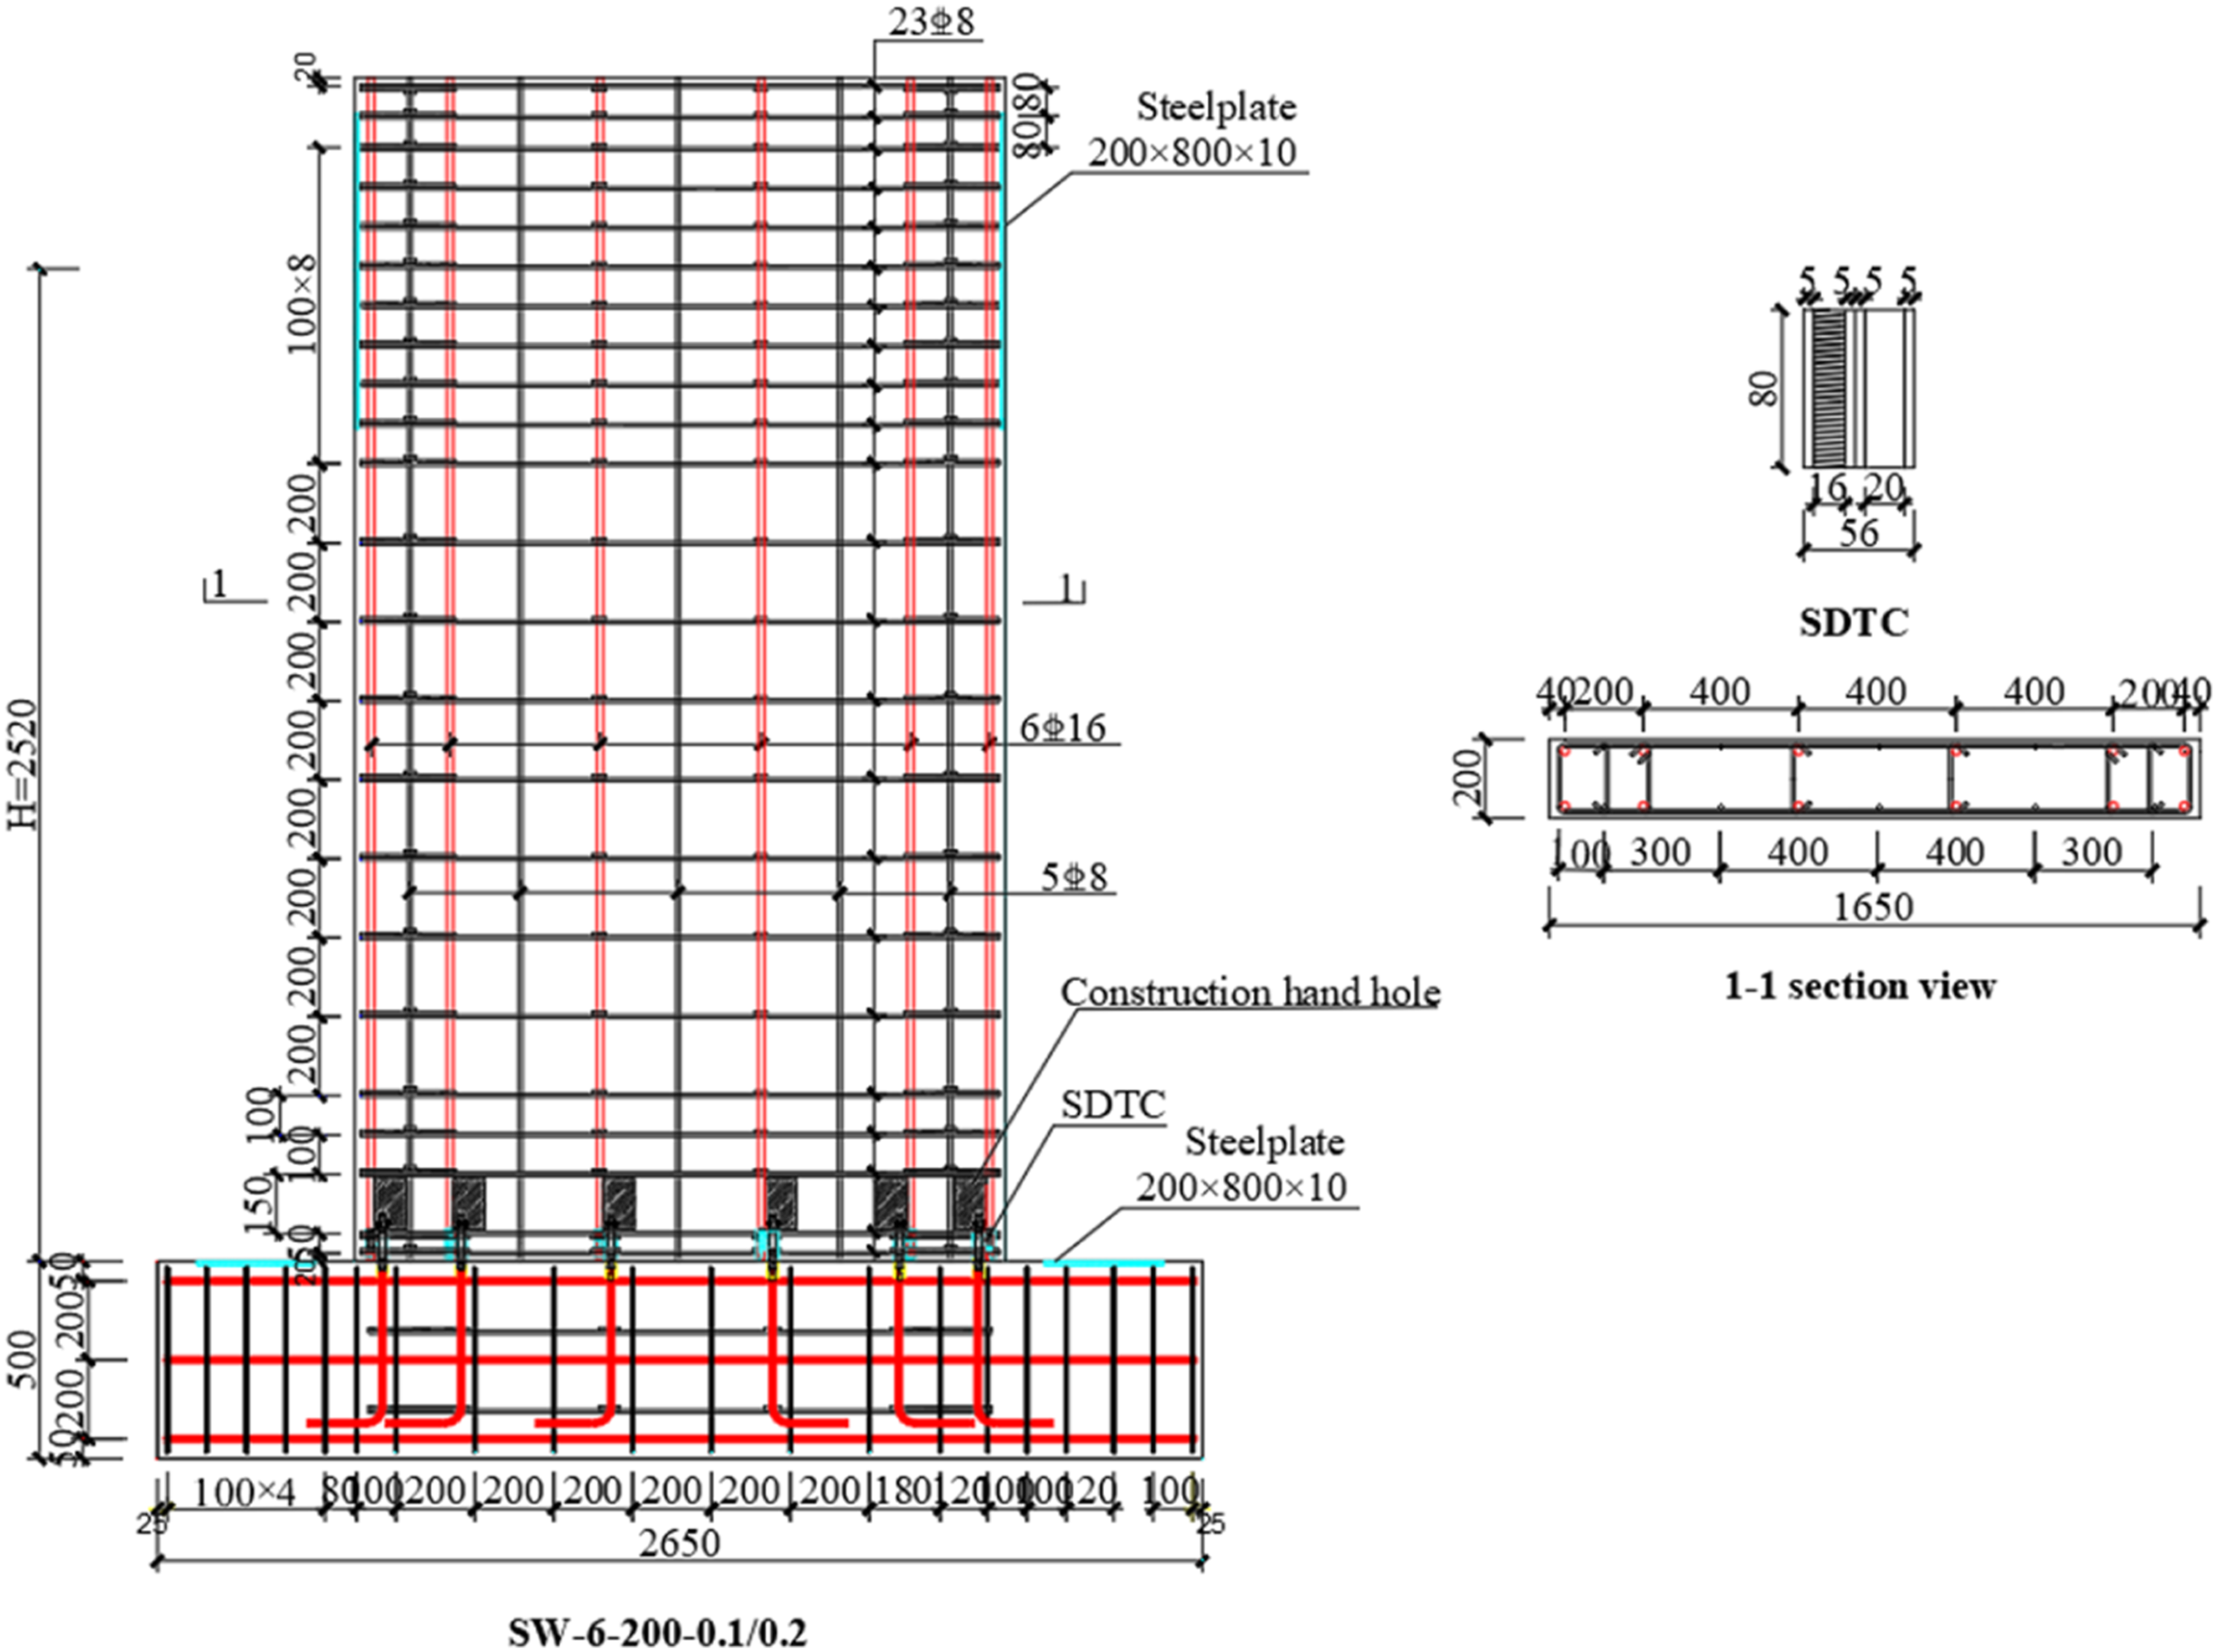


Construction process
The fabrication and installation process for specimens SW-6-200-0.1 and SW-6-200-0.2 are presented in Figure 3. The components of PSWs with SDTCs were made at the factory. The production process includes supporting formwork, binding rebar (Figure 3 (a), (b)). Thereafter, the cured components are assembled as illustrated in Figure 3 (c). The high-strength wire rod was screwed into the pre-buried straight-thread sleeve of the foundation beam, and the shear wall are lifted to the designated position by the truss car and fixed to the foundation beam with nuts. Ultimately, the construction handhole is blocked with high-strength mortar and the installation is completed, as presented in Figure 3 (d). Construction process. (a) Supporting formwork. (b) Binding rebar. (c) Assembling shear wall. (d) Plugging construction handholes.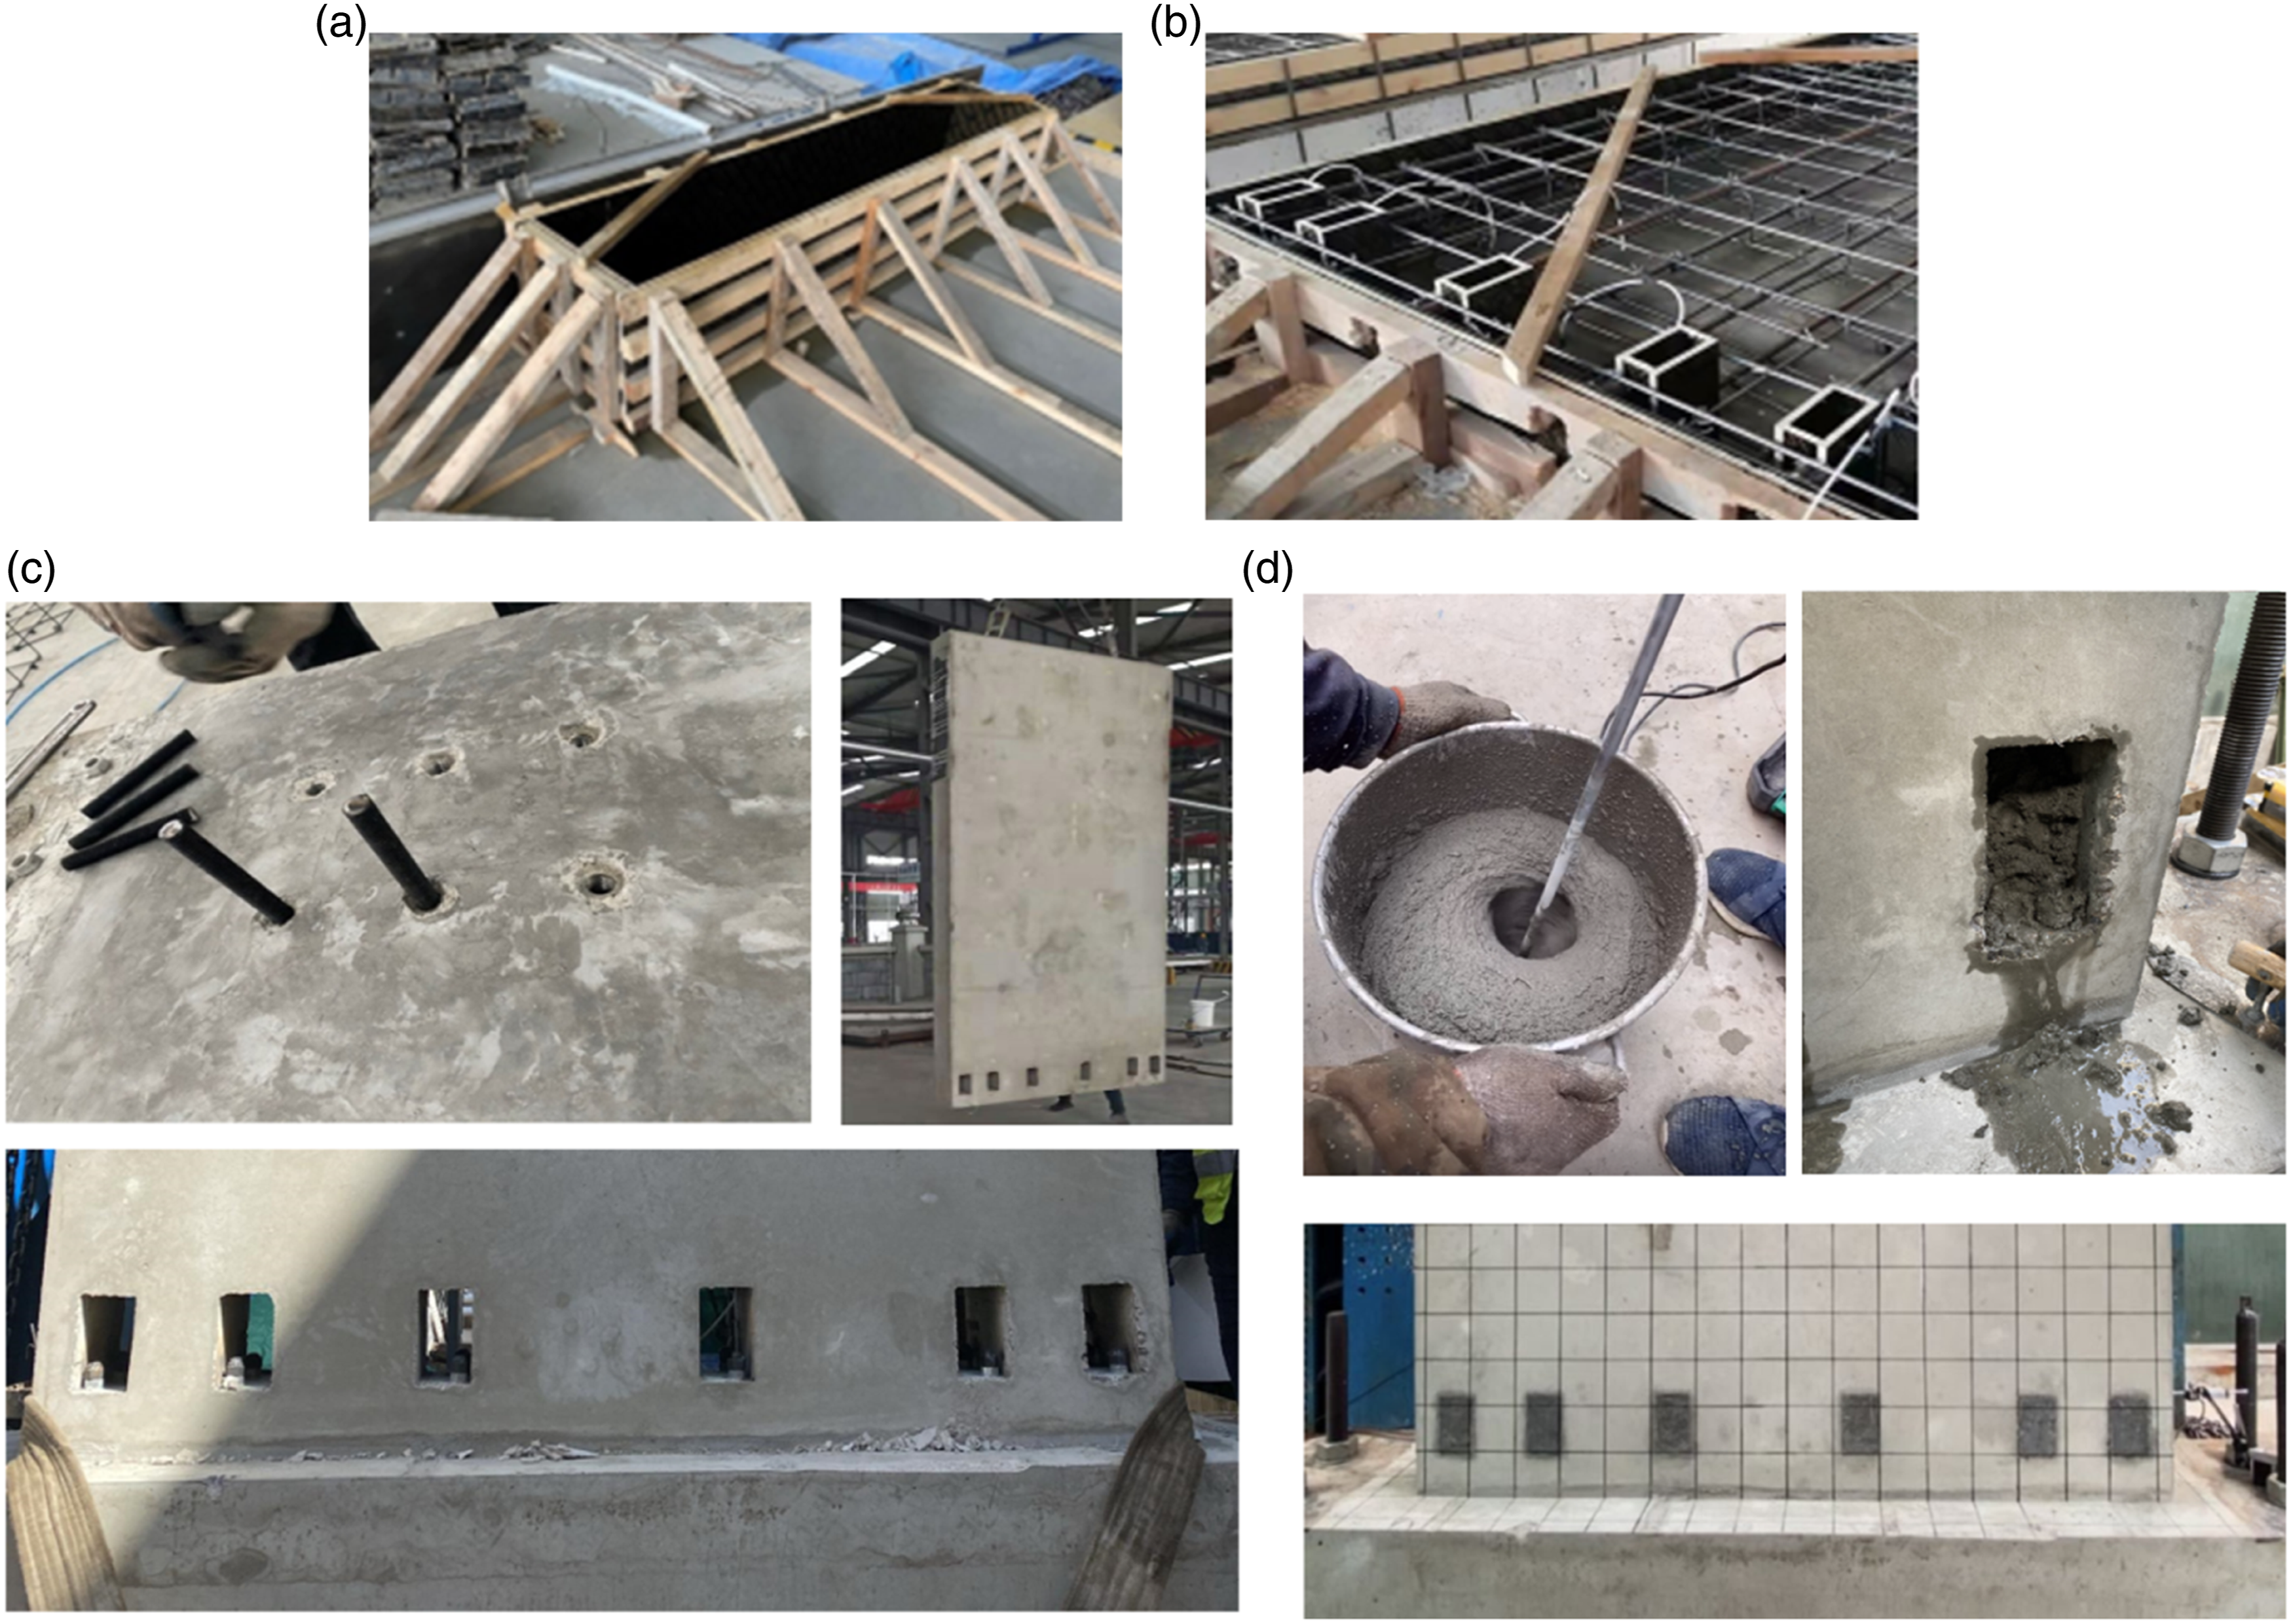
Test setup and loading method
Figure 4 shows the horizontal and vertical loading devices, the fixation of the specimens, and a photo of the test setup. The horizontal displacement was applied by the MTS servo actuator, and the vertical load was applied by the vertical jack, where a pulley was set at the connection between the jack and the reaction beam so that the vertical jack was always perpendicular to the specimen during the loading process. The bottom beam of the specimen was fixed on the ground beam by four anchor bolts. One side of the bottom beam was applied with constant force by a horizontal jack, and the other side was fixed by limit blocks. To prevent severe out-of-plane deformation, four lateral supports were set between the reaction frame and the specimens. Test setup. (a) Schematic diagram of test setup. (b) Photograph.
The vertical jack applied constant axial pressure to make the specimen reach the specified axial pressure ratio. The horizontal loading phase of the tests was divided into two stages of load and displacement control, and the loading scheme was presented in Figure 5. Force control was used before yielding, and force loading was carried out at 30 kN as one level. After the specimen yielded, it was switched to displacement loading, and the magnitude of the increase in loading displacement at each level was the value of the yield displacement of the specimens ( Loading scheme.
Test result and discussion
Failure of specimens
Figure 6 showed the crack development process of the two specimens. During the experiment, when the applied load reached 150 KN and 360 KN for SW-6-200-0.1 and SW-6-200-0.2 respectively, the first crack appeared at the construction handhole. When switching to displacement loading, the number and width of cracks on the surface of the shear walls gradually increased with the loading. For specimens SW-6-200-0.1, when the loading displacement was ±8 mm (displacement angle is 1/316), some minor horizontal cracks were discovered at the 50 mm height from the top of the foundation beam. Then in ±16 mm displacement (displacement angle is 1/158), the cracks at the construction hand holes were further developed, and the maximum width of the cracks reached 0.2 mm. When the loading displacement was ±24 mm, the cracks generated by positive and negative loading appeared cross phenomenon. New flexural cracks were produced at 1500 mm wall height, the length extended to the middle of the wall, and the concrete spalled in the construction hand hole area on both sides of the specimen. When lateral displacement was ±32 mm (displacement angle is 1/79), several major flexural cracks in the shear wall no longer developed, cracks were all concentrated near the construction handhole, and the concrete at the bottom of the specimen was crushed. Meanwhile, the specimen reached peak strength. Finally, the loading displacement of specimen reached the ±40 mm (displacement angle is 1/63), the number of cracks no longer increased, the concrete crushing at the bottom of the specimen became more serious, and the carrying capacity of the shear wall finally decreases to below 85% of the maximum strength. For specimen SW-6-200-0.2, when the applied displacement reached approximately 15 mm (displacement angle is 1/168), there were several small cracks near the construction handhole and two flexural cracks at 450 mm and 600 mm of shear wall height. As the displacement increased to 30 mm (displacement angle is 1/84), new cracks were discovered at 800 mm and 1050 mm wall height, and the crack length continued to develop and cross. The concrete was crushed and spalled near the construction han holes on the edge of the specimen, and the shear wall reached maximum strength. Eventually, stirrups and distributed reinforcement were exposed, and the compressive cracks of the upper wall were fully developed after the specimen underwent 45 mm displacement (displacement angle is 1/56). The carrying capacity of the shear wall degraded to below 85% of the maximum load, and the experiment was stopped. The failure mode of the two specimens was bending failure. Crack patterns of specimens. (a) SW-6-200-0.1. (b) SW-6-200-0.2.
Hysteresis loops and skeleton curves
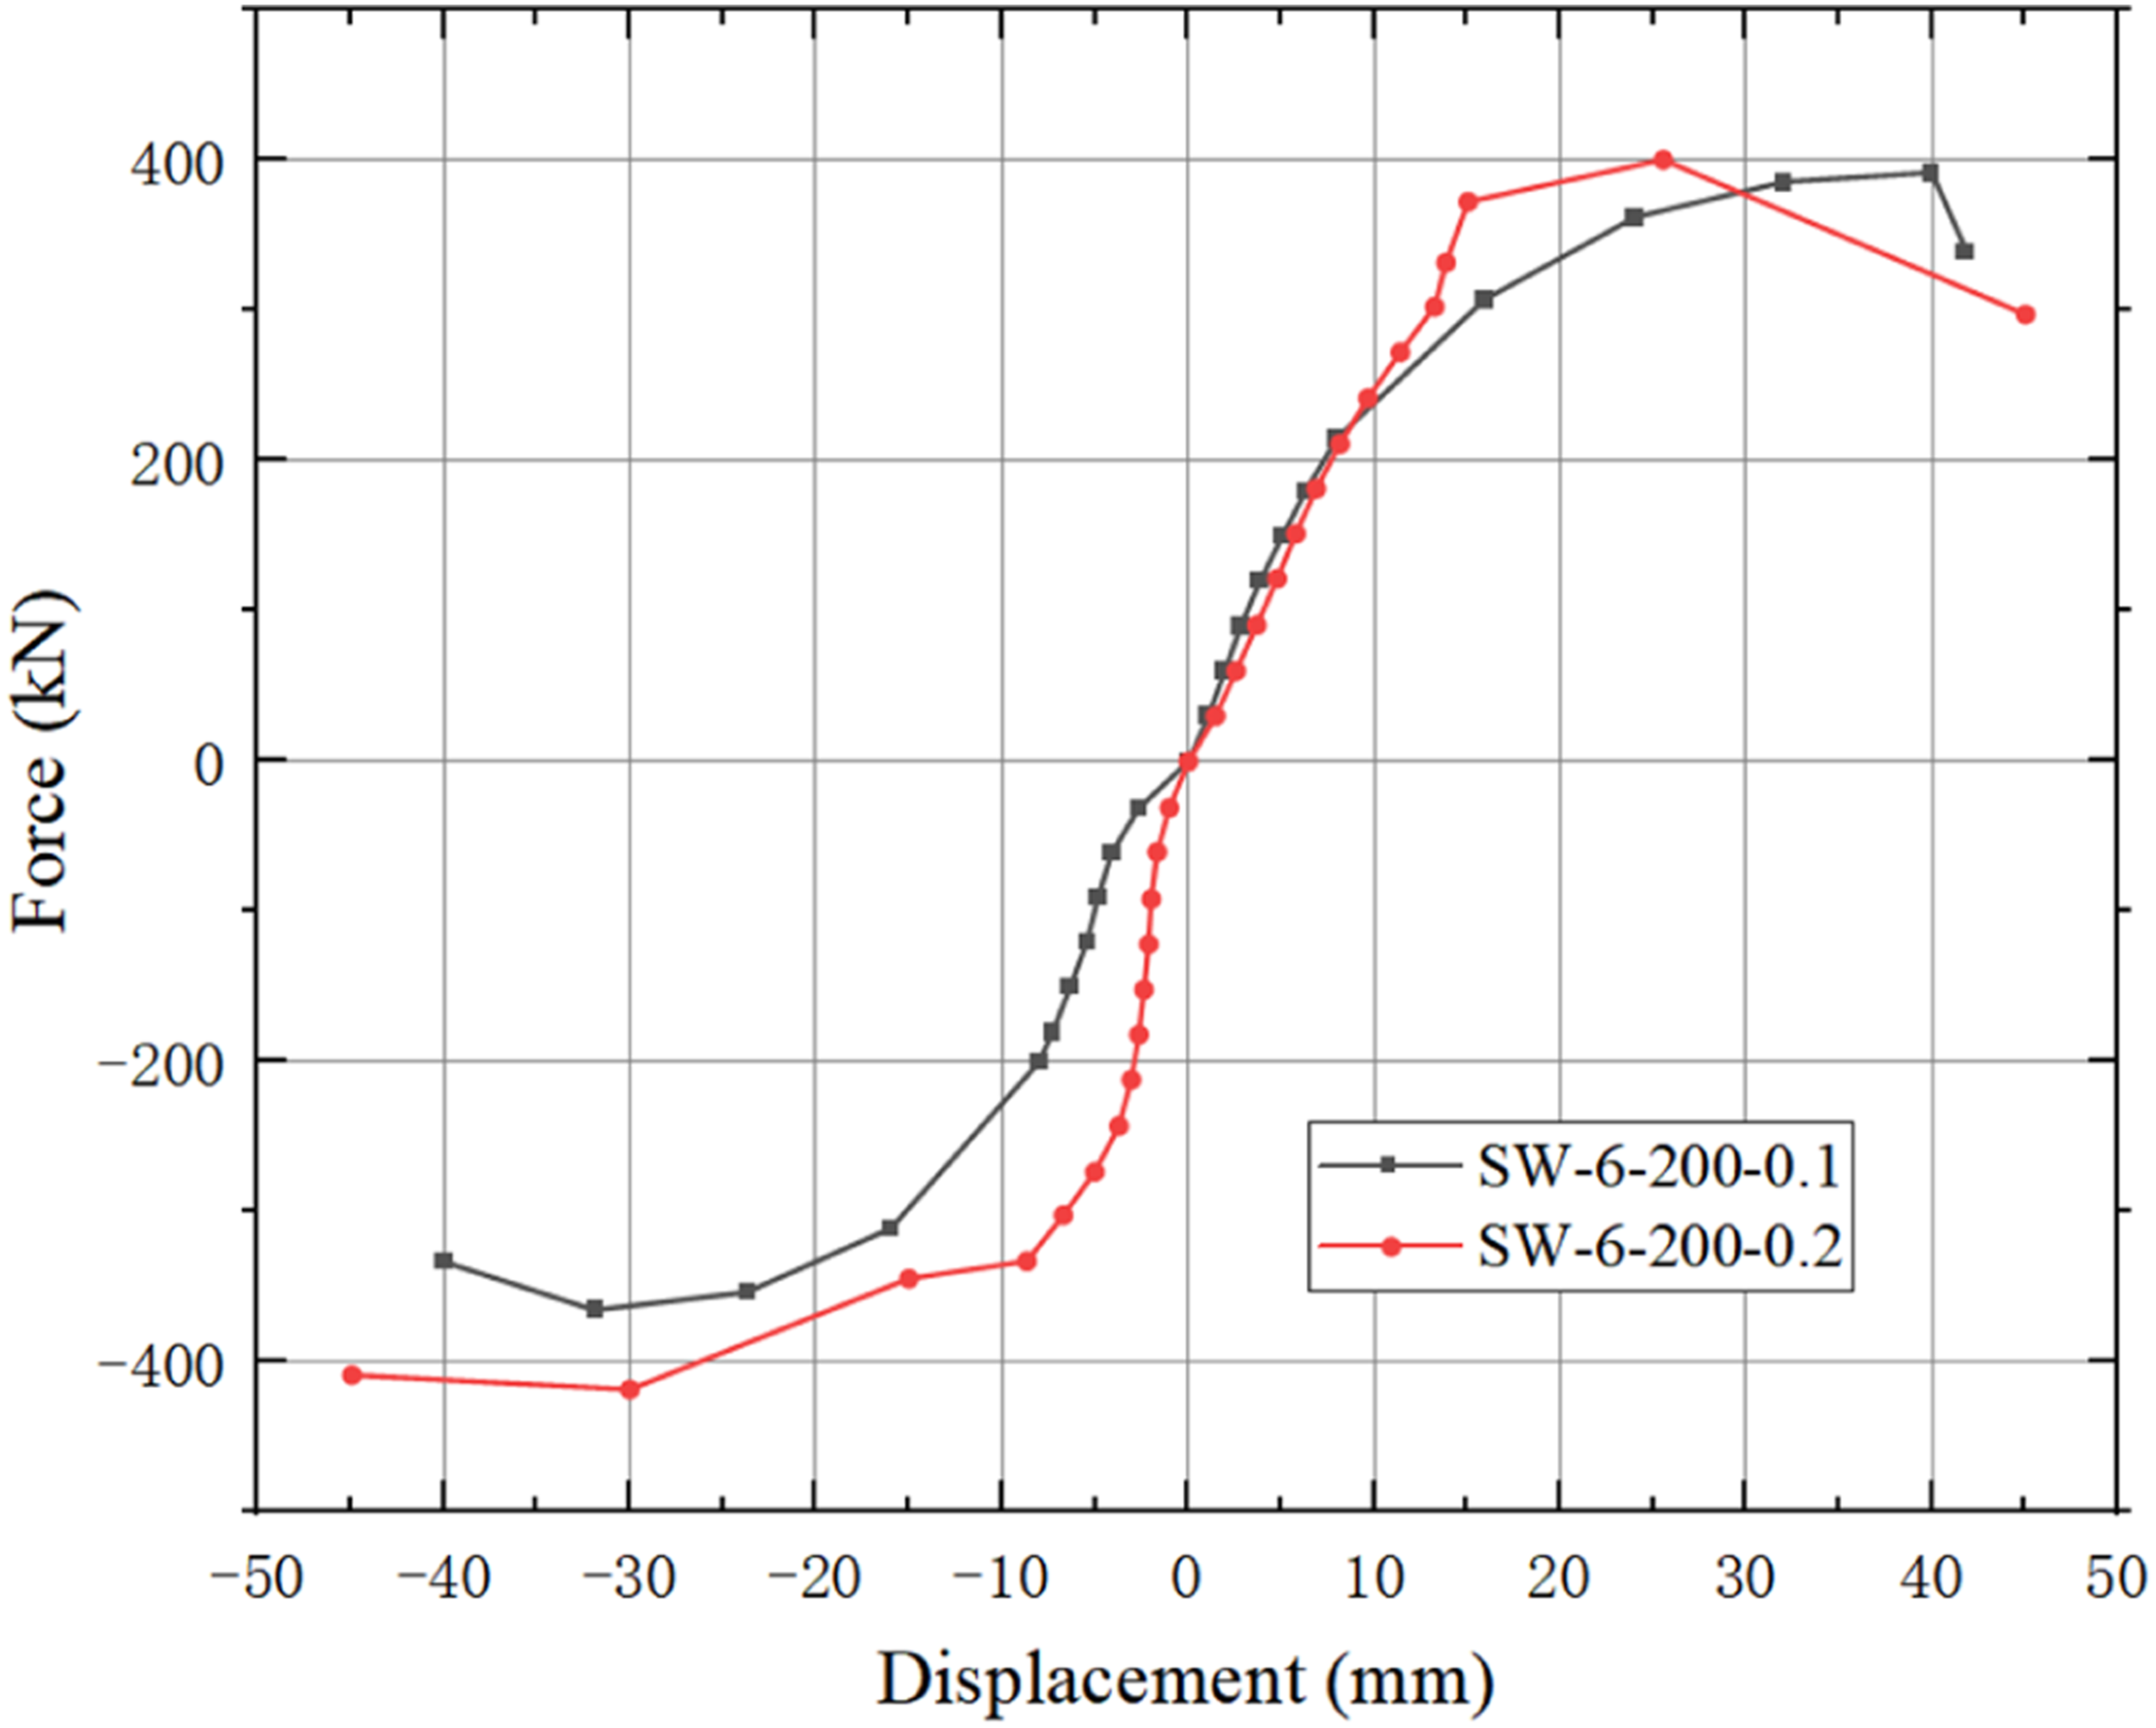
Load-displacement hysteretic curve and skeleton curve of SW-6-200-0.1 and SW-6-200-0.2 were illustrated in Figures 7 and 8. The hysteresis curves of SW-6-200-0.1/0.2 showed bow-shaped, indicating that the specimens had good seismic performance, but shear walls were affected by shear forces and bond slip between reinforced concrete, which produced pinching effects. At the beginning of displacement loading, the SW-6-200-0.1 and SW-6-200-0.2 were in the elastic phase. With the increase of loading displacement, two specimens gradually turned into the plastic stage and the hysteretic loop area of SW-6-200-0.2 was larger than that of the SW-6-200-0.1. It showed that SW-6-200-0.2 had better plastic deformation capacity than SW-6-200-0.1. Figure 8 showed the comparison of the skeleton curves of two specimens, and the curves were S-shaped. For specimen SW-6-200-0.2, the development trend of the skeleton curve before yielding was consistent with SW-6-200-0.1, but the bearing capacity of specimen SW-6-200-0.2 after yielding was higher than that of SW-6-200-0.1. Load-displacement hysteretic curves. Envelope curves of hysteresis loops of two specimens.
Strength capacity and ductility
Mechanical Behaviors of the Characteristic Points.

It can be noticed from Table 4 that specimen SW-6-200-0.2 has better mechanical performance than SW-6-200-0.1. The yield load of SW-6-200-0.2 increased by 8.89%, the maximum load increased by 8.10%, and the ultimate load increased by 4.83%. The carrying capacity of the specimen increased as the axial pressure ratios raised, and the ductility coefficient µ increased. The θ of SW-6-200-0.1 and SW-6-200-0.2 in the ultimate state reach 1/61 and 1/56 respectively, which met the relevant requirements of specification JGJ 3–2010 (2010) on displacement angle limits 1/120.
Stiffness degradation
With the development of cracks in the specimens under the reciprocating load, the plastic damage degree of the test members will continue to accumulate, and the strength and stiffness will gradually decline. This phenomenon is called stiffness degradation, which is caused by the accumulation of concrete damage during the loading process. The stiffness degradation is reflected by K, and the formula for calculating K is shown in equation (1).
Figure 9 shows the change of stiffness K under different displacements. The degradation of the two test members is faster in the early stage and gradually tends to be stable in the later stage of the test with the increase of displacements. The stiffness of SW-6-200-0.2 is greater than that of SW-6-200-0.1 t at the early stage of loading. With the increasing displacement, the stiffness of SW-6-200-0.2 degrades faster, and the stiffness degradation of the two specimens tends to be consistent at the later stage of the test. The analysis shows that increasing the axial compression ratio of the specimen will aggravate the stiffness degradation. The degradation characteristics of stiffness for SW-6-200-0.1/0.2.
Energy dissipation capacity
When the specimen is subjected to cyclic loading, due to the plastic deformation characteristics of the specimen itself, the energy generated by the deformation of the test element will be consumed during the loading process. As illustrated in Figure 10, the regions contained by the force-displacement hysteresis loop can be used to compute the energy absorbed by the deformation of the shear wall. The equivalent damping coefficient ℎ
eq
is commonly used to measure the strength of the energy dissipation capacity of a structure or specimen and is calculated from equation (2). The Schematic drawings of energy dissipation capacity calculation. Equivalent viscous damping coefficient curve of shear wall.
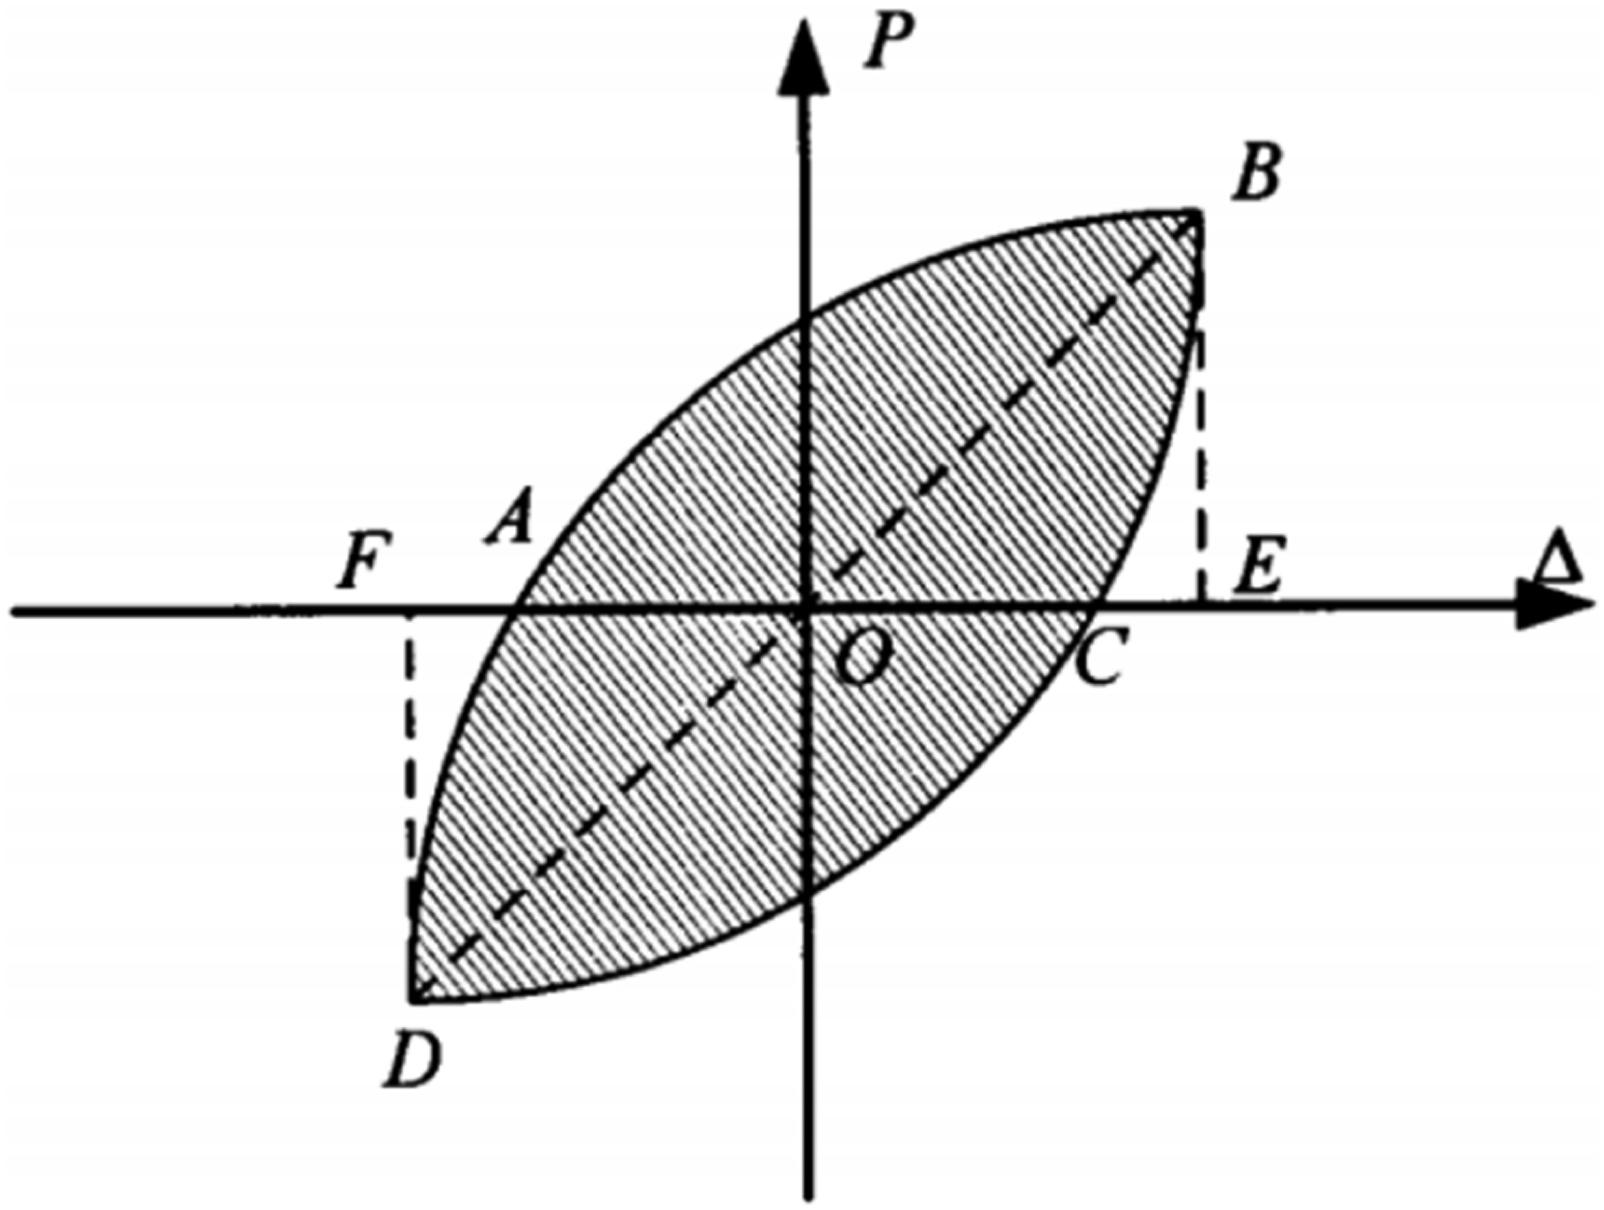
S(ABC + CDA) = area enclosed by the hysteresis loop; S(OBE + ODF) = summation of the triangle areas OBE and ODF.
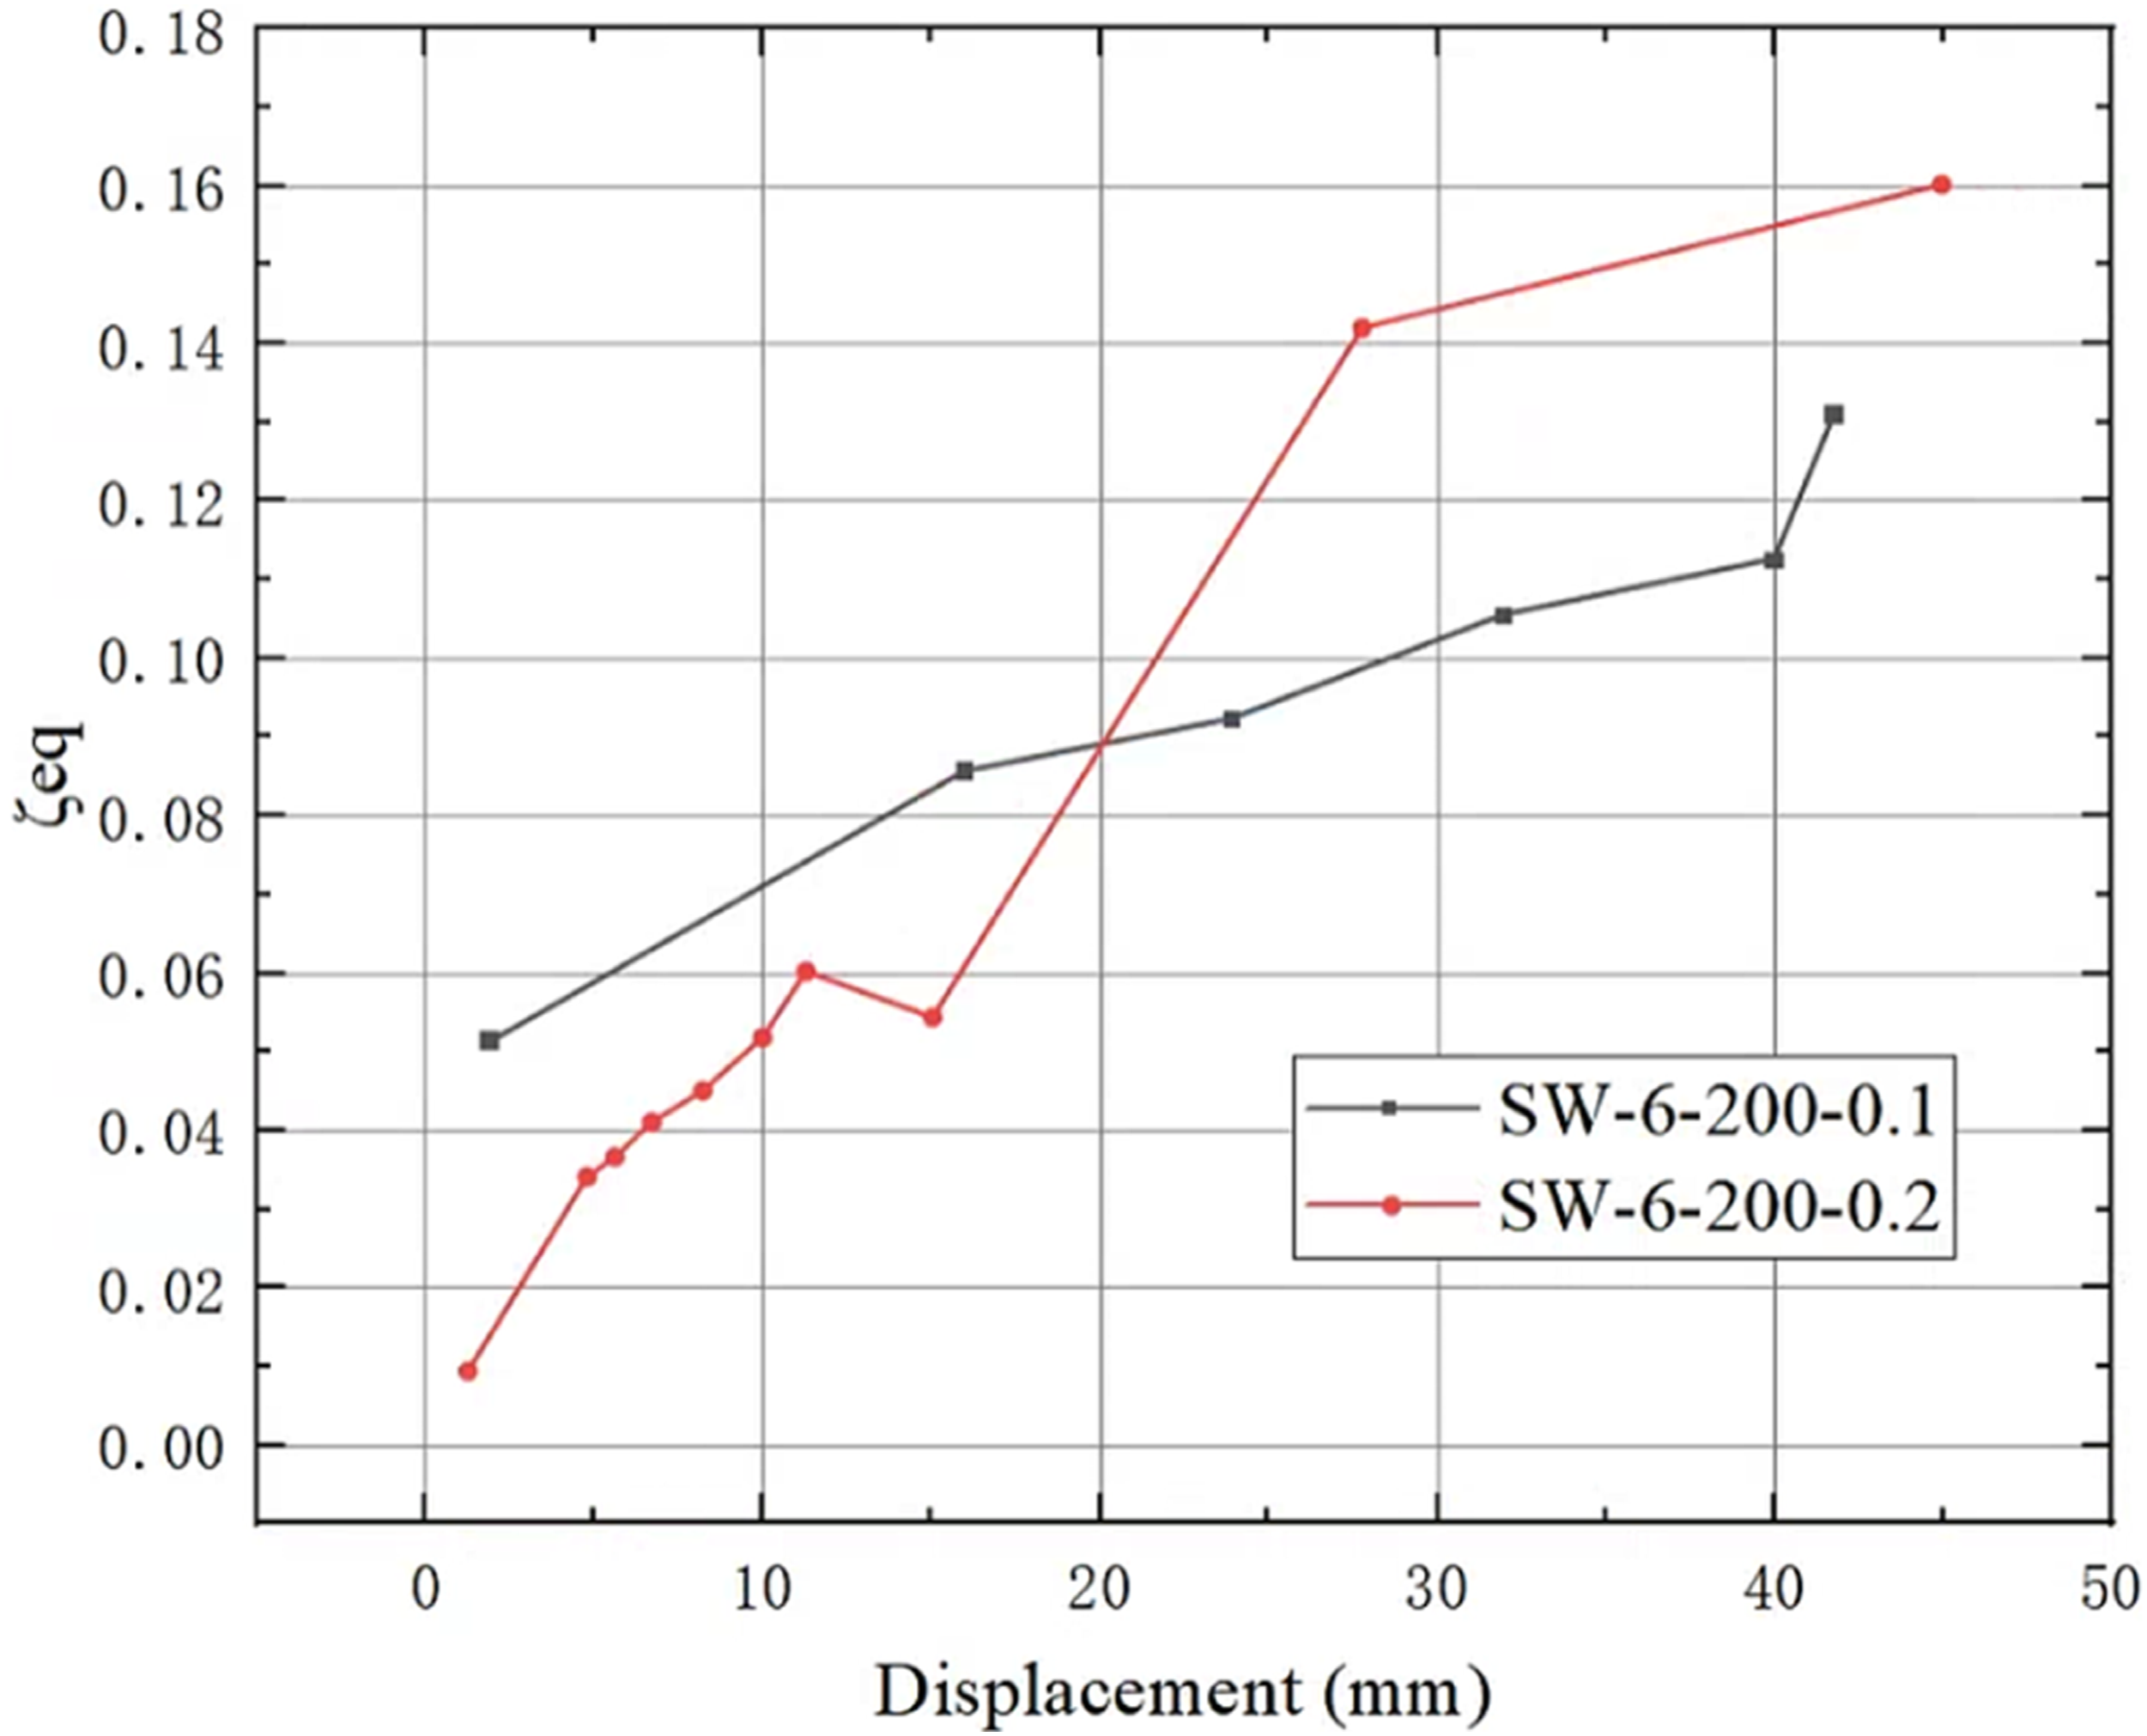
As illustrated in Figure 11, the trend of the increase in the equivalent damping coefficient of the specimens in the early stages of the test remained the same when the SW-6-200-0.1 was compared to the SW-6-200-0.2, and the damping coefficient of the specimens increased when the member entered the plastic deformation stage and the axial pressure ratio increased. It can be concluded that increasing the axial pressure to a certain extent for the shear wall can increase the energy dissipation capacity of the specimen.
Numerical simulation
Finite element models
Figure 12 shows the model of SW-6-200-0.1 and SW-6-200-0.2, the shear wall, foundation beam, and SDTCs adopted eight-node hexahedral reduction element (C3D8R). The rebars adopted three-dimensional truss element T3D2. The details of the models were determined, as shown in Table 5. Finite element model of specimens. (a) Whole model. (b) Skeleton model. (c) SDTCs model. Details of Finite Element Models.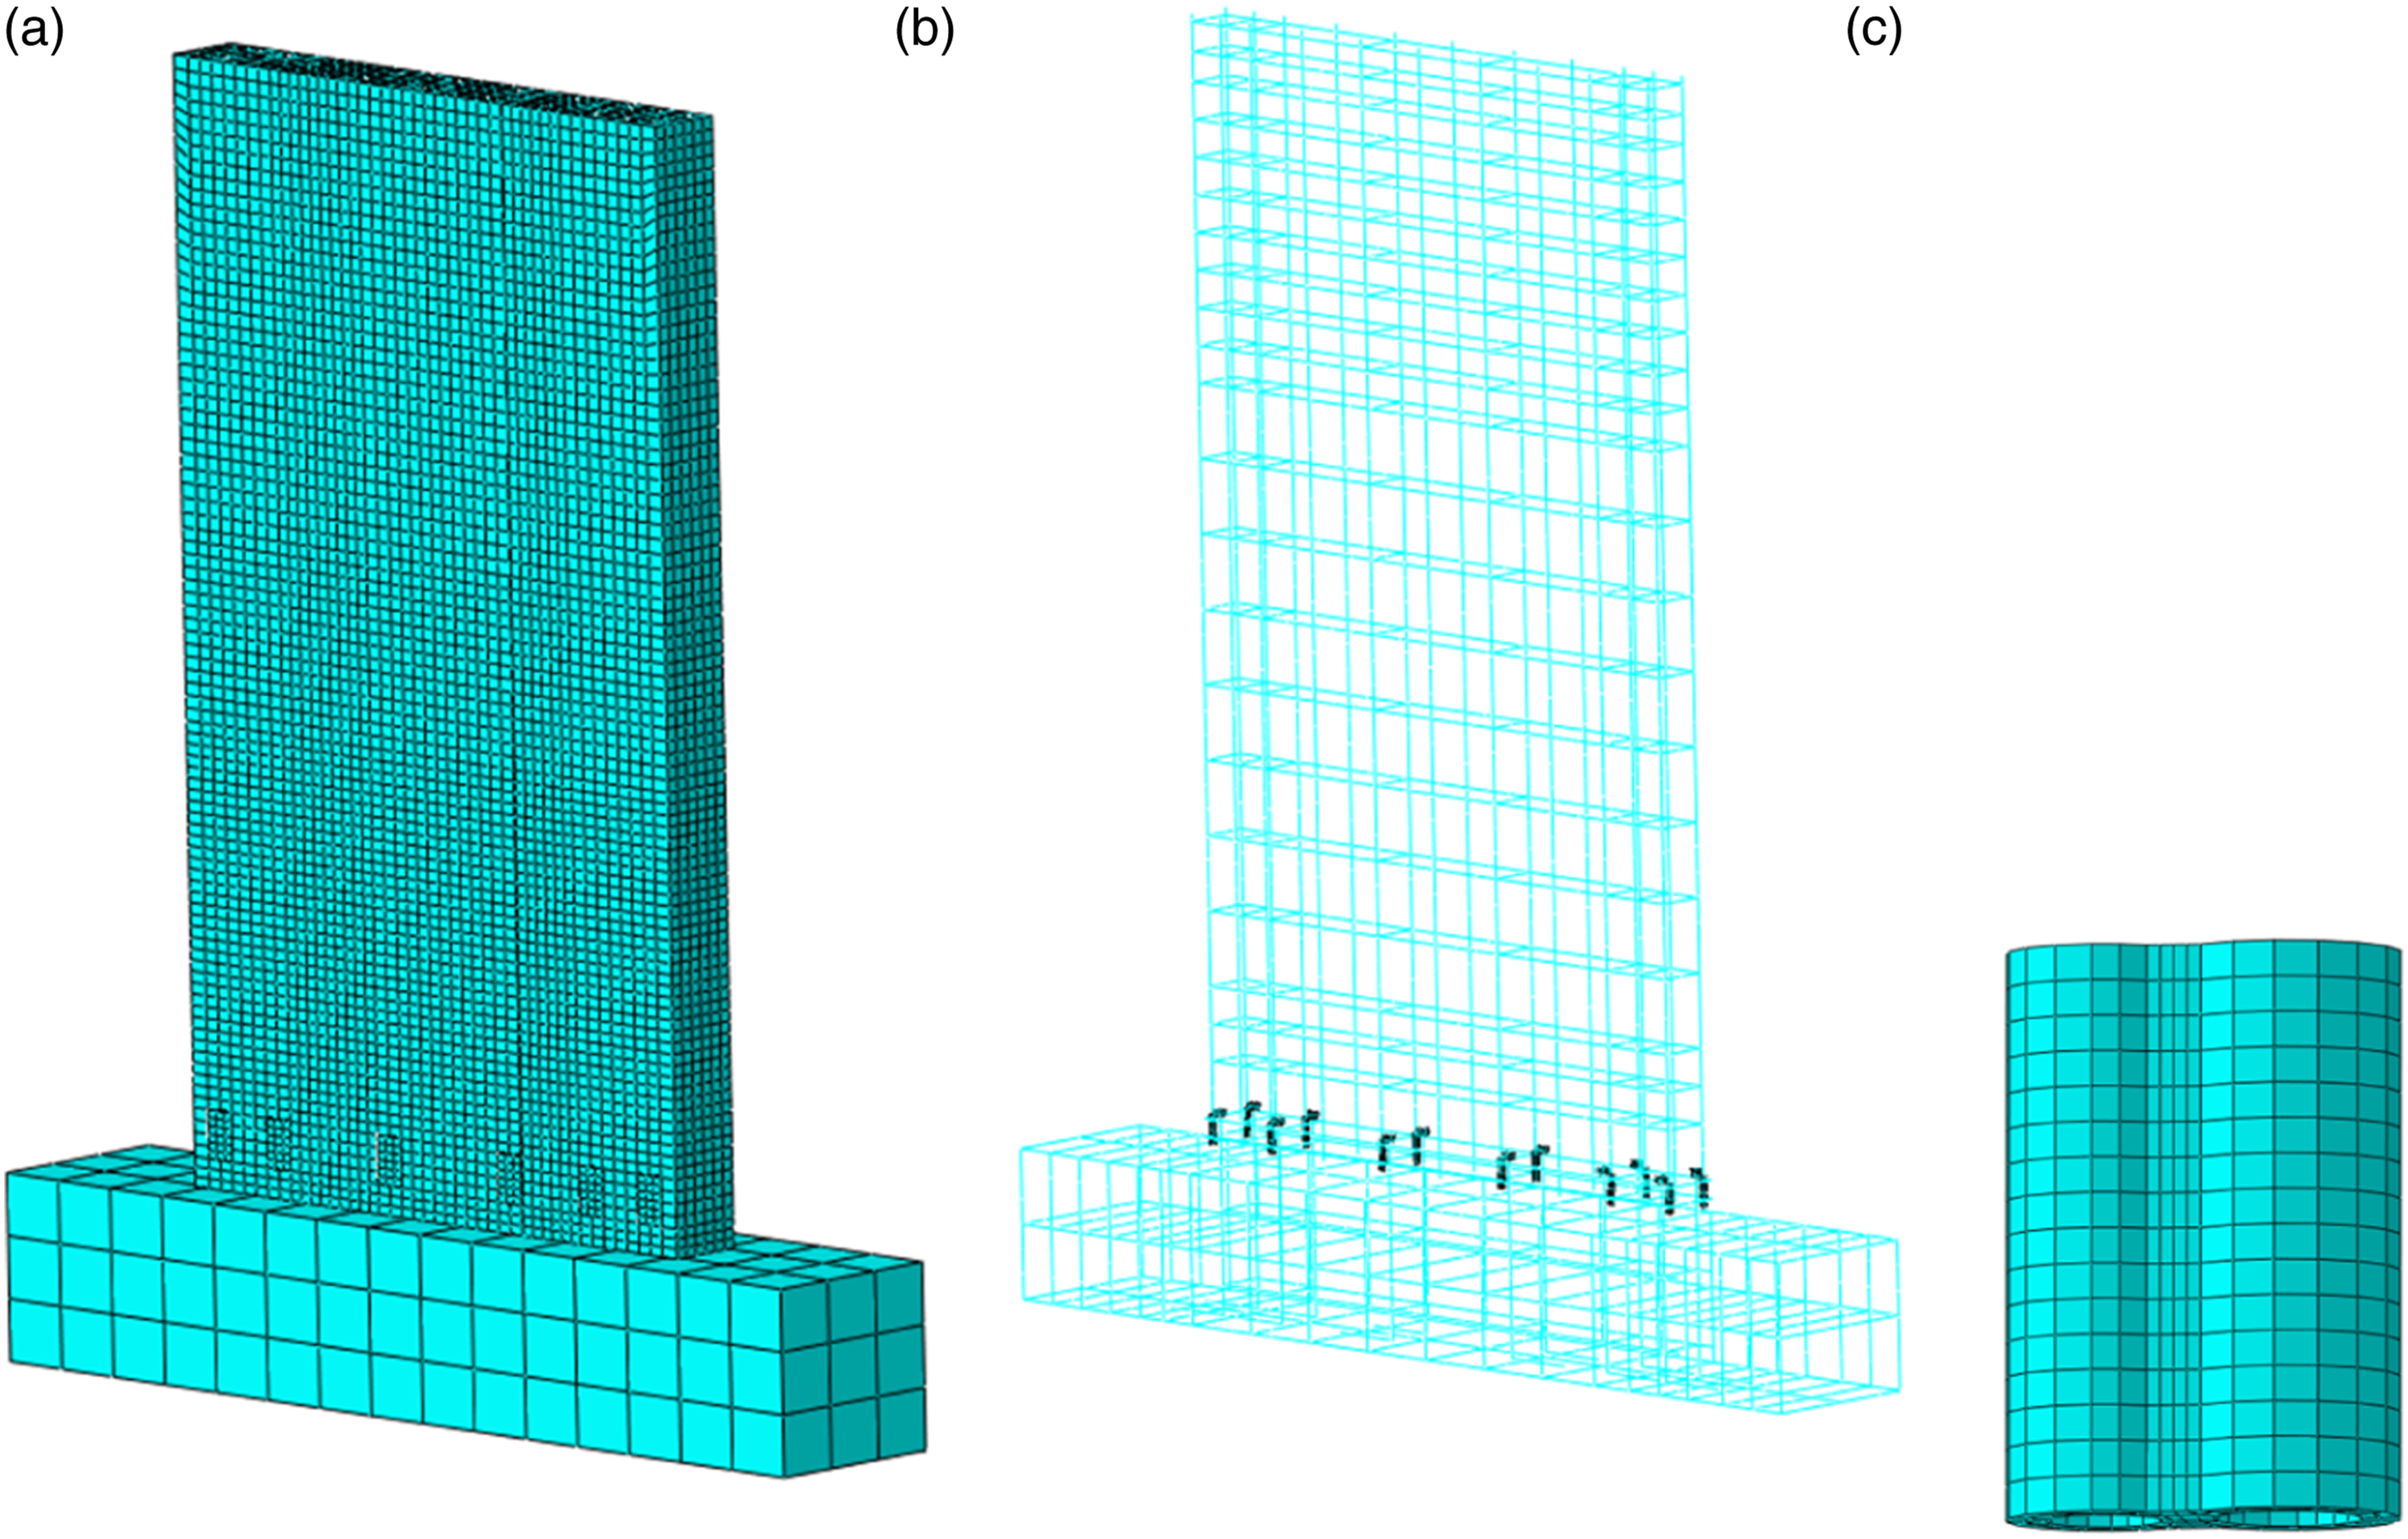

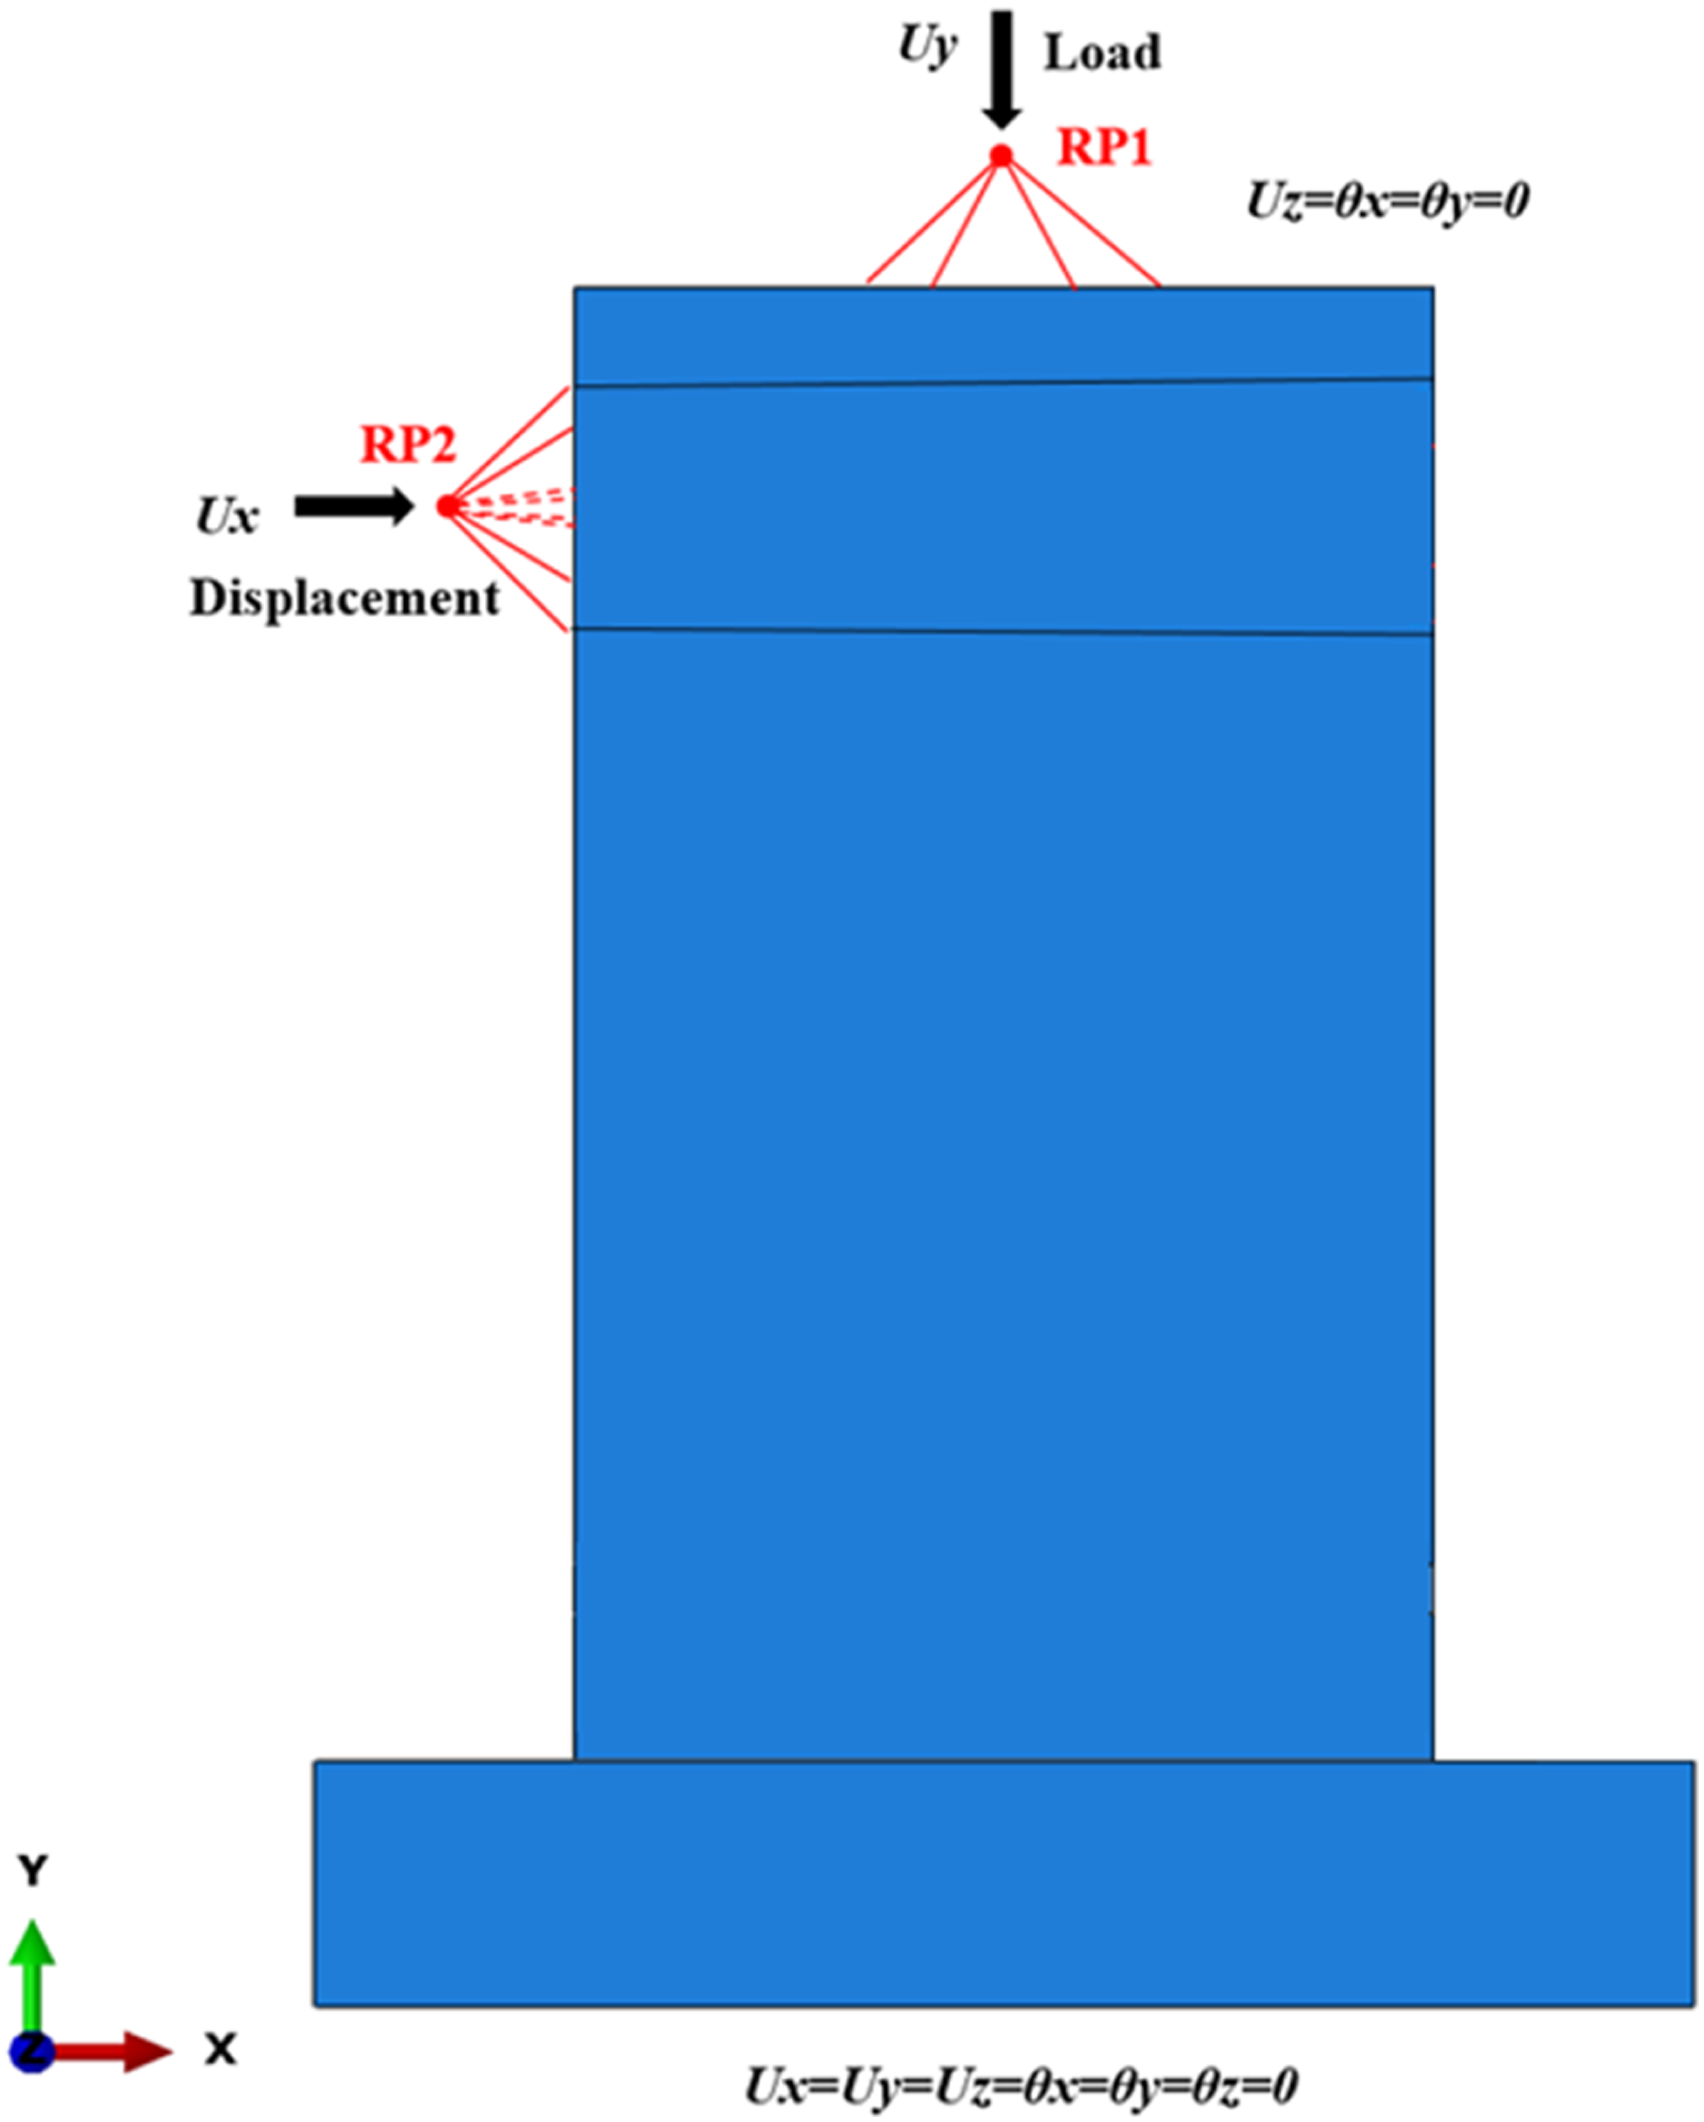
As shown in Figure 13, The constitutive relationship of concrete adopts the concrete damage-plasticity model (CDP), which can provide an available simulation of the damage of shear walls under horizontal cyclic loading. The tensile and compressive damage factors in this model illustrate how the initial stiffness degrades as damage accumulates. The compression and tension constitutive models of concrete are determined by GB50010-2010 C.2.4-1 to C.2.4-5 and C.2.3-1 to C.2.3-4 GB/50010-2010 (2015). Steel materials, including rebars and SDTCs were simulated by the bilinear model. Figure 14 illustrates the boundary and load constraints of the model. The bottom surface of the foundation beam does not allow translation and rotation in any direction. The reference points RP1 and RP2 are set on the upper and left sides of the model, respectively. The reference points and the surfaces are coupled, as presented in Figure 14. The axial force load is applied at RP1 and the displacement load is applied at RP2. To avoid serious out-of-plane deformation, the reference point RP1 cannot move along the Z-axis. The steel reinforcements and SDTCs are embedded in concrete, and the upper wall, lower wall, side wall, and floor slab are all simulated with face-to-face contact. With a friction factor of 0.3, the Mohr-Coulomb friction model is chosen in the tangential direction while the hard contact is used in the normal direction. In reference (Guo, 1999), for the same specimen, the skeleton curve obtained by the monotonic loading method is similar to the curve shape obtained by the low cycle loading test. Although some index values are slightly different, their variation rules are the same, and the simulation convergence of monotonic loading is better. Therefore, to reduce computational costs and achieve better simulation convergence, monotonic loading is used in the simulation in this paper. In addition, the numeric computation type is implicitly. Constitutive model of concrete. Boundary and load conditions of the model.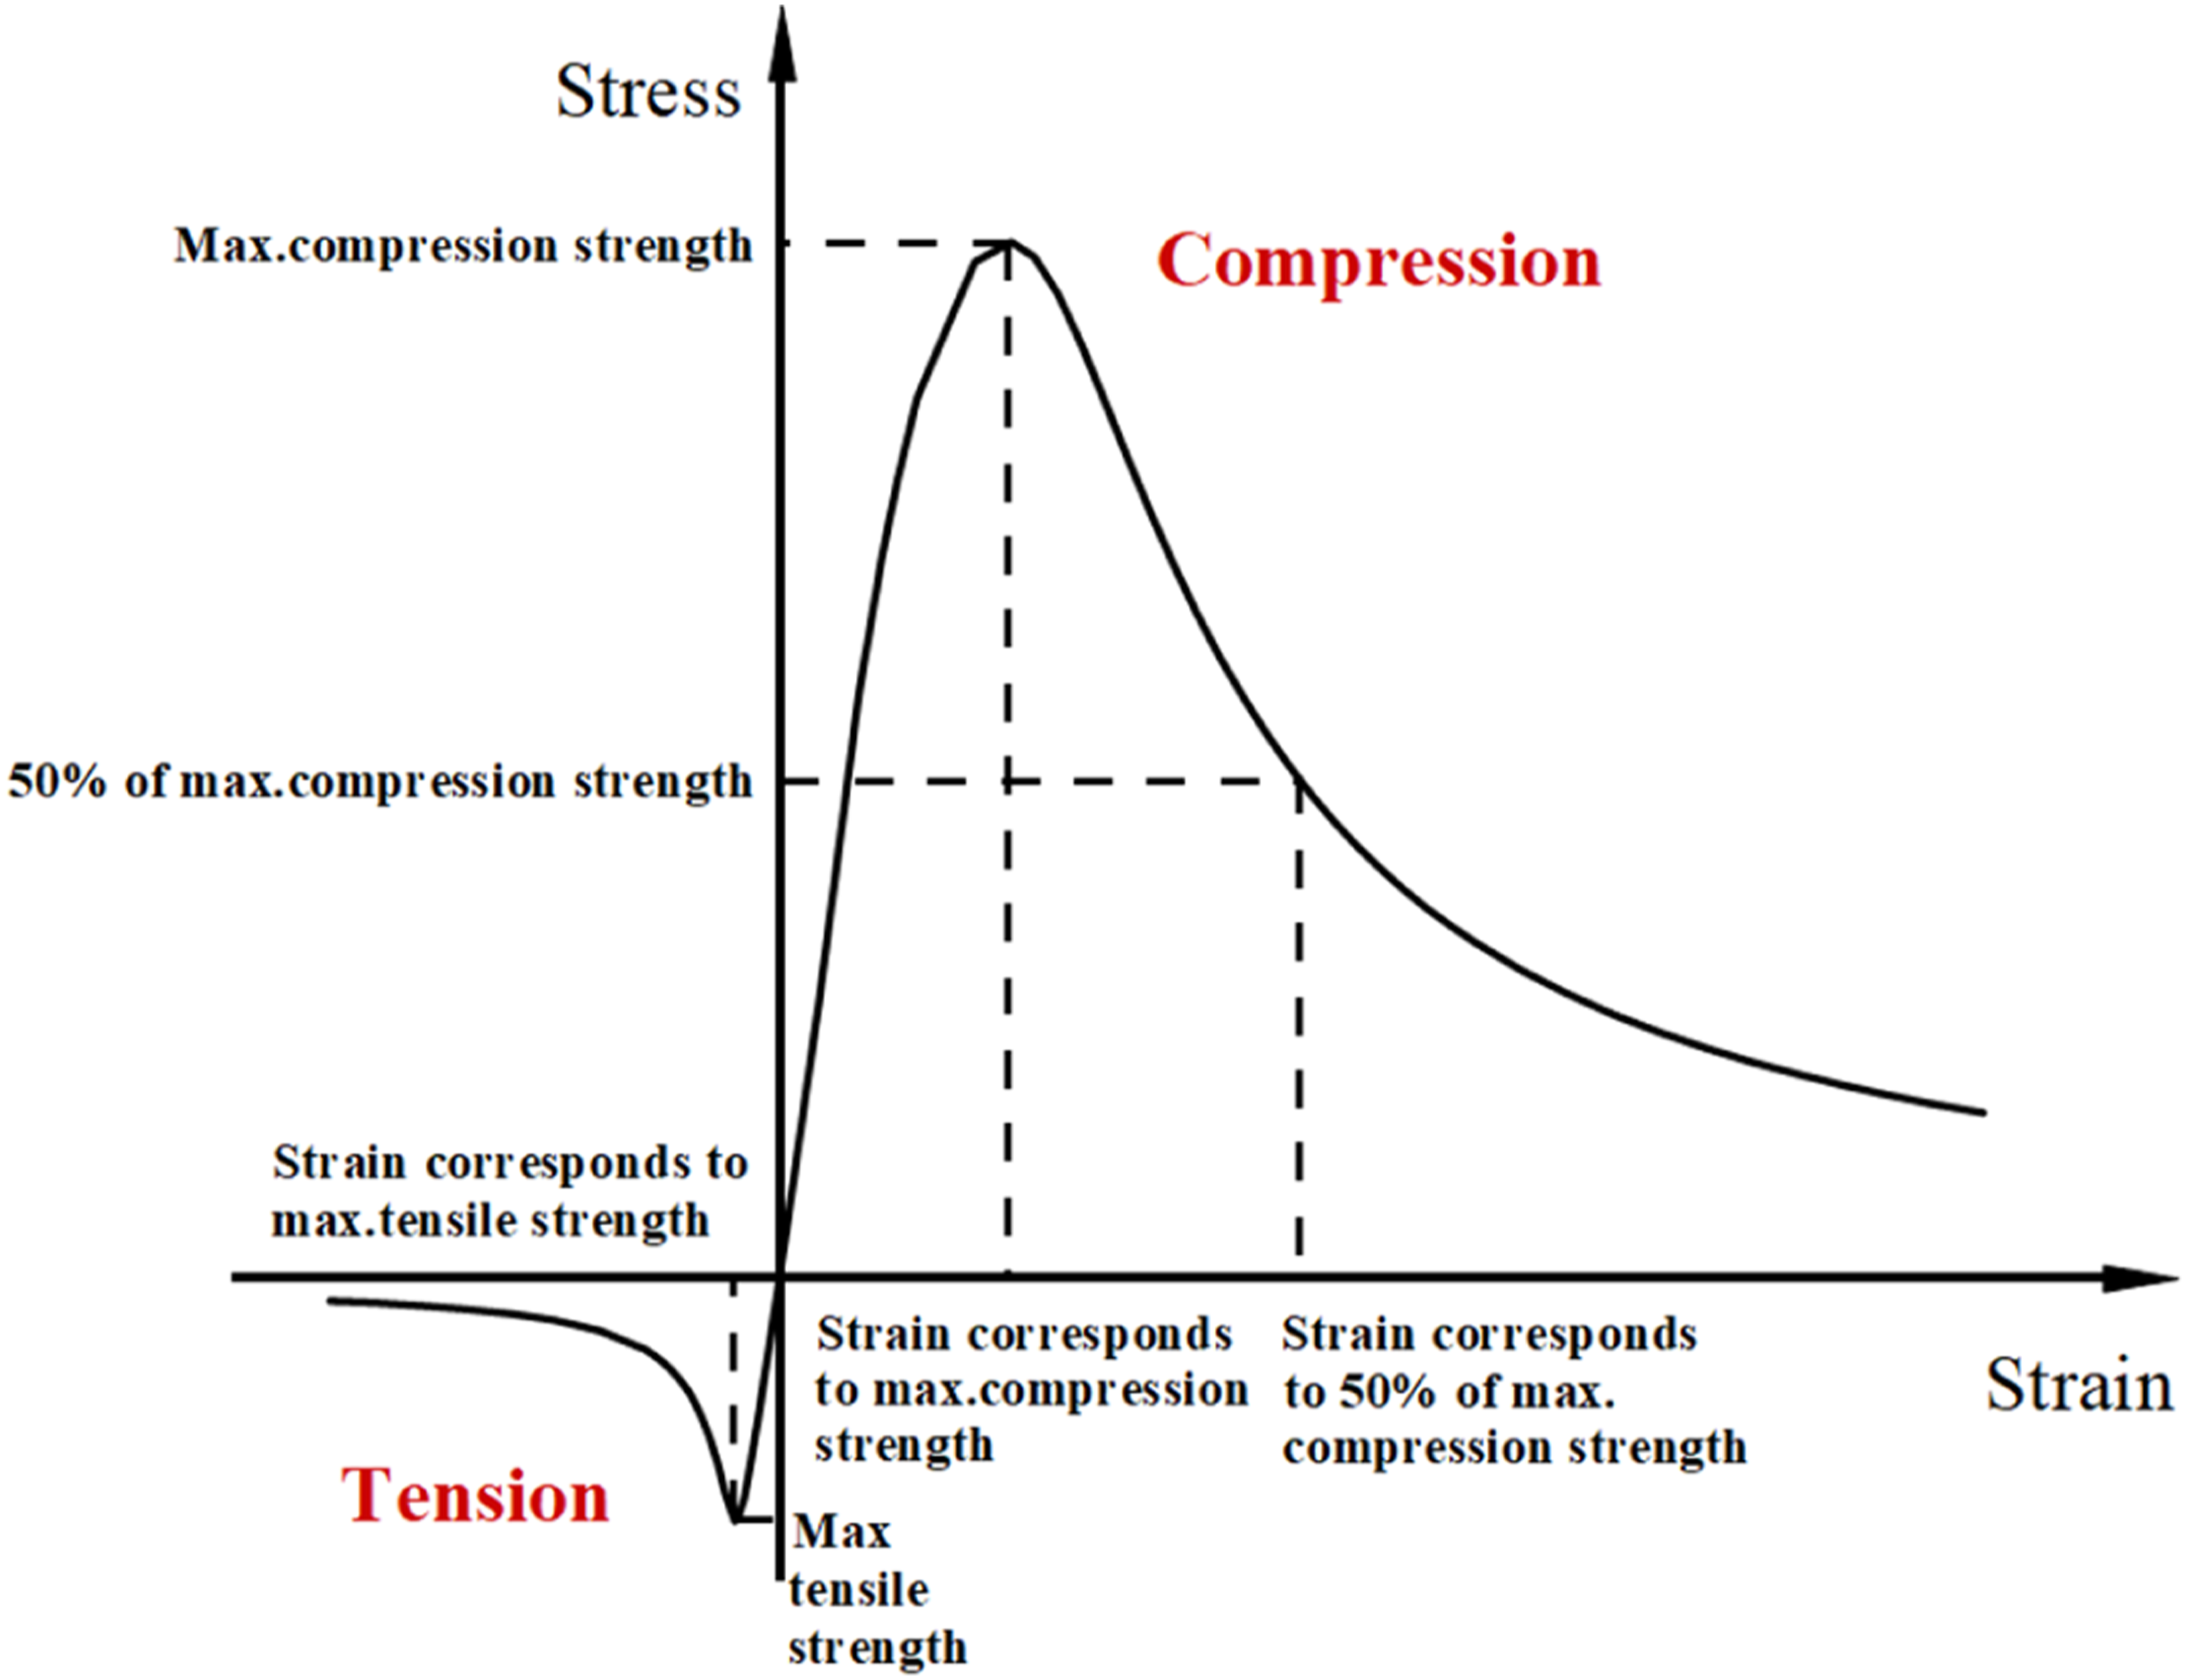
Finite element model verifications
Figure 15 presents the verification of the skeleton curves obtained from experiments and simulations. The initial stiffness and maximum load points of the experimental and simulation results are the same. As shown in Table 6, the value of Simulate/Test ranges from 0.93 to 1.01. The finite element model can effectively represent the actual experimental scenario of the shear wall specimens since the error is within a suitable range. Verification of the skeleton curves of two specimens. (a) Specimen SW-6-200-0.1. (b) Specimen SW-6-200-0.2. Difference of Maximum Load From Test and Simulation.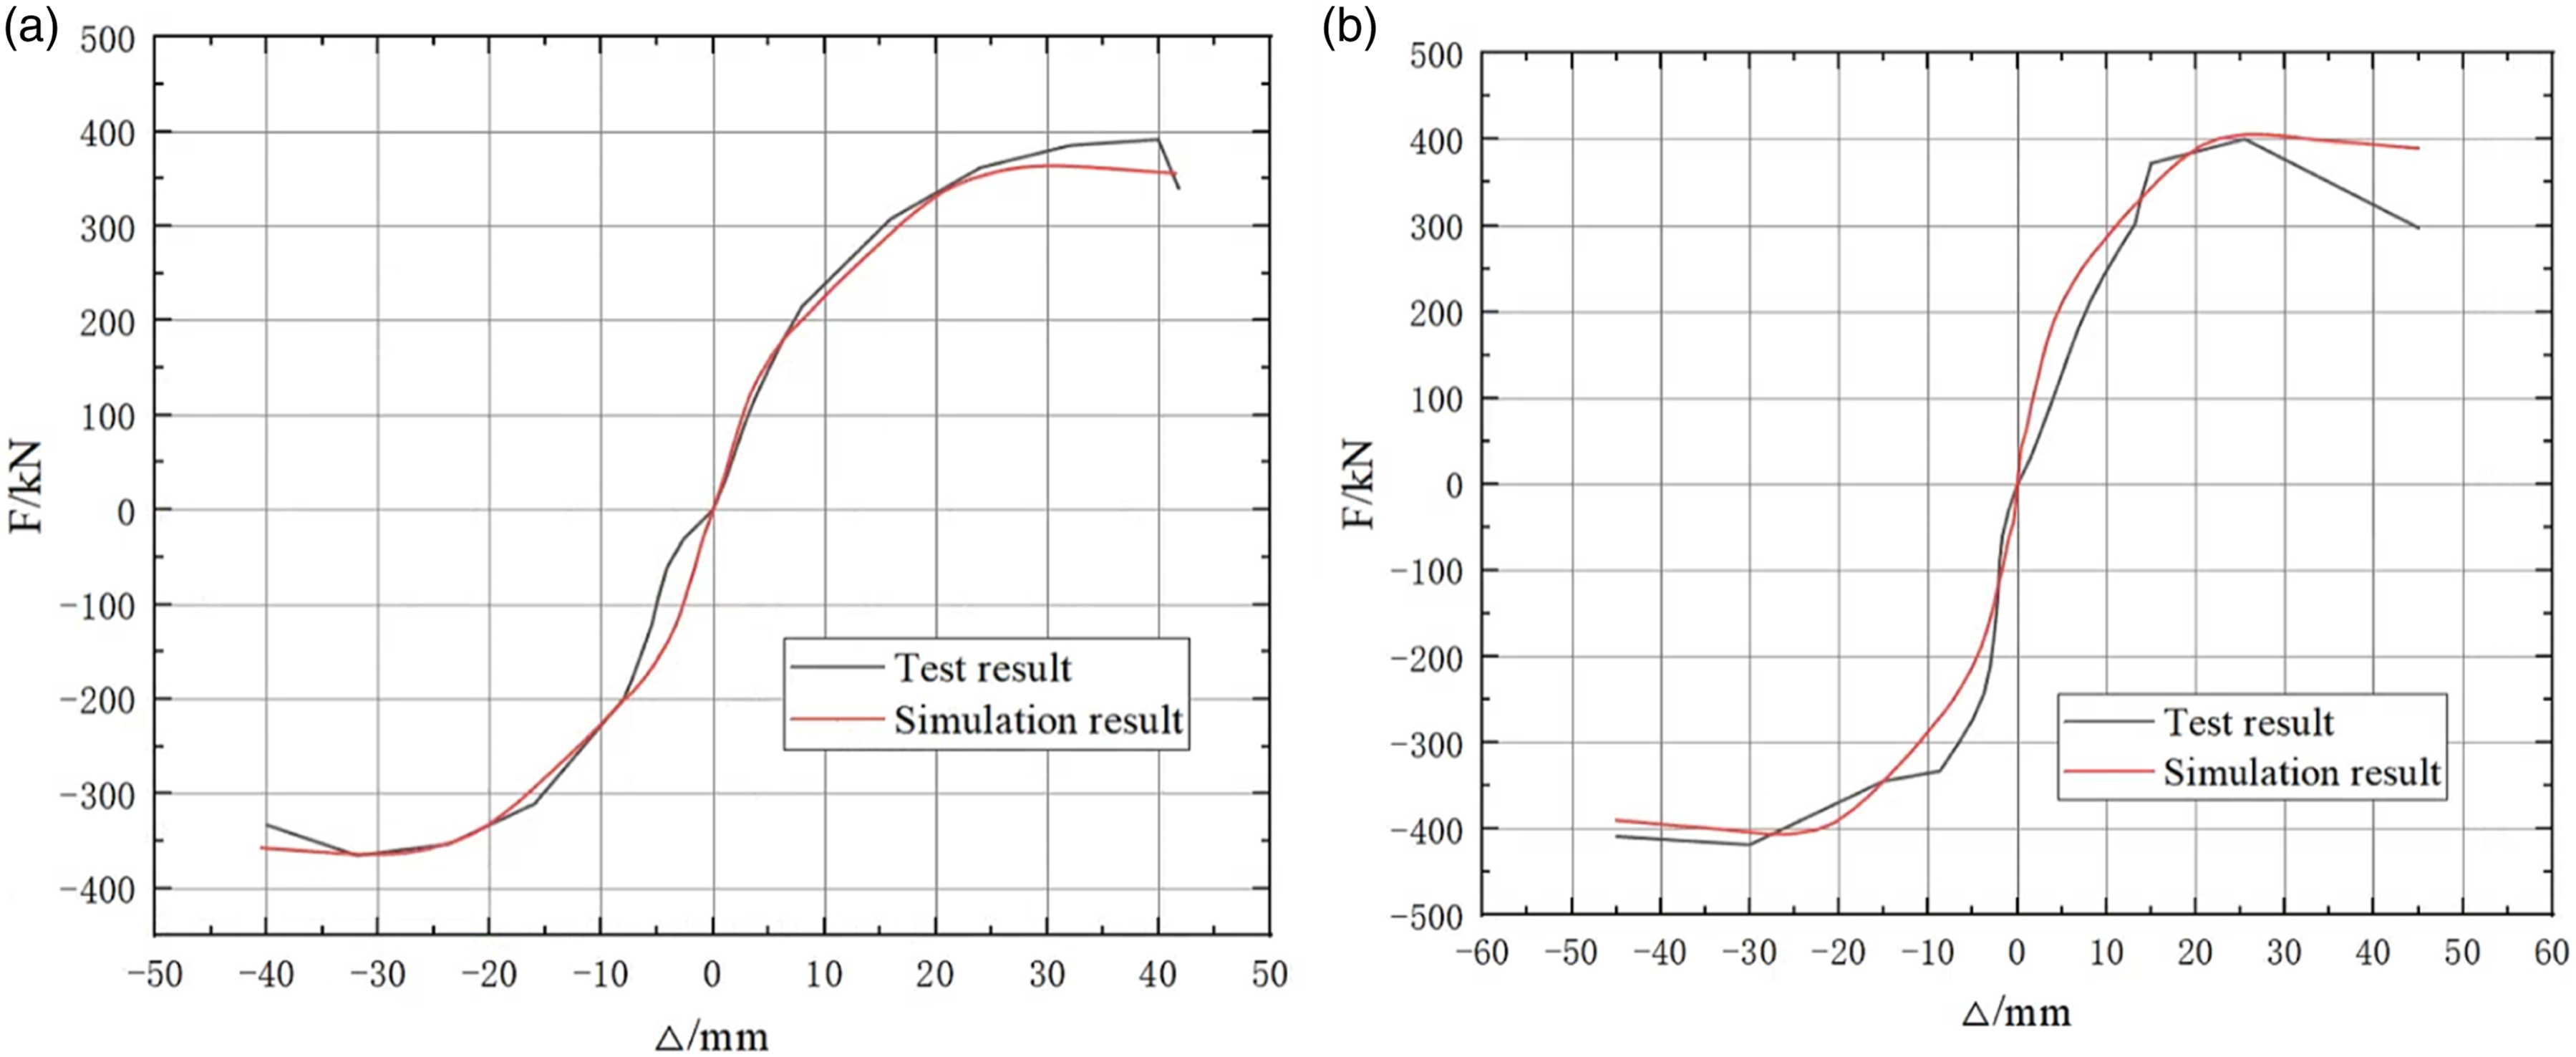

Effect of axial compression ratios
To investigate the effect of the parameter of axial pressure ratio on the mechanical properties of PSWs with SDTCs, seven models with axial pressure ratios of 0.1, 0.15, 0.2, 0.3, 0.4, 0.5, and 0.6 were established and subjected to nonlinear finite element analysis. The settings and constraints of other parameters for the seven different axial compression ratio models are the same as for the SW-6-200-0.1/0.2 specimens. The load-displacement curve and the stress nephograms were illustrated in Figure 16, and Figure 17, respectively. The summary of simulation results was shown in Table 7. Comparison of skeleton curves under different axial pressure ratios. Stress nephograms of SDTCs. (a) Distribution of SDTCs. (b) n = 0.1. (c) n = 0.15. (d) n = 0.2. (e) n = 0.3. (f) n = 0.4. (g) n = 0.5. (h) n = 0.6. Summary of Simulation Results for Different Axial Compression Ratios.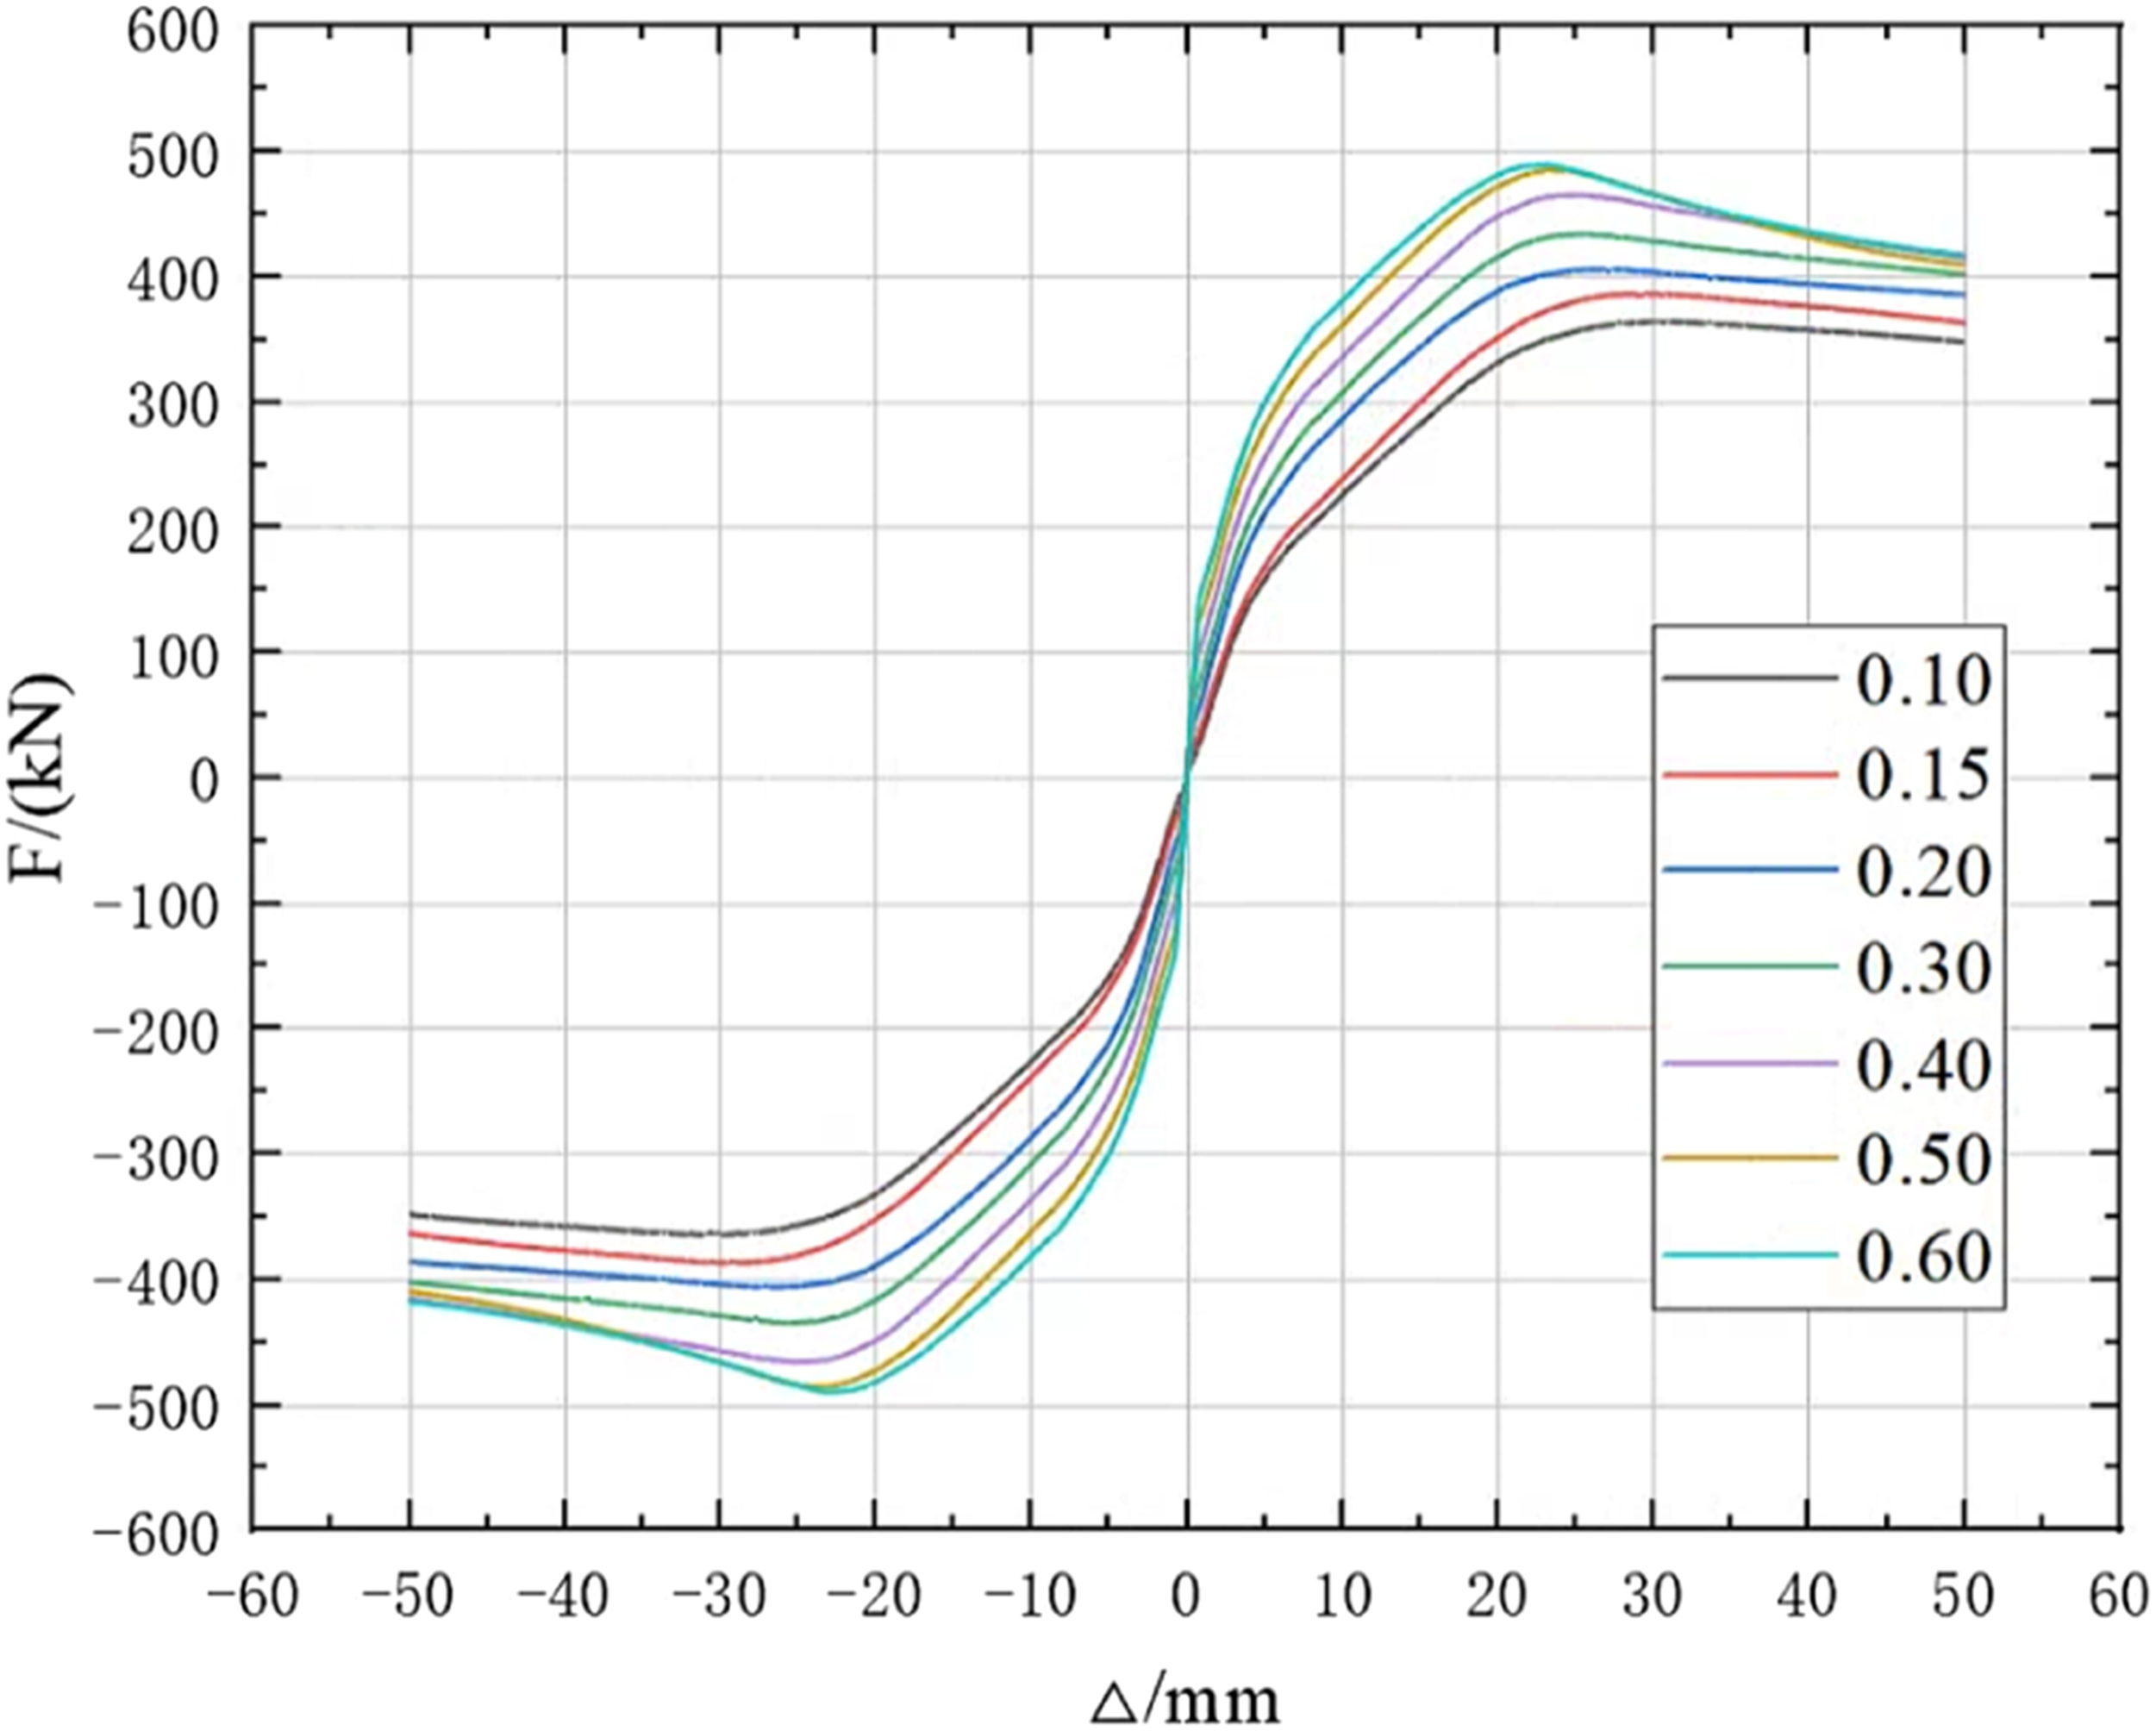
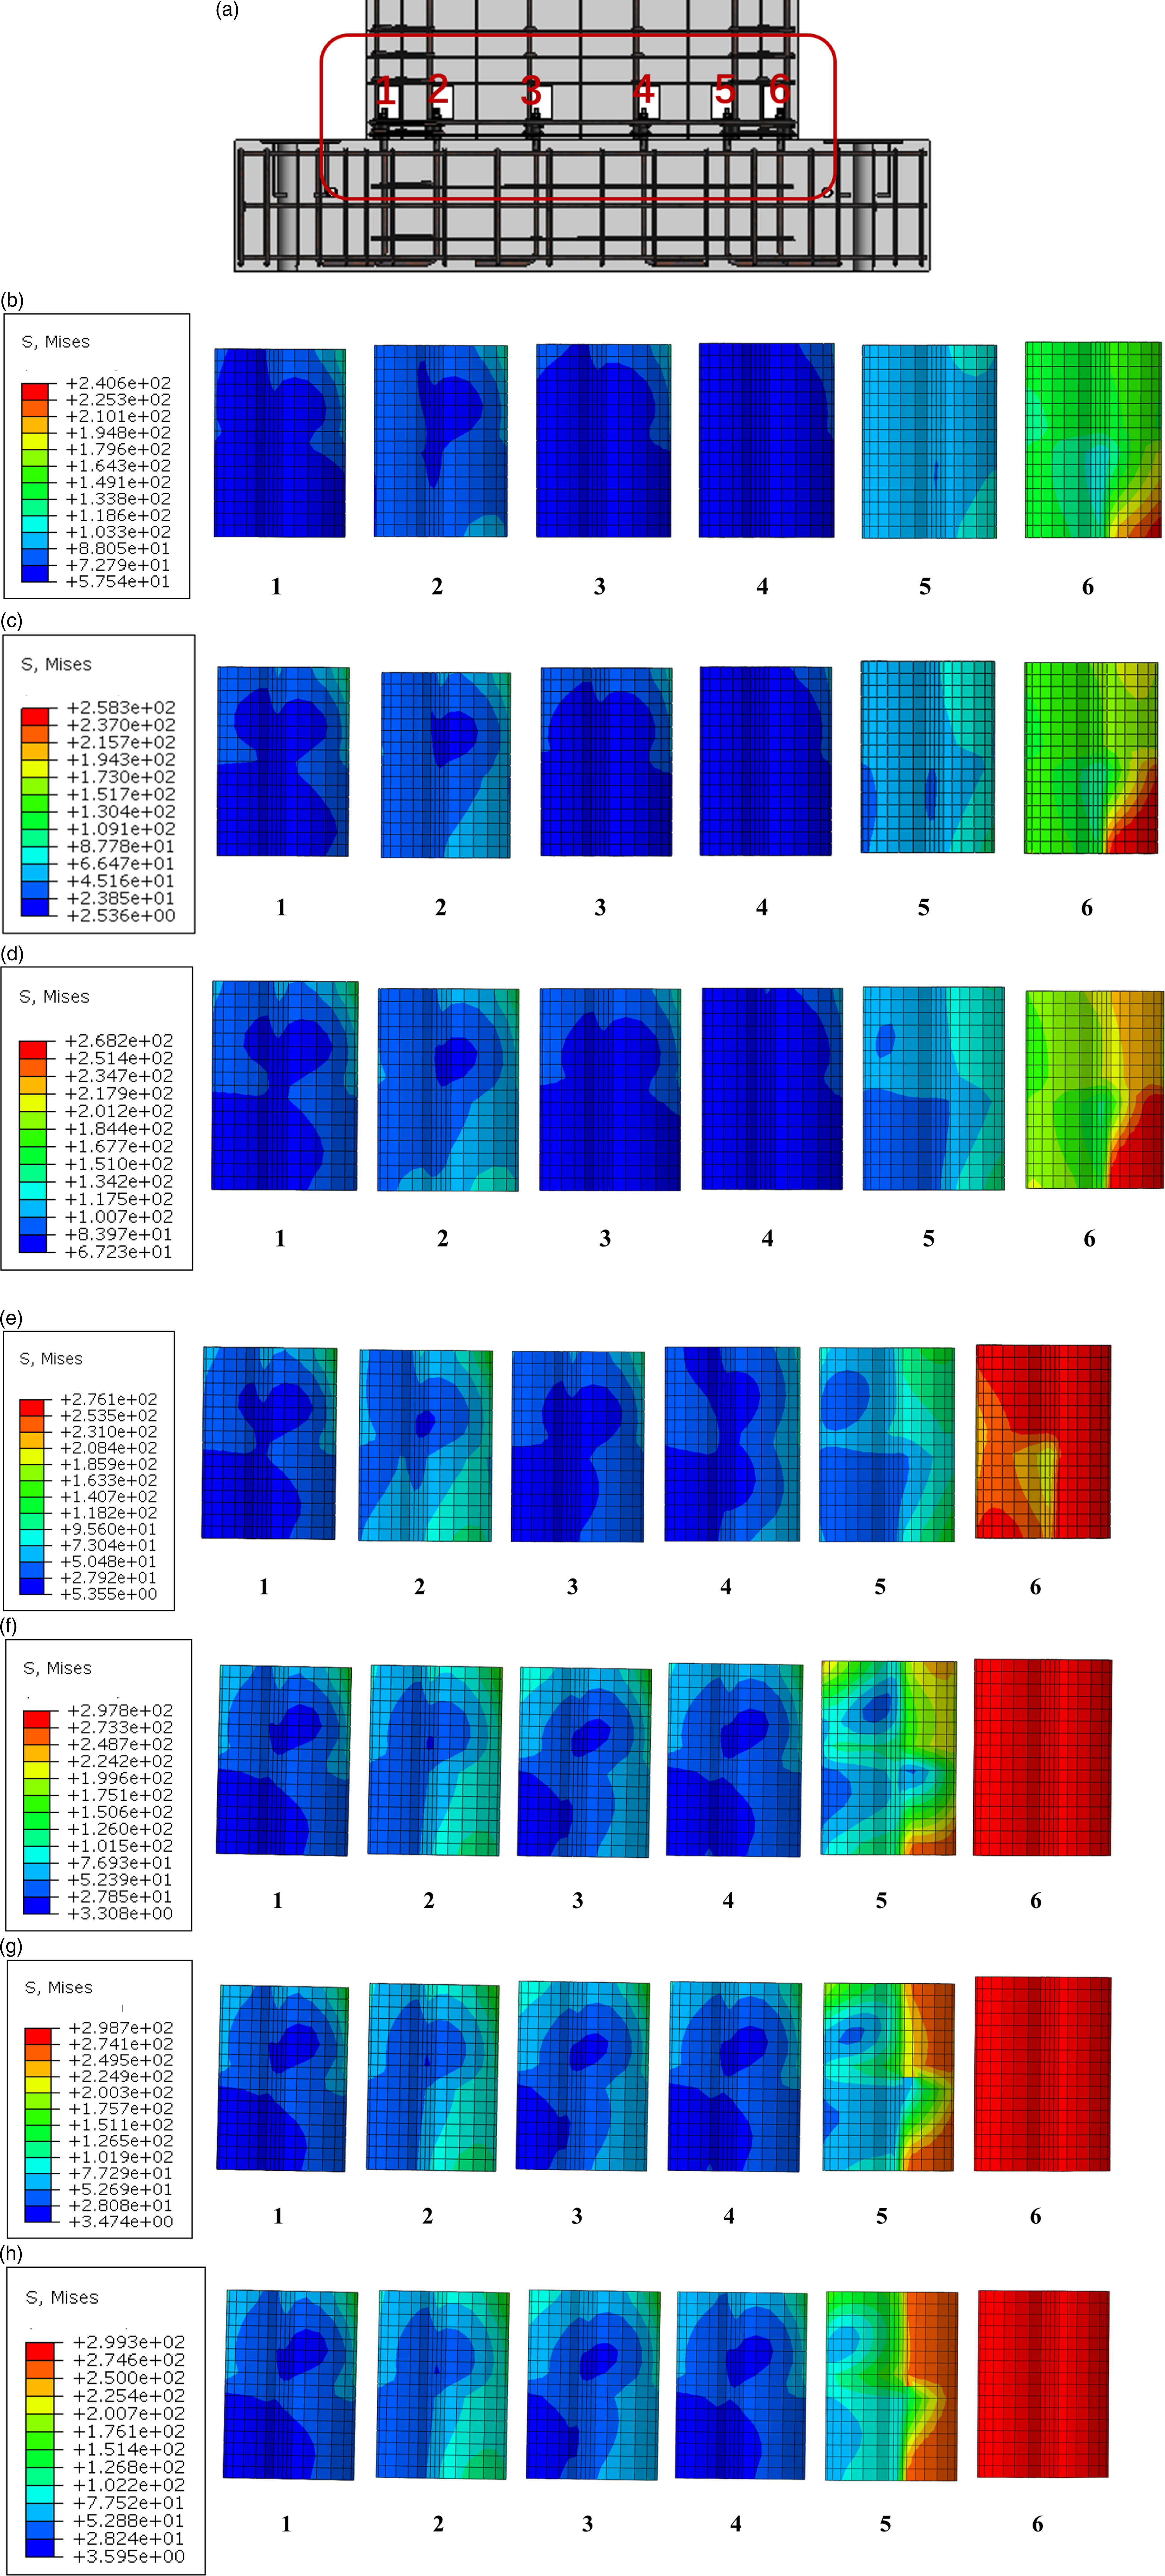

As can be noted from Figure 16, Figure 17, and Table 7: (1) The result showed that as the axial compression ratio raised, the carrying capacity and stiffness of the models increased, but the decreasing trend of force–displacement curve was also more obvious. In particular, when the axial compression ratio exceeds 0.4, the load-displacement curve of the models shows a significant drop segment after the peak point. Consequently, the recommended value of axial pressure ratios should not exceed 0.4. At the same time, the carrying capacity increased tends to be gentle, suggesting that there was a limitation in improving the carrying capacity of the specimens by increasing the axial compression ratios. (2) The maximum stress value of the SDTCs gradually increased and the magnitude of the increase gradually decreased as the axial compression ratios raised from 0.1 to 0.6. The stress of the SDTCs in the tension zone was lower than that in the compression zone. (3) The stress of the SDTCs was always in the elastic stage as the axial compression ratios raised from 0.1 to 0.2. When the axial pressure ratio exceeded 0.2, the SDTCs reached the yielding stage during loading, but they did not reach the ultimate strength of steel 331.70 MPa. At the same time, the reinforcement stress connected by the SDTCs increases as the axial compression ratios raised. Thus, the new type of SDTCs can effectively transfer stresses and can be used as a reliable connection for precast concrete shear walls.
Lateral loading capacity
The lateral loading capacity of PSWs with double tube connections is calculated using the assumptions proposed in the specification GB/50010-2010 (2015). (1) When the shear wall is loaded, the strain changes approximately linearly along the section width. (2) The strain of reinforcement and concrete conforms to the assumption of the plane section. The calculation model of the lateral loading capacity of PSWs with steel double-tube connections is shown in Figure 18. Calculation model of lateral loading capacity.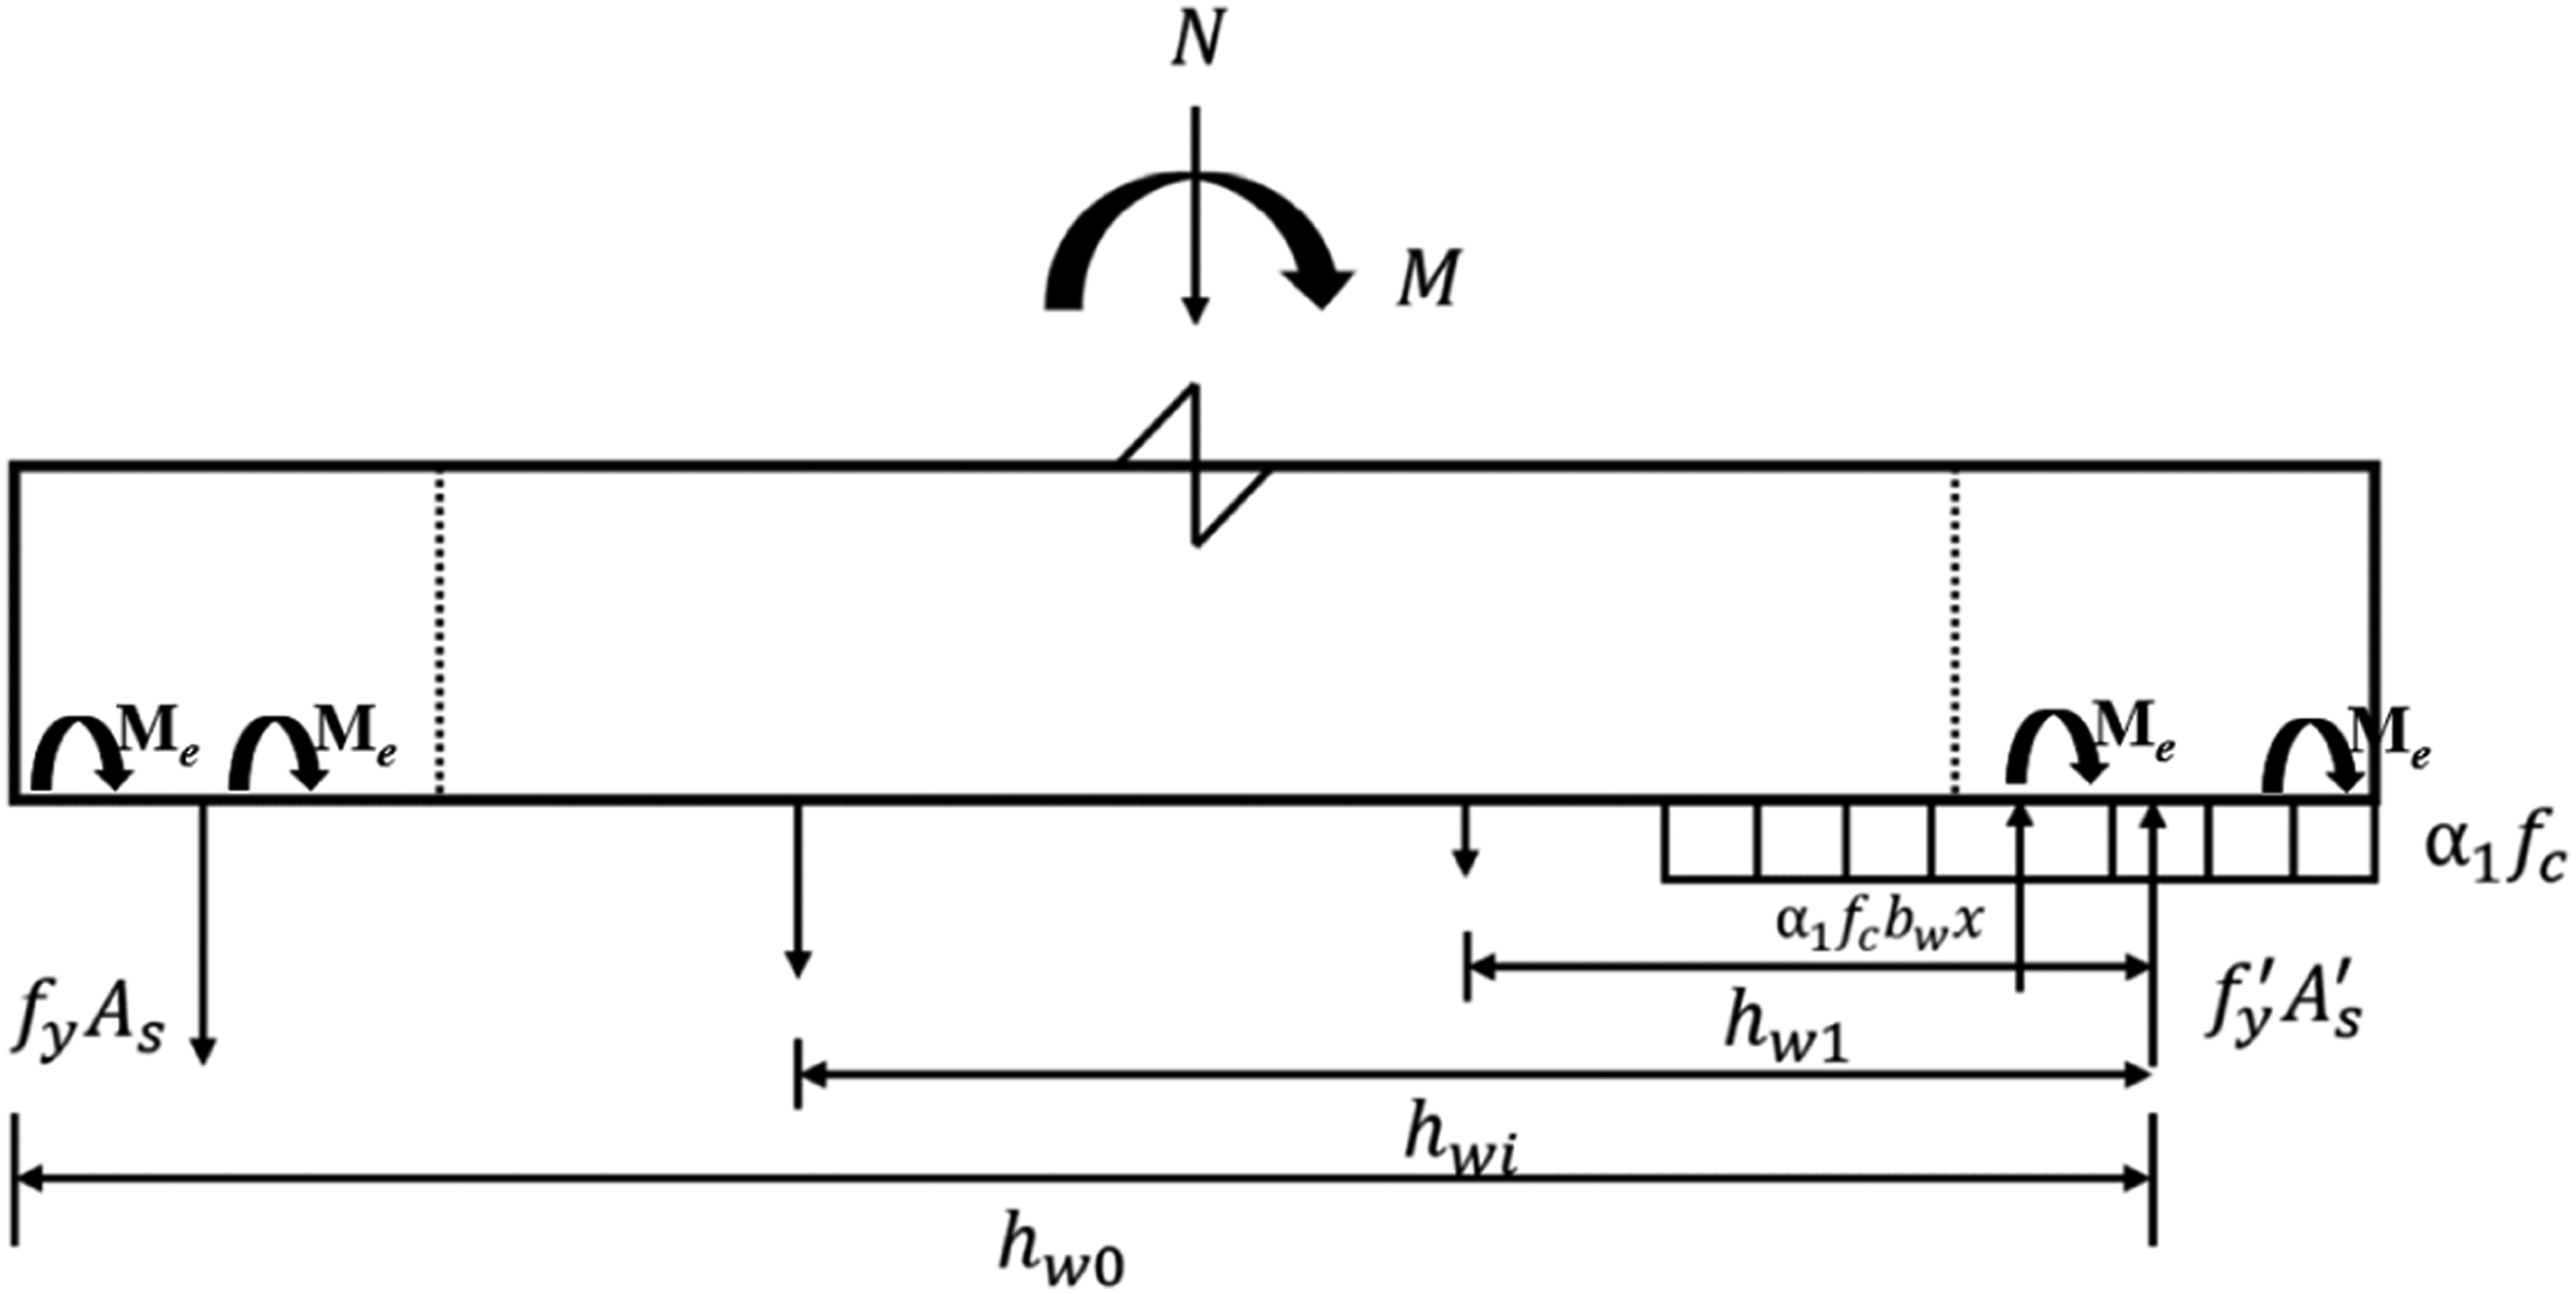
The calculation method in this paper is partially adjusted based on the design method of the specification TCECS795-2021 (2021) by introducing the bending moment adjustment factor λ i and an eccentric bending moment of SDTCs (M e ). The lateral loading capacity calculation formula of PSWs with SDTCs (F sw ) is shown in formula (3)–(13).
When x ≥ 2a
s
’, the area of the concrete compression zone is large, and the tensile effect of the distributed reinforcement is small. Therefore, the tensile action of the distributed reinforcement is not considered, and the eccentric bending moment of the SDTCs is considered. Only the eccentric bending moment effect of the end of shear wall SDTCs is considered, as the vertical reinforcement stress in other places is small.










N: Axial force of shear wall.
H: Distance from the point of action of the lateral force to the bottom of the shear walls.
x: Height of concrete pressure zone.
e: Distance between the centers of the two steel pipes of the SDTCs.
f yi : Design values for tensile strength of vertical reinforcement for pair i.
A si : Total cross-sectional area of vertical rebars with connections for non-structural column areas.
h wi : Distance of vertical reinforcement pair i from the neutral axis of the structural column at the compression end.
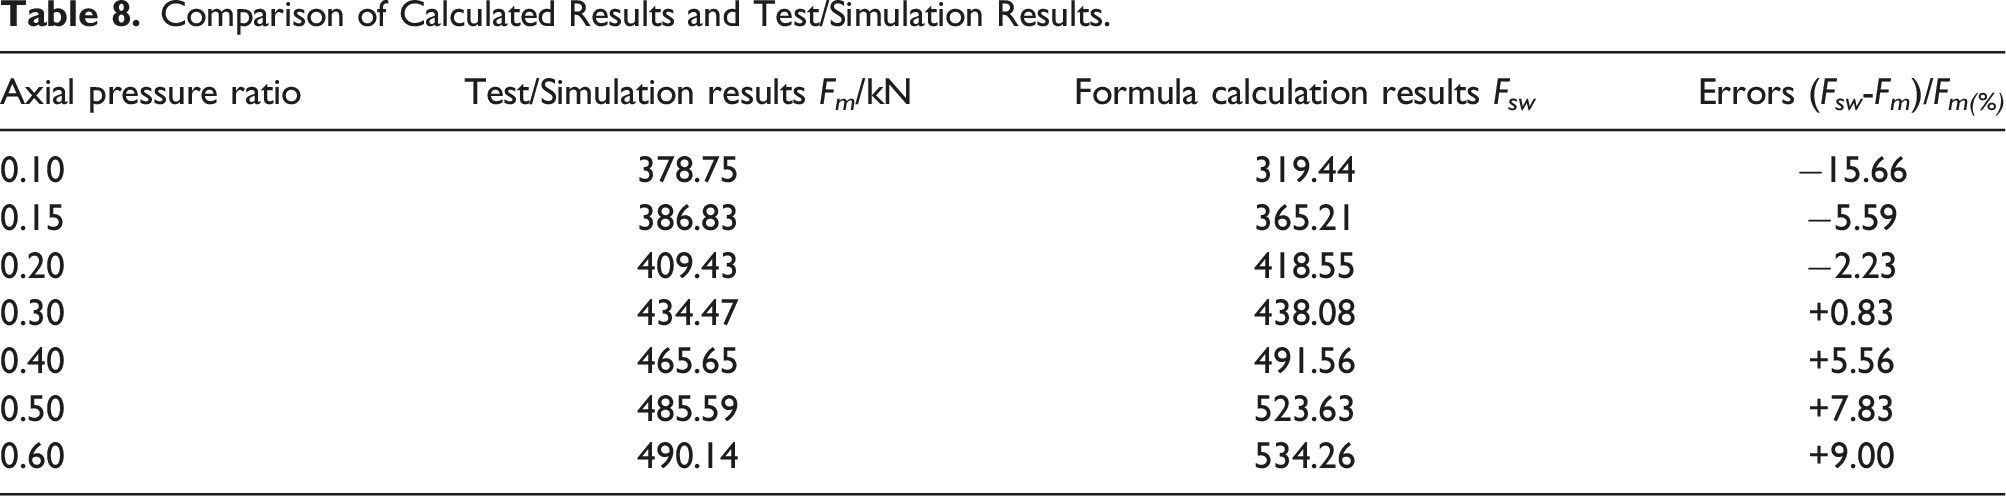
Comparison of Calculated Results and Test/Simulation Results.
Conclusions
Two novel shear walls with different axial compression ratios were experimentally investigated. At the same time, the models with axial pressure ratios in the range of 0.1–0.6 were established for nonlinear finite element analysis. Finally, the mechanical study of PSWs with SDTCs was completed, and a method for calculating the lateral loading capacity of the new kind of PSWs was offered. The following conclusions can be draw: 1. The specimen SW-6-200-0.2 with a higher axial compression ratio had higher carrying capacity and better seismic behavior than SW-6-200-0.1. The failure mode of the SW-6-200-0.1 and SW-6-200-0.2 were the same, both of which were bending failures. Two specimens were damaged due to the crushing of concrete at the edges and the yielding of rebars. 2. The carrying capacity and stiffness of the models gradually increased as the axial compression ratio raised, but the decreasing trend of force–displacement curves were also more distinct. In particular, when the axial compression ratio exceeds 0.4, the load-displacement curve of the models shows a significant drop segment after the peak point. Consequently, the recommended value of axial pressure ratios should not exceed 0.4. 3. Some of the SDTCs reached the yield stage but fail to reach the ultimate stress as the axial compression ratios raised from 0.1 to 0.6. The reinforcement stress connected by the SDTCs increased as the axial compression ratios raised, and the SDTCs can still effectively transmit the stress. Thus, the new type of SDTCs can be used as a reliable connection for precast concrete shear walls. 4. The error between the carrying capacity obtained by the newly proposed new shear wall lateral force calculation method and the results obtained from tests/simulations were within the allowable range. Therefore, this calculation method can be used to evaluate the lateral loading capacity of the proposed shear wall with SDTCs.
Footnotes
Declaration of conflicting interests
The author(s) declared no potential conflicts of interest with respect to the research, authorship, and/or publication of this article.
Funding
The author(s) disclosed receipt of the following financial support for the research, authorship, and/or publication of this article: This work was supported by the National Natural Science Foundation of China (Grant nos. 52127814 and 52078280).
