
Abstract
The girder bottom inspection is becoming an important part of the bridge maintenance process. In this study, a vehicular defect identification system was built to make the inspection process of bridge bottoms more intelligent, efficient and accurate. The system contains three main parts: image acquisition, image stitching and defect recognition. The image acquisition part was responsible for controlling the start and stop of image acquisition, data transmission and image storage. The image sequences collected were processed and stitched into a panoramic image during the image stitching process, and the coordinate systems of images would also be unified. Finally, the defects in the image were recognized and positioned. Combined with the BIM model, multiscale digital display of bridge bottom defect, including defect recognition and positioning results, was obtained. With the multiscale information, the maintenance for bridges will become more convenient. The deep learning model U2-Net was used to detect cracks and realized a defect detection accuracy of millimeter-level. The experimental results proved that the cracks in the images of the bridge bottom could be detected effectively using the proposed method with a high performance of 79.15 % test dataset F1-score and 0.691 MIoU. Additionally, the proposed defect location method had a centimeter-level defect location accuracy.
Introduction
The surface defect inspection of bridge structure is an important part of bridge maintenance. Figure 1 is a statistical diagram of bridge data in China and the USA (MTPRC, 2021). As it shown in the figure, the total number of bridges in China and the USA are extremely large. The era of large-scale management of highways and bridges are close. Number of bridges in China and the USA.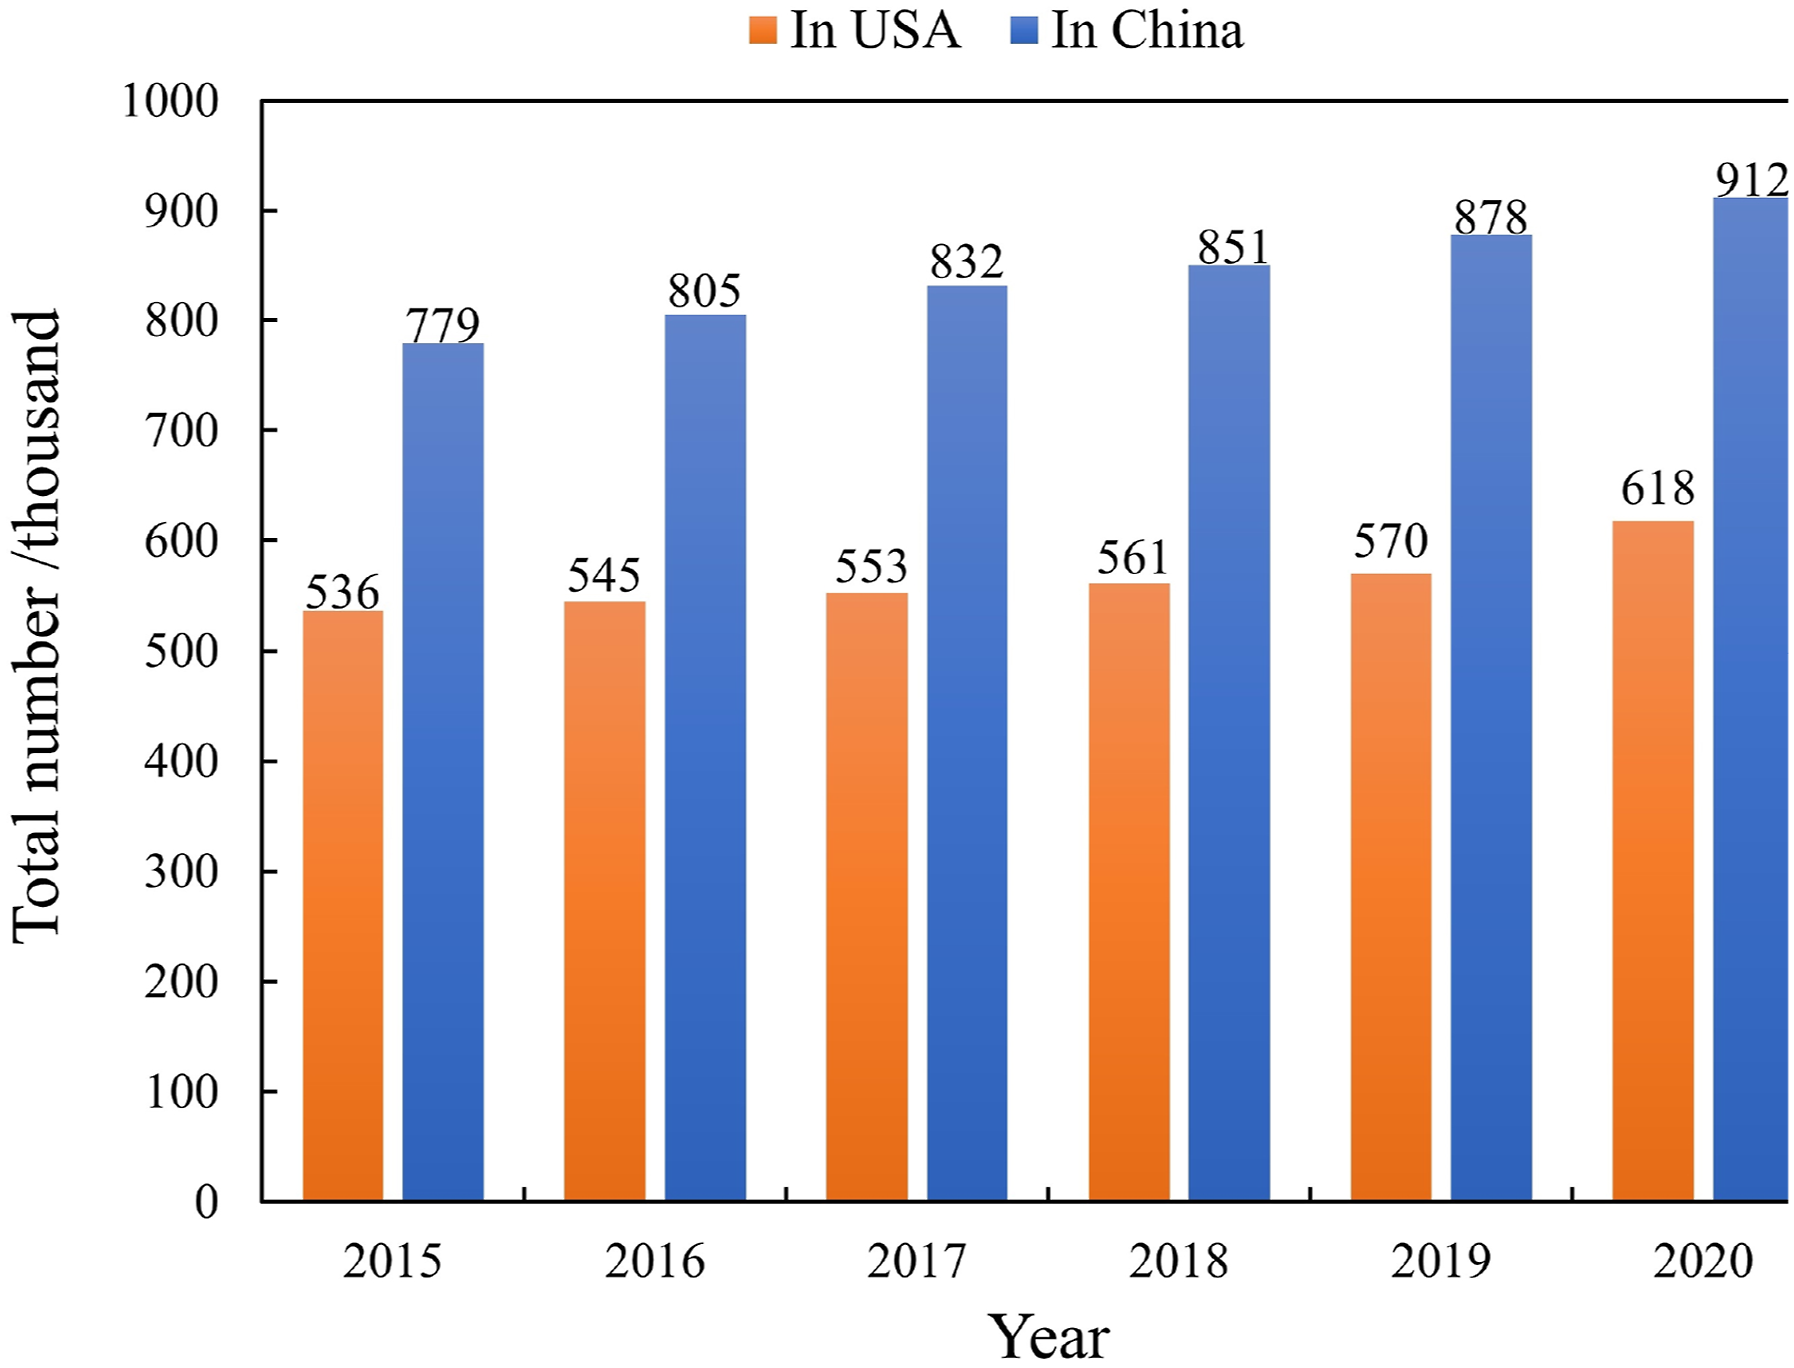
In the long-term service process, the safety of bridges will be affected by various factors (material aging, environmental erosion, overload operation, natural disasters, etc.). These factors will inevitably lead to structural damage and disappointing service performance. As shown in Figure 2, the Qianjiang box girder bridge in Zhejiang, China, collapsed due to concrete structure defects and poor supervision. Detect inspection and reinforcement are important means to ensure the safety and longevity of bridges in service. However, traditional inspection and evaluation methods still have limitations. Collapse of a box girder bridge in Zhejiang, China.
The bridge inspection methods can be divided into three categories: manual detection, vehicle-based detection combined with manual observation and vehicle-based detection. Human inspection uses telescopes to observe bridge bottom defects from a distance. Due to the irregular distribution of defects on the bottom surface of girder, the recorded defect data are greatly affected by environmental and human factors. The vehicle-based detection method usually carries relevant measurement equipment on the mechanical arm of the vehicle. The defect images can be captured by the cameras to carry out comprehensive inspection of the bridge bottom surface, which improves the efficiency and accuracy of the measurements. Therefore, building an economical, portable, and highly integrated bridge bottom defect inspection system will greatly eliminate the difficulties encountered by manual detection and improve the comprehensiveness, safety, and measurement efficiency of bridge bottom defect detection.
At present, some research progress has been made. A bridge management company in Hunan, China, designed the BIR-X vehicle-based bridge intelligent detection system (Xie et al., 2018), as shown in Figure 3. The bridge inspection vehicle had a mechanical arm, which was equipped with 2 or 3 cameras to collect images of the bottom surface of the girder. Due to the limitation of field of view, the image information obtained was discontinuous. Also, the apparent information of the whole section at the bottom of the girder and the accurate location information of the defect could not be intuitively obtained. Additionally, the price of the equipment was extremely high. Traditional inspection methods.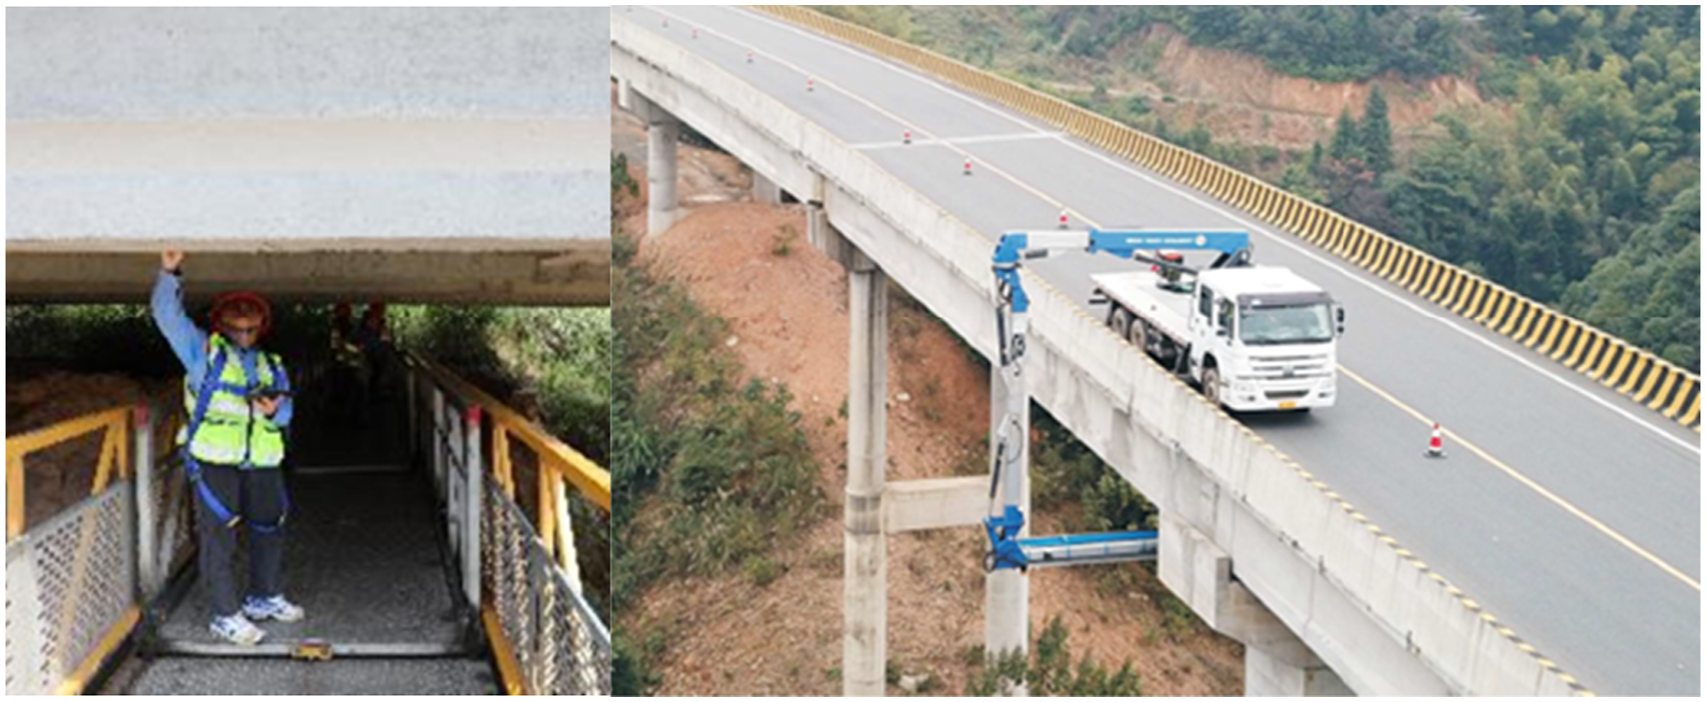
Image stitching technologies were used to obtain more intuitive information of the whole regions of the girder bottom in this study. With the development of digital photography technologies and computer technologies, image stitching technologies have been widely used in civil (Xie et al., 2018), medical (Ritter et al., 2011), aviation (Wang et al., 2017) and other fields. Image stitching technologies mainly include image registration and image fusion. In the field of image registration, the matching methods are mainly based on the frequency domain, region, and feature. Feature-based image matching has the advantages of high robustness and high speed and is a research hotspot. Moravec et al. (1981) first proposed the concept of points of interest. Harris and Stephens (1988) improved the algorithm proposed by Moravec. The Harris operator has the advantage of good rotation invariance and illumination invariance. Image fusion mainly includes image space transformation and overlapping region fusion. Image space transformation projects the images to be spliced into the same plane and aligns overlapping areas to form a panoramic image. Szeliski et al. (1996) proposed the LM (Levenberg Marquardt) algorithm, which improved the quality of panoramic images after stitching by fast convergence. Brown and Lowe (2007) proposed the automatic stitching technology ‘AutoStitch’ based on SIFT features, but the panoramic image was not natural, and the image edge was sometimes distorted. Zaragoza et al. (2014) proposed a stitching method of APAP (as-projective-as-possible image switching with moving DLT). Through the studies of many scholars, image splicing technologies have gradually matured. However, maintaining a balance between the quality and the speed of image stitching is still a key problem for application in the real field.
After the complete panoramic image of the bridge girder bottom is obtained, the identification of defects needs to be performed. Image processing technologies (IPTs) and deep learning methods (DLMs) (Cui et al., 2021) are the main means to complete the task (Chaiyasarn et al., 2021). The IPTs are mainly based on the edge and depth characteristics of the defects (Abdel-Qader et al., 2003; Cha et al., 2017; Lim et al., 2014; Subirats et al., 2006). Abdel-Qader et al. used fast Haar transform, fast Fourier transform, Sobel operator and Canny operator respectively to identify cracks in 50 images with a resolution of 640 × 480. The results showed that the accuracy of fast Haar transform (86%) is higher than that of Canny operator (76%), Sobel operator (68%) and fast Fourier transform (64%) in the fracture recognition experiments, but these experiments do not provide quantitative basis for the selection of threshold. Recently DLMs have been proved to have greater robustness and generalization compared to IPTs. Huang et al. (2018) used FCN to detect cracks in tunnels which could achieve rapid detection and accurate positioning of cracks by DLMs. Hou et al. (2020) proposed a transfer learning model based on Mask RCNN for cable defect identification. Yamane et al. (2023) proposes a method to integrate and record the damage detected from multiple images into a 3D model using deep learning to detect the damage from bridge images and structure from motion to identify the shooting position. Aiming at defects such as cracks and delamination of infrastructure, Savino and Tondolo. (2023) suggested a universal semantic segmentation network adapted to different image qualities, resolutions, and backgrounds based on DeeplabV3+. However, many studies only focus on defect identification. For practical application, the location of the defect relative to the whole surface of the girder bottom to be detected is also an important part of structure defect detection.
Inspired by the BIR-X vehicular bridge intelligent inspection system (Xie et al., 2018), an economic, lightweight, and highly integrated bridge bottom defect detection systems was built in this study. The Harris corner and simplified SIFT feature description methods were used for stitching of bridge girder bottom images. With deep learning technologies, the defects on the surface of the bridge bottom were identified. A global-local defect positioning method of a multiscale map was established. Combined with BIM technologies, visualization of the defect results were achieved. The detection system and method established in this study can be regularly applied in practical engineering to detect and locate apparent defects of the girder bottom, and holds significant importance for bridge safety assessment.
The content of this study is mainly divided into the following parts. The second section mainly introduces the construction process of the vehicle mobile bridge girder bottom defect identification system. The core technology of the system, including the principle of image stitching, defect recognition and defect location, is introduced in the third section. In the fourth section, the system is applied to actual highway bridge girder bottom defect detection, and the measurement results are analyzed. Additionally, the advantages and disadvantages of the system are discussed. The fifth section summarizes the study and points out the difficulties for further study.
The design of a vehicular defect identification system
The design principle of the vehicle-mounted mobile bridge girder bottom defect recognition system is shown in Figure 4. The hardware part includes the bridge inspection vehicle, U-shaped mechanical arm, cameras, flashes, mechanical installation components, transmission system and distribution box. The software includes three parts: a camera synchronous acquisition system, an image mosaicing system and a defect recognition system. Flowchart of the proposed method.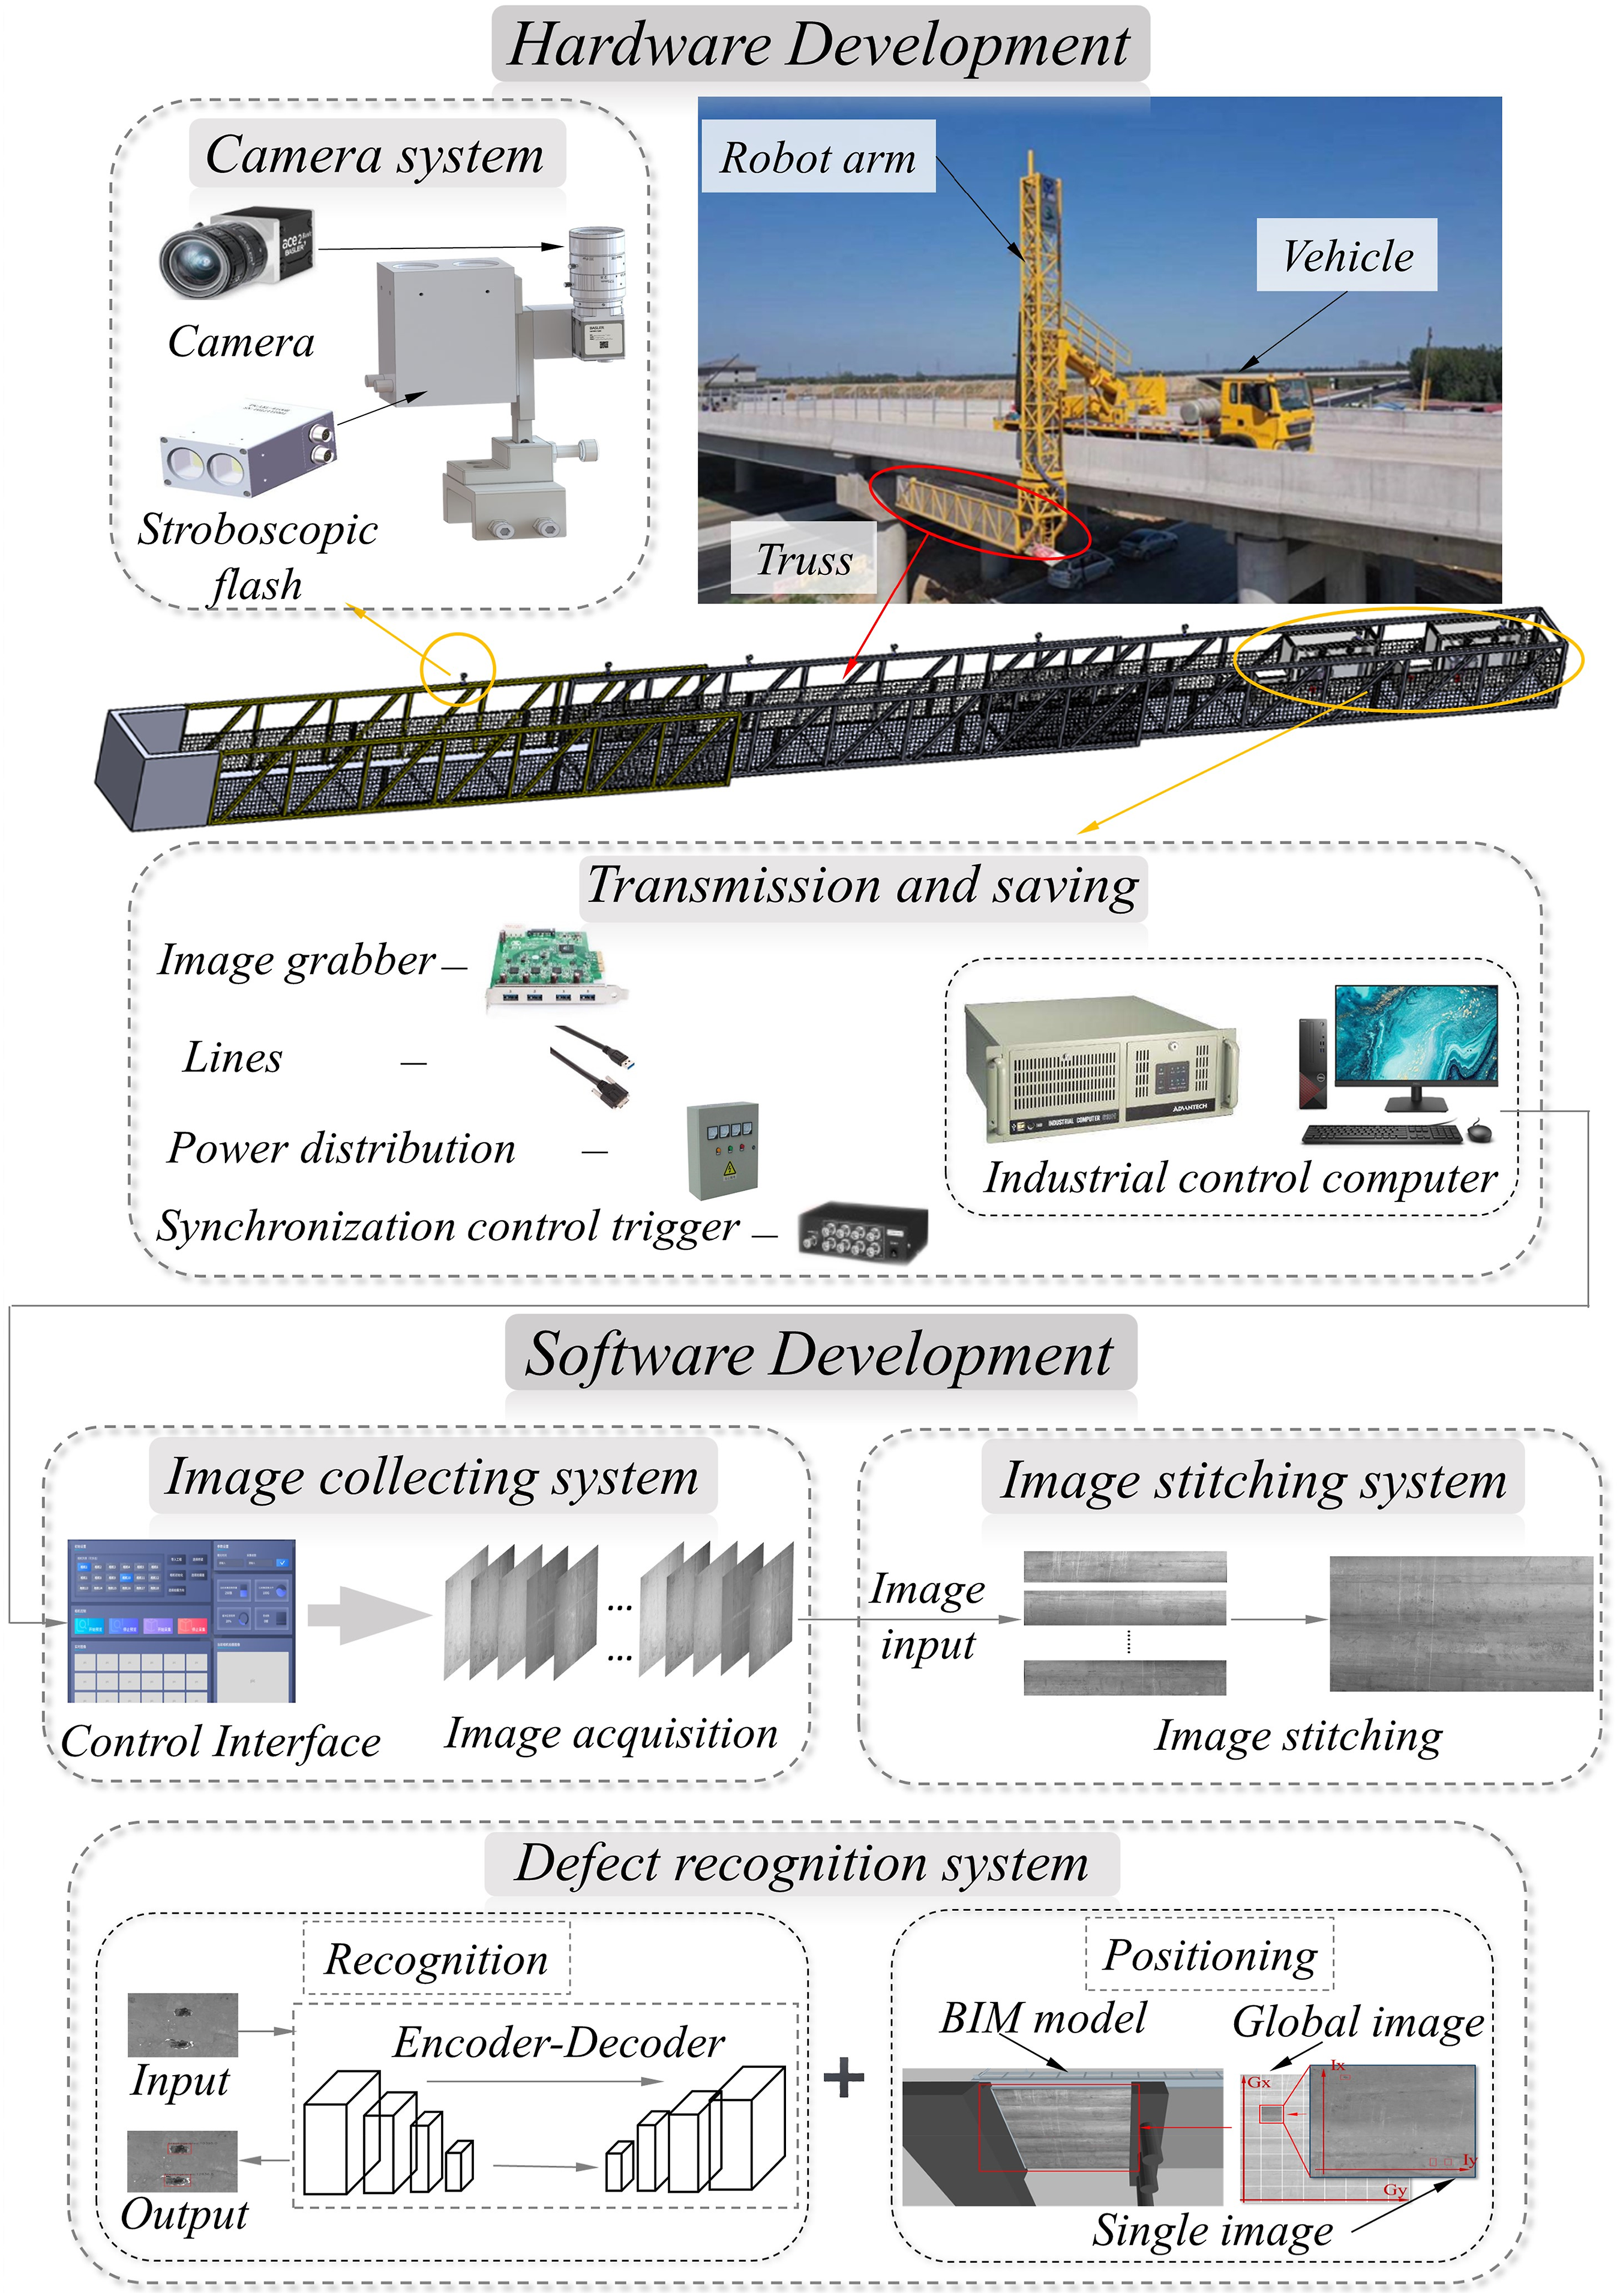
The bridge inspection vehicle carried a mechanical arm and drove at a uniform speed of 0.5 m/s. One span of the bridge was set as an example, and the bridge inspection car was located at the starting position. The robotic arm was controlled to reach the bottom of the bridge. Image acquisition started before the vehicle moved. The bridge inspection vehicle was driven at a constant speed in a relatively straight line until the end of the span. Then, bridge girder bottom image acquisition for the span was completed. After all the images were collected, the panoramas of the girder bottom were stitched and pasted on the surfaces of the BIM model. Finally, local defect identification and defect location were carried out to obtain detailed information of defects.
Methodology
The main technologies of the vehicle-mounted mobile bridge girder bottom defect recognition system are the image stitching method, defect recognition technology and defect location method. This chapter will introduce the technologies in detail.
Image stitching process
The principle of the image stitching method is shown in Figure 5. Original images were screened and imported into the image mosaicing system. The mosaic of two images is taken as an example. Considering the actual onsite operational environment is complex and significant noise interference exists, the median filter (Hwang and Haddad, 1995) was used to denoise the images first. Then, the grayscale of the images was adjusted by gamma correction (Guo et al., 2004) to obtain the processed images. Second, the Harris corner recognition algorithm was used for feature recognition of the images. Feature points were only extracted from the original images, and the adaptive nonmaximum suppression algorithm (Cardoso and Bernardino, 2017) was used to screen all the recognized feature points. Third, all the feature points were described, and the images were subjected to moderate Gaussian blurring. Setting the feature point as the center, the region of a certain pixel was sampled to generate a high-dimensional normalized vector, which was used as the feature descriptor of the feature point to complete the description of all the extracted feature points of the two images. Fourth, the random sample consensus (RANSAC) algorithm (Fischler and Bolles, 1987) was adopted to extract a certain number of feature points from the first image each time. The corresponding paired feature points were searched in the second image using the feature descriptors. Then, the homographic matrix of the second image relative to the first image was calculated, and the number of paired points was counted. This step is repeated many times to obtain the homographic matrix with the largest number of corresponding pair points. This calculated homographic matrix was the final perspective transformation matrix. Finally, according to the optimal perspective transformation matrix, the overlap area was aligned, and linear fusion was used to complete the natural transition of the overlap area. The principle of the image mosaicing method.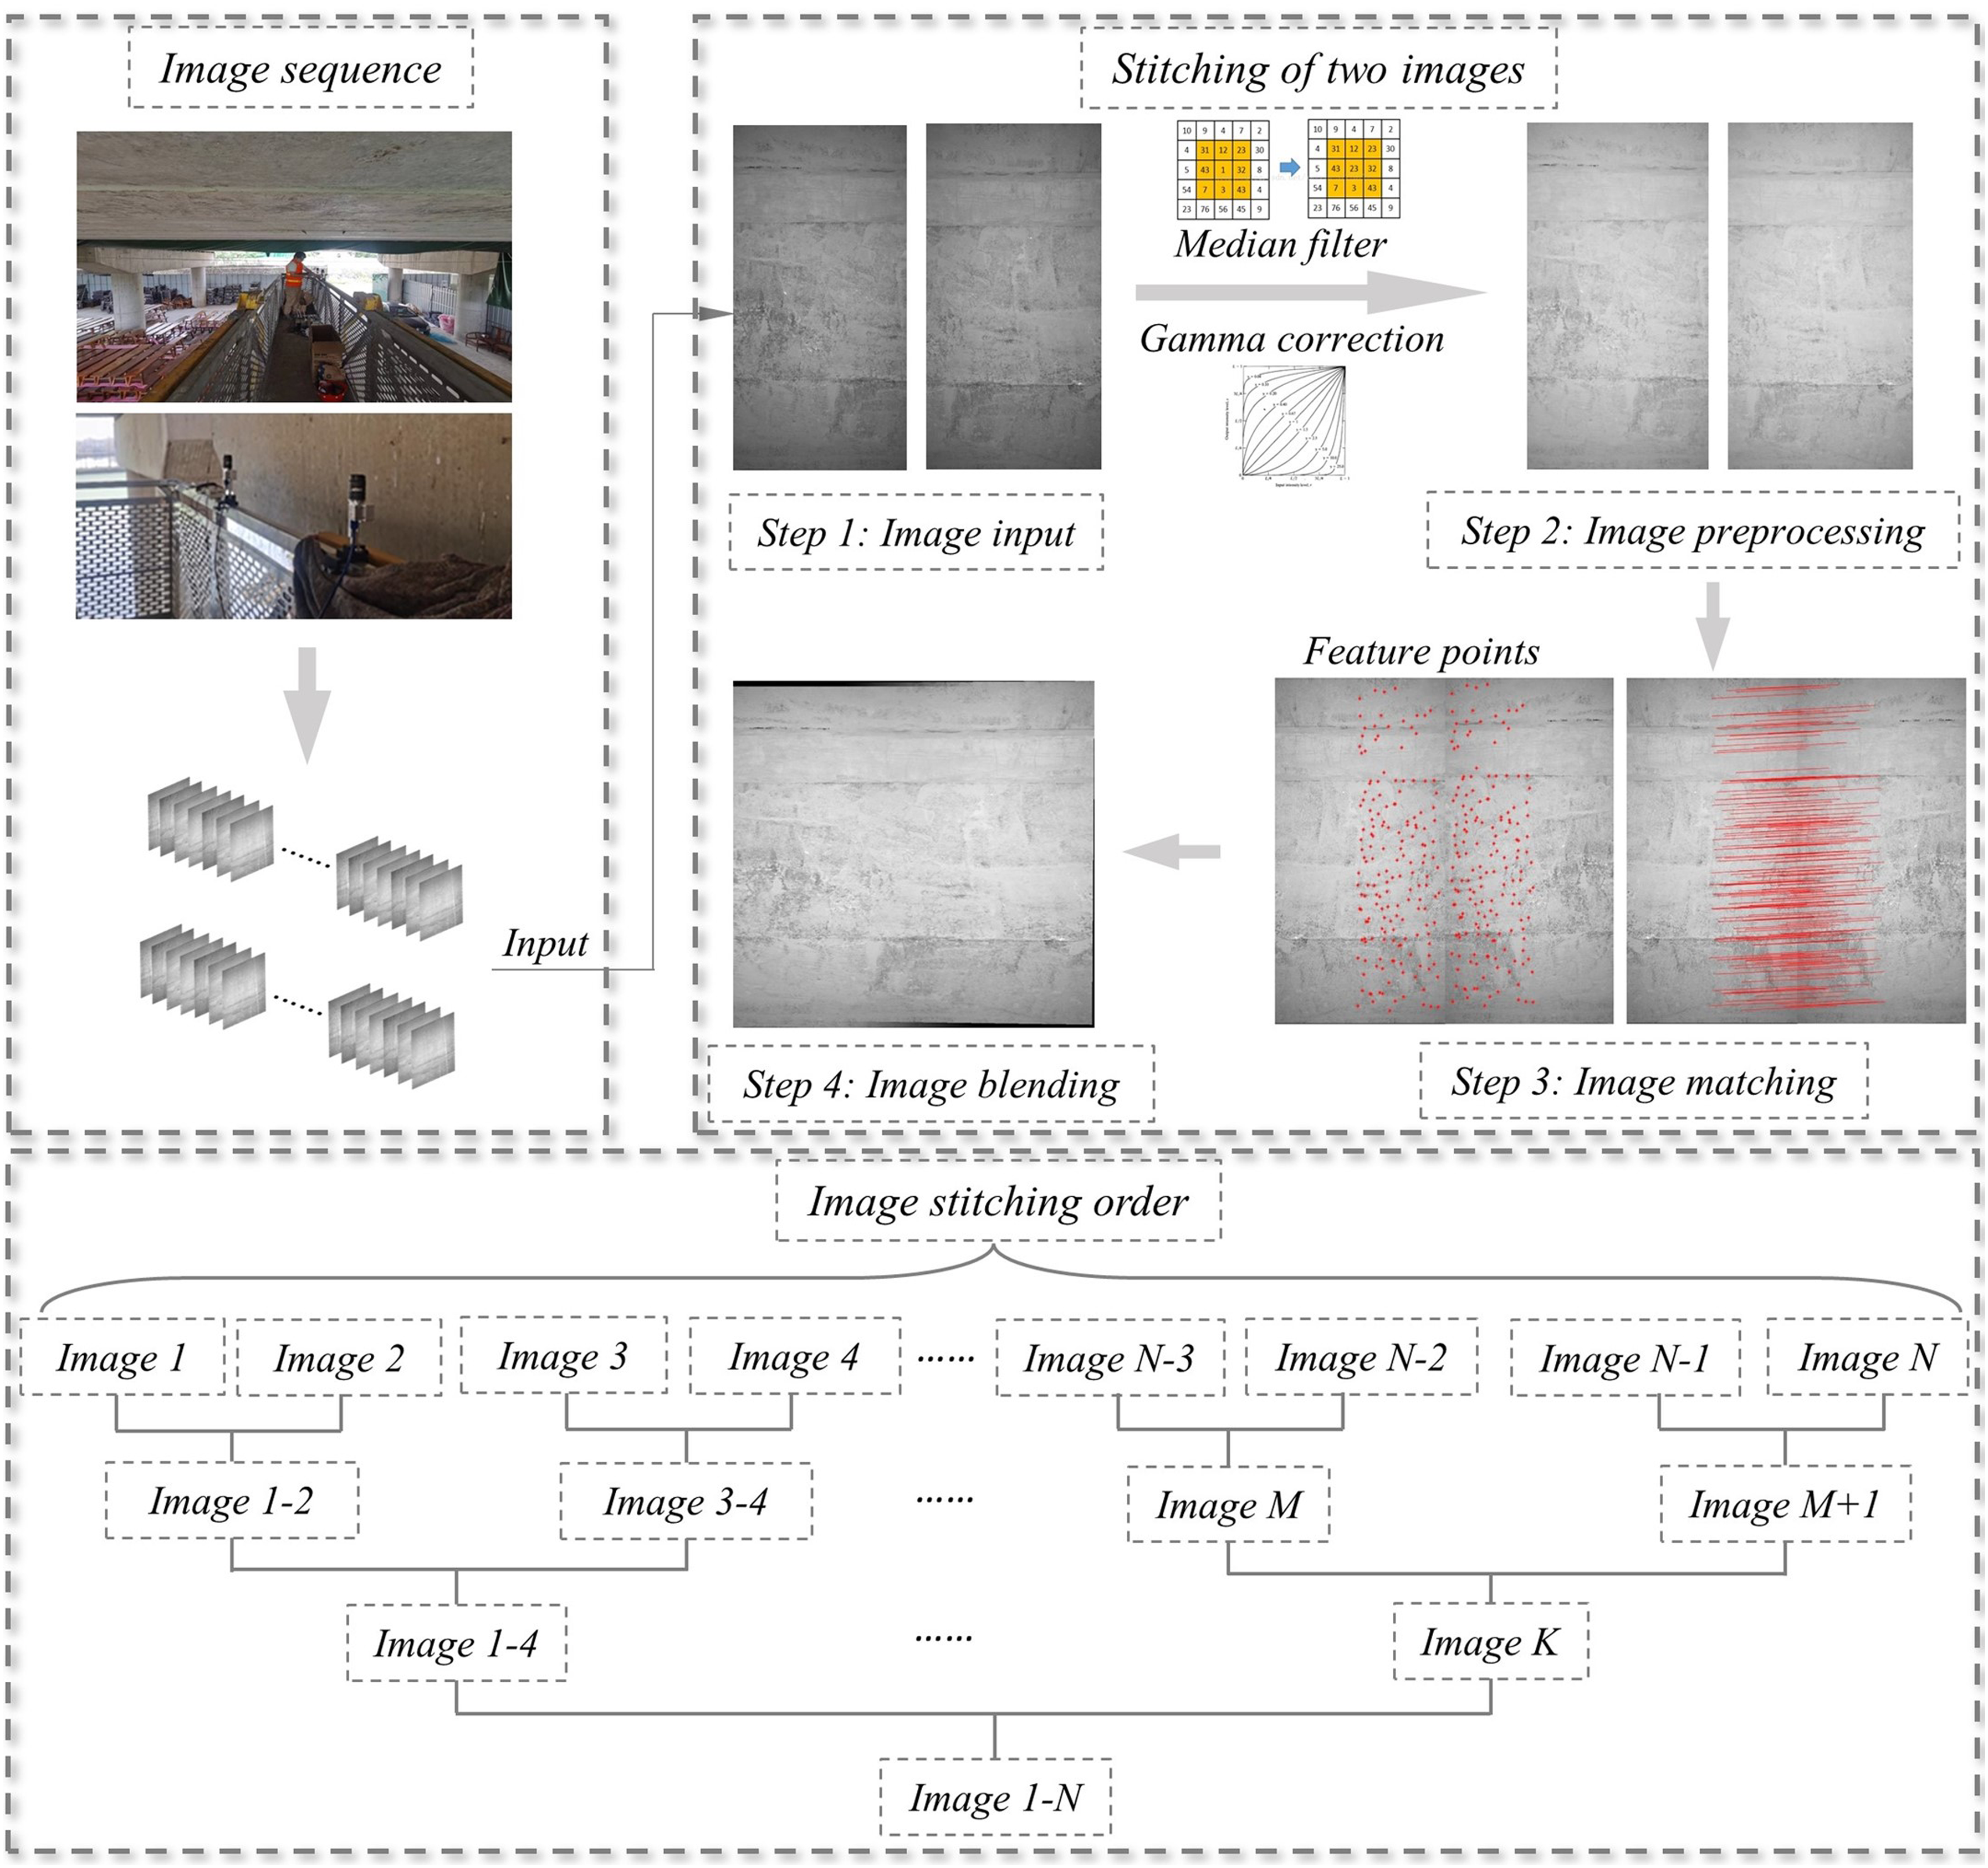
Image fusion
The Image fusion step is divided into image spatial change model building and overlapping region fusion. The image space transformation model is a geometric transformation model that fits the two images with overlapping areas. The purpose of image fusion is to achieve smooth transition of overlapping areas of panoramic images and satisfy the continuity and consistency of vision. In this study, the linear fusion method with simple steps and fast computing speed was adopted.
Linear fusion mainly includes direct mean fusion and weighted mean fusion. The gray values of the corresponding pixels in the overlapping region are first summed and then averaged, and the calculated results are used as the gray values of the fused pixels, as shown below:
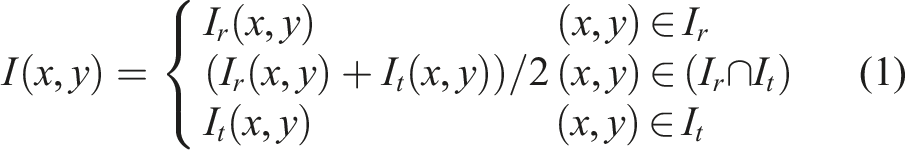
Weighted average fusion improves direct average fusion by first weighting the gray values of the pixels in the overlapping area and then summing the average:

Weighted average image fusion usually only adjusts the brightness of the overlapping area to make the local overlapping area transition naturally. However, when the number of sequence images is large, the display of all local transitions in the final panoramic image will become very unnatural. In this study, the gray histogram statistics of all the input sequence images were calculated before mosaicing the image, as shown in Figure 6. The average gray histogram was used to adjust the image brightness to obtain the uniform adjustment of the brightness of the global panoramic image after mosaicing all the sequence images. Before and after global brightness adjustment.
Image evaluation
Different algorithms were compared by subjective evaluation and objective evaluation. Subjective evaluation mainly relies on the observer’s vision to evaluate the panoramic image quality based on established standards, so there are some limitations in the evaluation (Wang and Bovik, 2002) of image quality. Objective evaluation can obtain an image quality index by establishing a mathematical model or calculation formula. The image entropy, mean gradient, peak signal-to-noise ratio (PSNR) (De Boer et al., 2003), standard deviation, image mutual information and cross entropy are used to objectively evaluate the local overlapping areas in panoramic images.
Principle of defect identification
Semantic segmentation networks usually take VGG (Guo, 2021), AlexNet (Krizhevsky et al., 2017), and LeNet-5 (Lecun et al., 1998) as backbones. However, the above backbones lack sufficient feature extraction because they are relatively shallow compared to modern architectures. The shallower architectures may not have enough layers to effectively capture intricate features, particularly in scenarios where the features are subtle or occupy a small proportion of the input image.
In this study, the nested U-shaped U2-Net model proposed by Qin et al. (2020) was applied to detect girder bottom defect. As shown in Figure 7, the network mainly consists of residual U-blocks for extracting multiscale features in stages and outer structures connected with RSU. This network can be trained from scratch to obtain excellent results without transfer learning (Zhang et al., 2018), extract multiscale features more effectively, and improve the depth of the network to obtain high-resolution images without increasing computing costs (Qin et al., 2020). Architecture of the U2-Net neural network for segmentation of girder bottom defect.
The U2-Net network typically takes the final generated feature image as the output; thus, the generated image value is regarded as the predicted value to calculate the loss compared with the label value of the real image. As bridge bottom defect occupies a small proportion of the background in the whole image (Ye et al., 2019) and the number of negative samples is large while the number of positive samples is small, focal loss is used as a part of the loss function (Lin et al., 2020). The equation is shown as follows:

The accuracy, precision, recall, F1-score and mean IoU are used to measure the difference between the predicted images and the real images and evaluate the performance of the U2-Net model (Chen et al., 2021). These metrics are acquired almost based on true positives (TP), false-positives (FP), true negatives (TN) and false negatives (FN) of the pixel classification results in image semantic segmentation.
Sequence image stitching and defect location
For multiple sequence images stitching, it is common to stitch images one by one. During the piece-by-piece stitching, any stitching error accumulates, which will eventually lead to an increasing number of errors. If a stitching error is large, the error will be continuously enlarged, which may eventually lead to stitching failure. Via image stitching, the stitching results of the first two images are used n-1 times as the benchmark image, so the stitching error of the first two images accumulates n-1 times.
To reduce the accumulated error of the image, this study adopts the method of pairwise splicing. As shown in Figure 8, when there are 7 sequential images, the final mosaic result can be obtained through three rounds of stitching, and the error can be accumulated three times at most. In addition, the stitching process of every two images is independent. The stitching of two images does not affect each other, so the multiprocess stitching method is more efficient.The principle of defect positioning is shown in Figure 8. The pixel coordinates (I
xi
, I
yi
) of the defect in each image can be obtained through defect identification in the previous section. The first camera and the last camera of the array cameras are equipped with a GPS positioning device. The positions of the first and last images are recorded, and the real size corresponding to the length and width of the panoramic image is obtained. The principle of sequence splicing and defect location.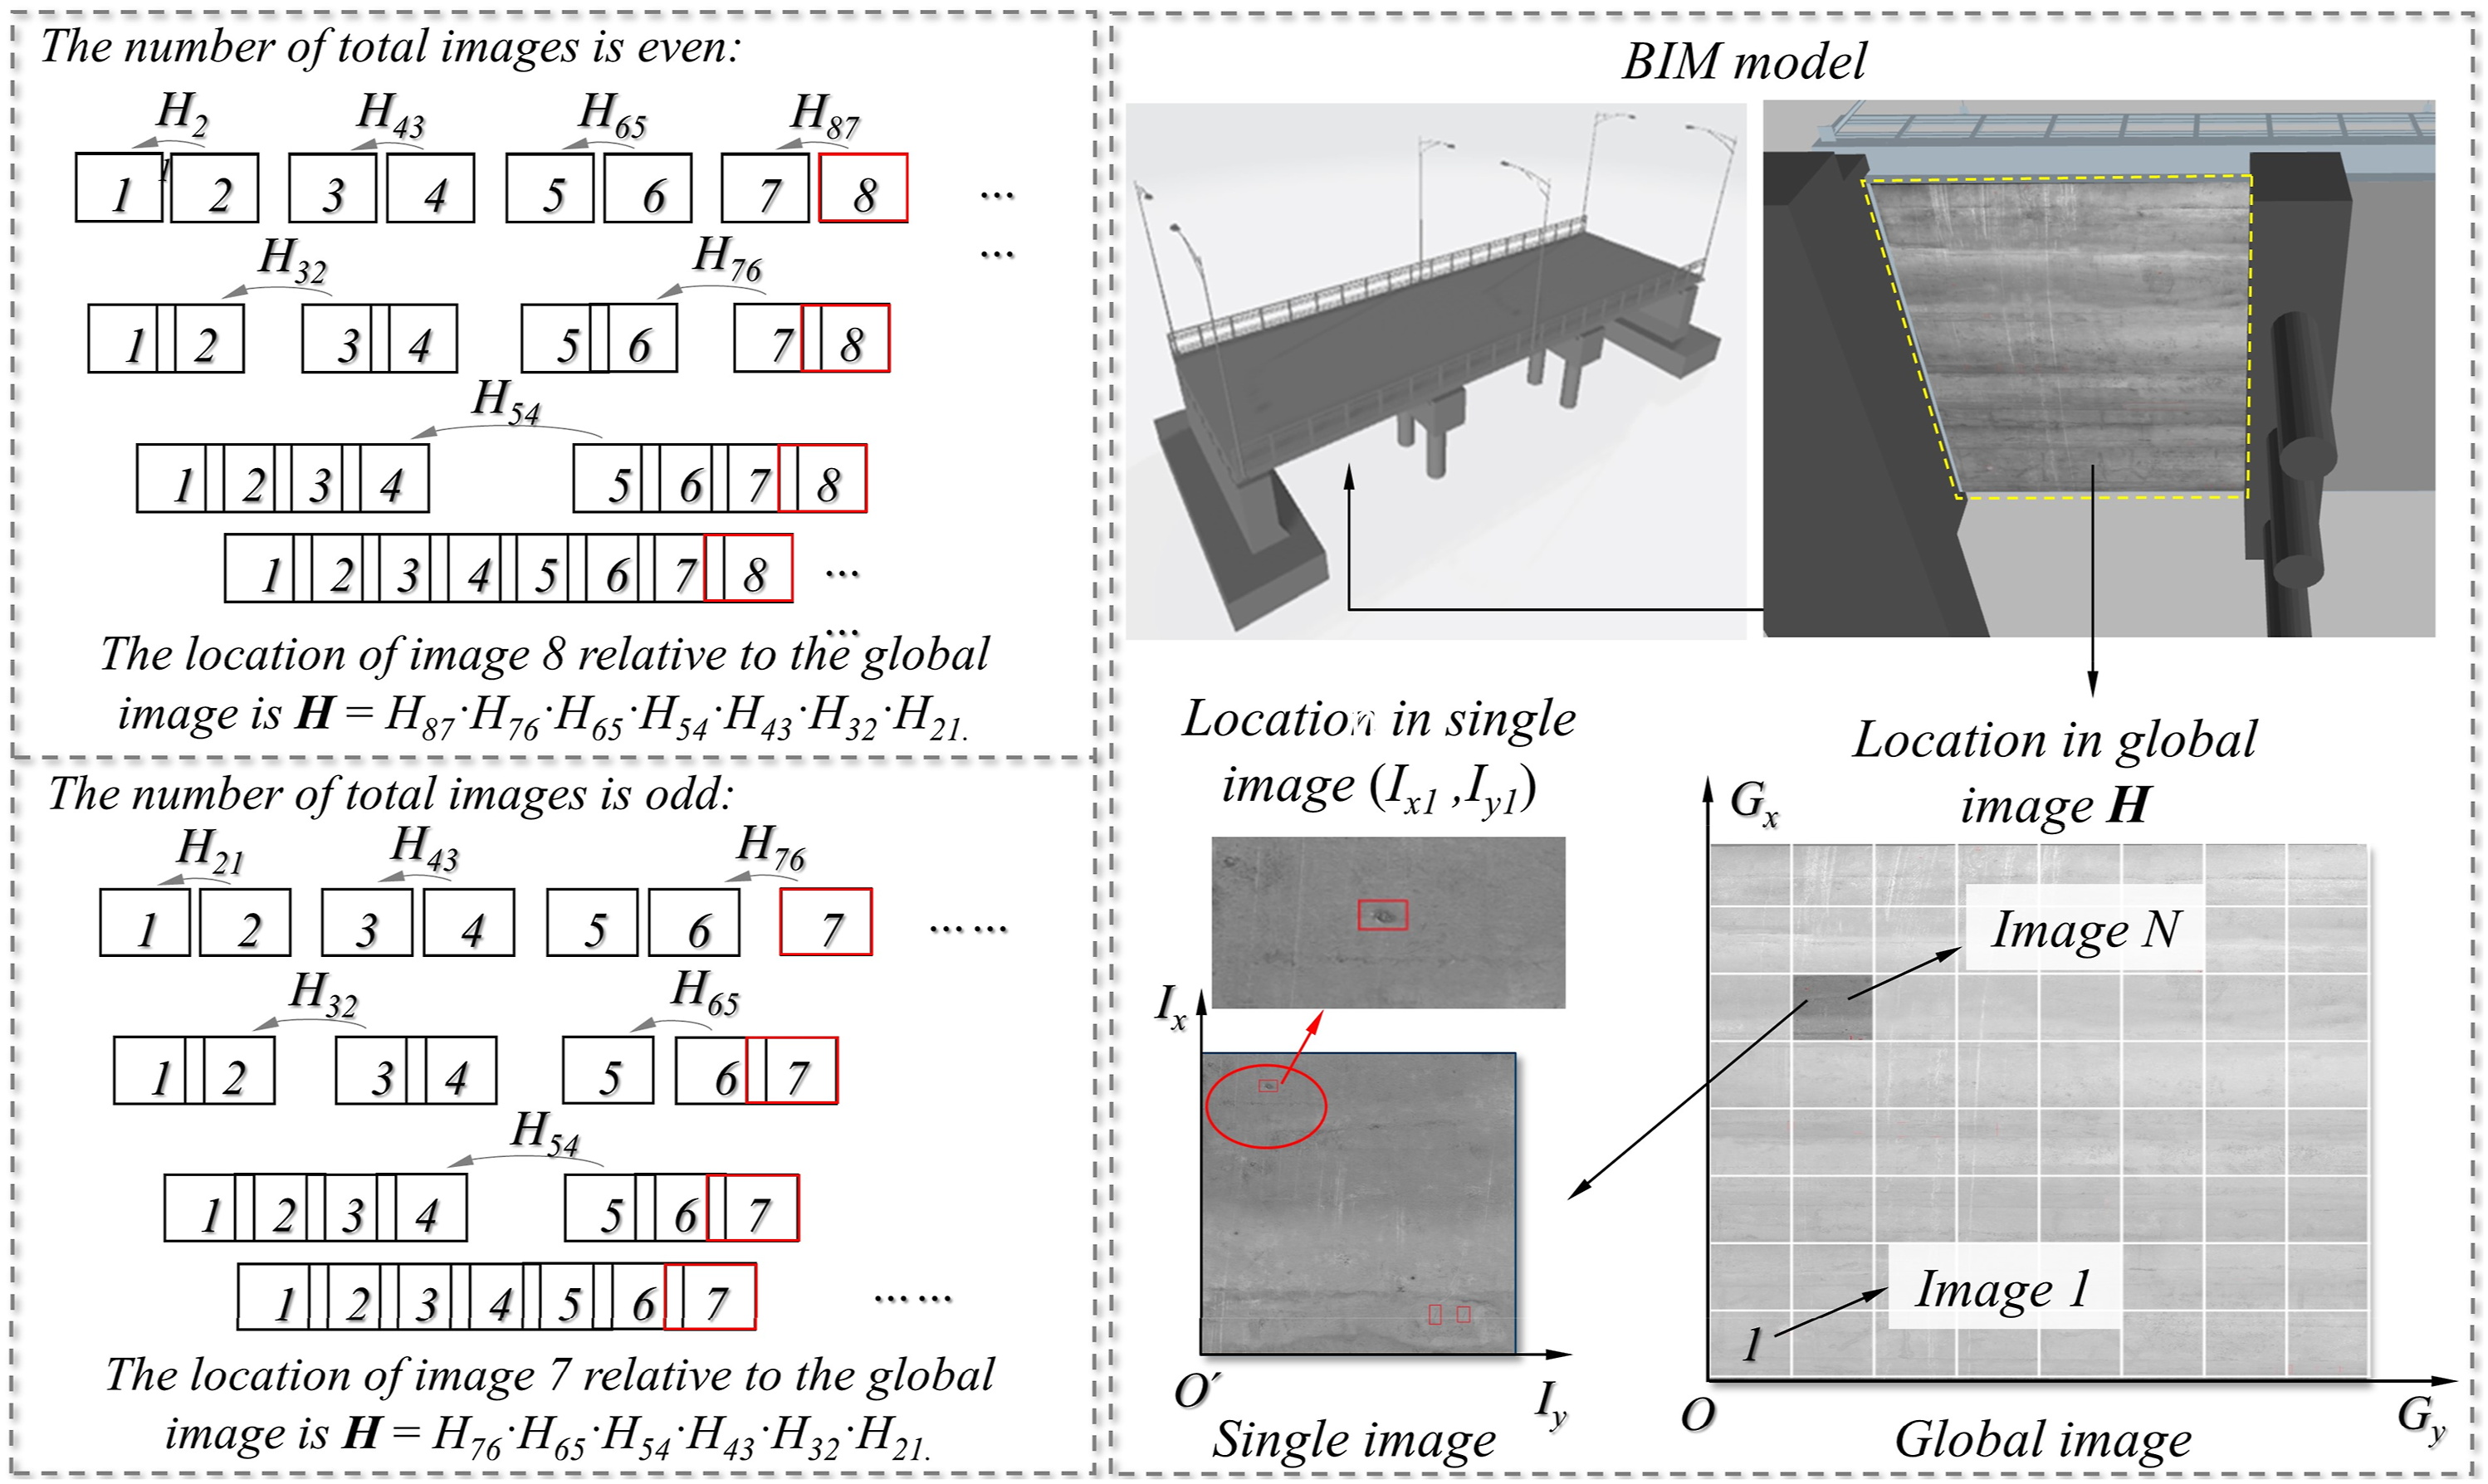
When the total number of sequence images to be spliced is even, taking 8 images as an example, the transformation matrix of the second image relative to the first image is H 21 , the transformation matrix of the fourth image relative to the third image is H 43 . All images are finally converted to the coordinate system of the first image. Finally, the transformation matrix H 81 = H 87 ·H 76 ·H 65 ·H 54 ·H 43 ·H 32 ·H 21 of the 8th image relative to the first reference image can be calculated, so the position of the defect (I x8 , I y8 ) on the 8th image on the panoramic image is the product of the pixel coordinates and the transformation matrix of the image relative to the reference image. After determining the relative position of the defect in the panoramic image, the approximate position of the defect at the bottom of the actual bridge girder can be located according to the size of the panoramic image. All identified defects are marked in the panoramic image, and their positions at the bottom of the entire bridge girder are saved for the bridge management personnel to observe the defect and reinforce the bottom of the girder later.
On-site experiments
A box girder bridge in Fujian Province, China, was selected for the on-site experiment. The vehicular defect identification system built in this study was applied to girder bottom defect detection. The implementation details, detection results and discussion of the designed system are introduced in this section.
Experimental overview
The bridge length is 120 m and divided into 3 spans. The width is 16 m, and the width of each hollow girder at the bottom of the bridge is 4 m. Eight cameras were used for the measurement, and the camera system was fixed on the manipulator at 1 m equidistant intervals. The measurement distance was approximately 2.5 m, and Basler cameras were selected with a resolution of 5320 × 3032. The measurement scheme is shown in Figure 9. Taking the measurement of the girder bottom on the left side of the central axis as an example. At the starting point of each span, the inspection vehicle started to move forward at a speed of 0.5 m per second. At the same time, 8 cameras with flashlights started to collect images together, the shooting frequency was 2 s, and approximately 30 images were collected for each span of the bridge. The above steps were repeated until all images of the bottom of the bridge girder were collected. Layout of the survey scheme.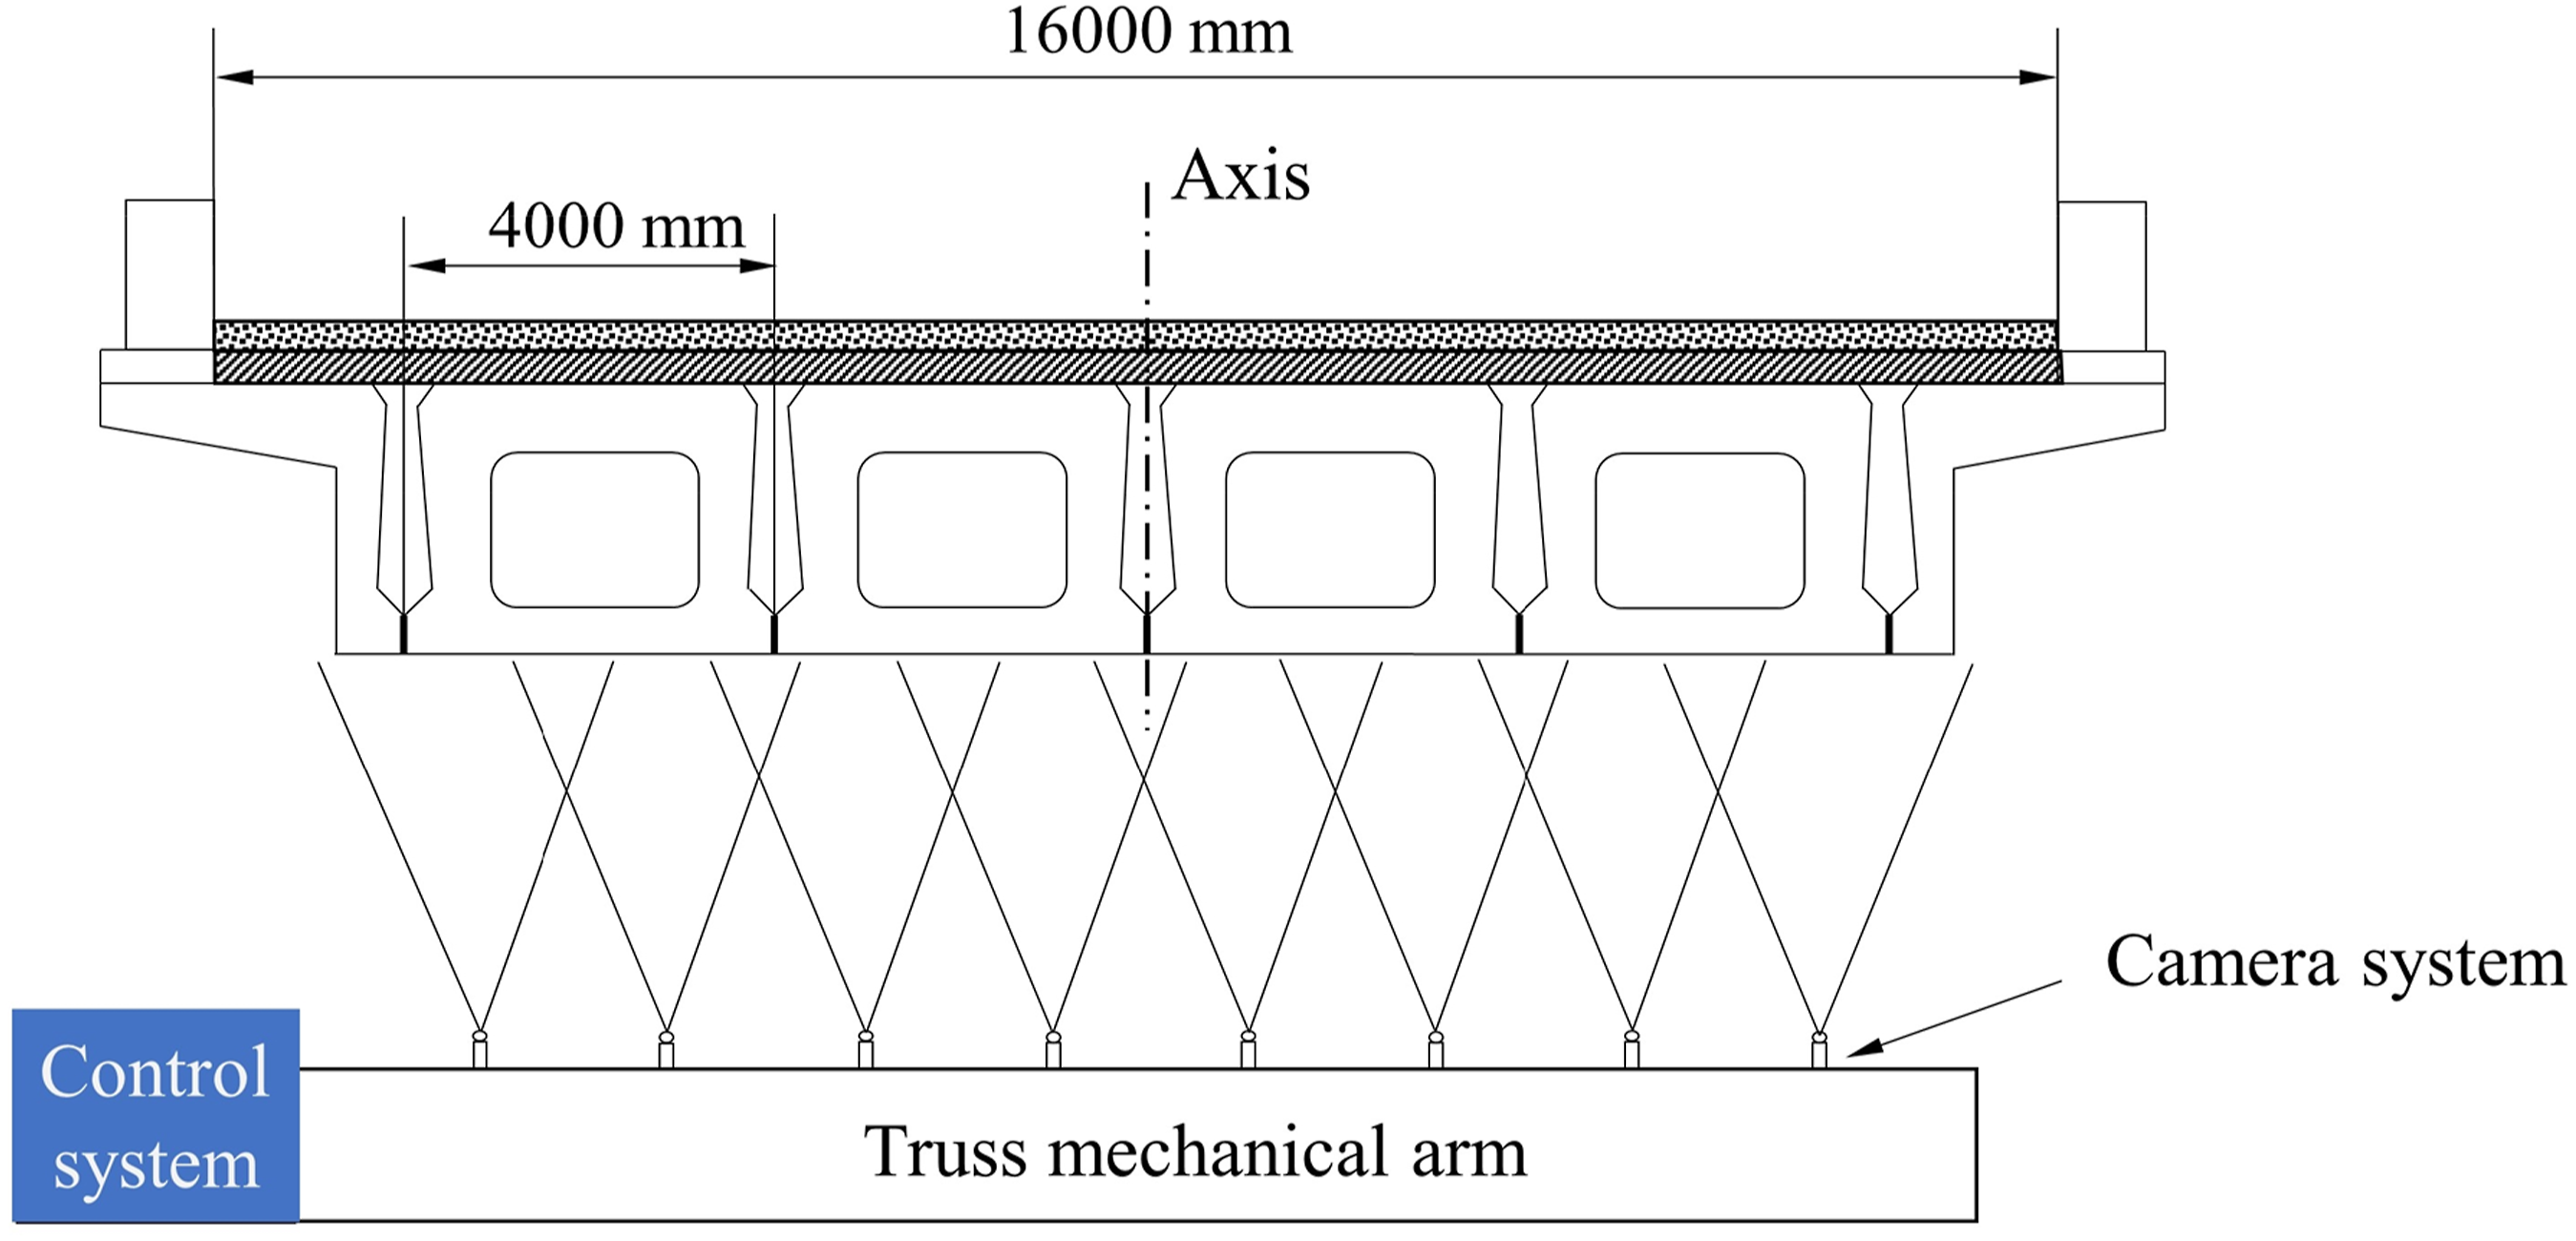
Image stitching results
The splicing results are shown in Figure 10. Figure 10(a) shows the splicing results of a single camera, and Figure 10(b) shows the overall splicing results of each span. Figure 11 shows the field test panorama and BIM map. Then, the images collected by all cameras were stitched together into panoramic images. The BIM digital model was combined with the four vertices of the panoramic image obtained according to the GPS locator, and the panoramic image was pasted at the bottom of the BIM model girder of the established bridge to obtain better visualization results. Because the overlapping area between strip images spliced by part of a single camera might not have a large overlapping field of view, the precision of partial splicing was not high in the splicing of pairwise strip images, resulting in the occurrence of black seams. (a) Stitching result of a single camera and (b) overall splicing result. Field test panorama and BIM map.

Comparison of the stitching Time.

Taking the mosaic of two images as an example, the quality of the overlapping area after mosaicing is evaluated from six aspects: image entropy, average gray level, PSNR, image standard deviation, image mutual information and image cross entropy.
Figure 12 shows the image quality results of horizontal stitching. It can be seen from Figure 12(a) that the image entropy of the stitching algorithm adopted in this study does not change much before and after stitching. Figure 12(b) shows that the average gradient is greatly reduced. Due to certain matching errors in the overlapping area, the gray level of the image in the overlapping area will change, so the average gray level of the image before and after stitching is reduced. Figure 12(c) shows the PSNR ratio of the images before and after splicing. Compared with the original image, the PSNR ratio of the spliced image is improved, indicating that the image quality after fusion by the image splicing algorithm proposed in this study is good and the similarity of the overlapping area of the image is high. Figure 12(d) shows the comparison of the image standard deviation before and after splicing. The standard deviation reflects the degree of discretization between the pixel value and the mean value of the image. It can be seen from the figure that the standard deviation changes little before and after splicing, indicating that the image quality loss is small before and after splicing. Figure 12(e) and (f) show the cross entropy and mutual information of the image. As the moving speed of the bridge inspection vehicle cannot reach a uniform speed in the test process, the size of the image overlap area is not necessarily within the range of 1/3 to 1/2, and some image overlap area sizes are less than 1/3, so the mutual information of the image is relatively large. The fluctuation range of the image cross entropy results is between 0.02 and 0.16, mostly concentrated at approximately 0.08, indicating that the mosaicing effect is good. Quality evaluation of mosaic images.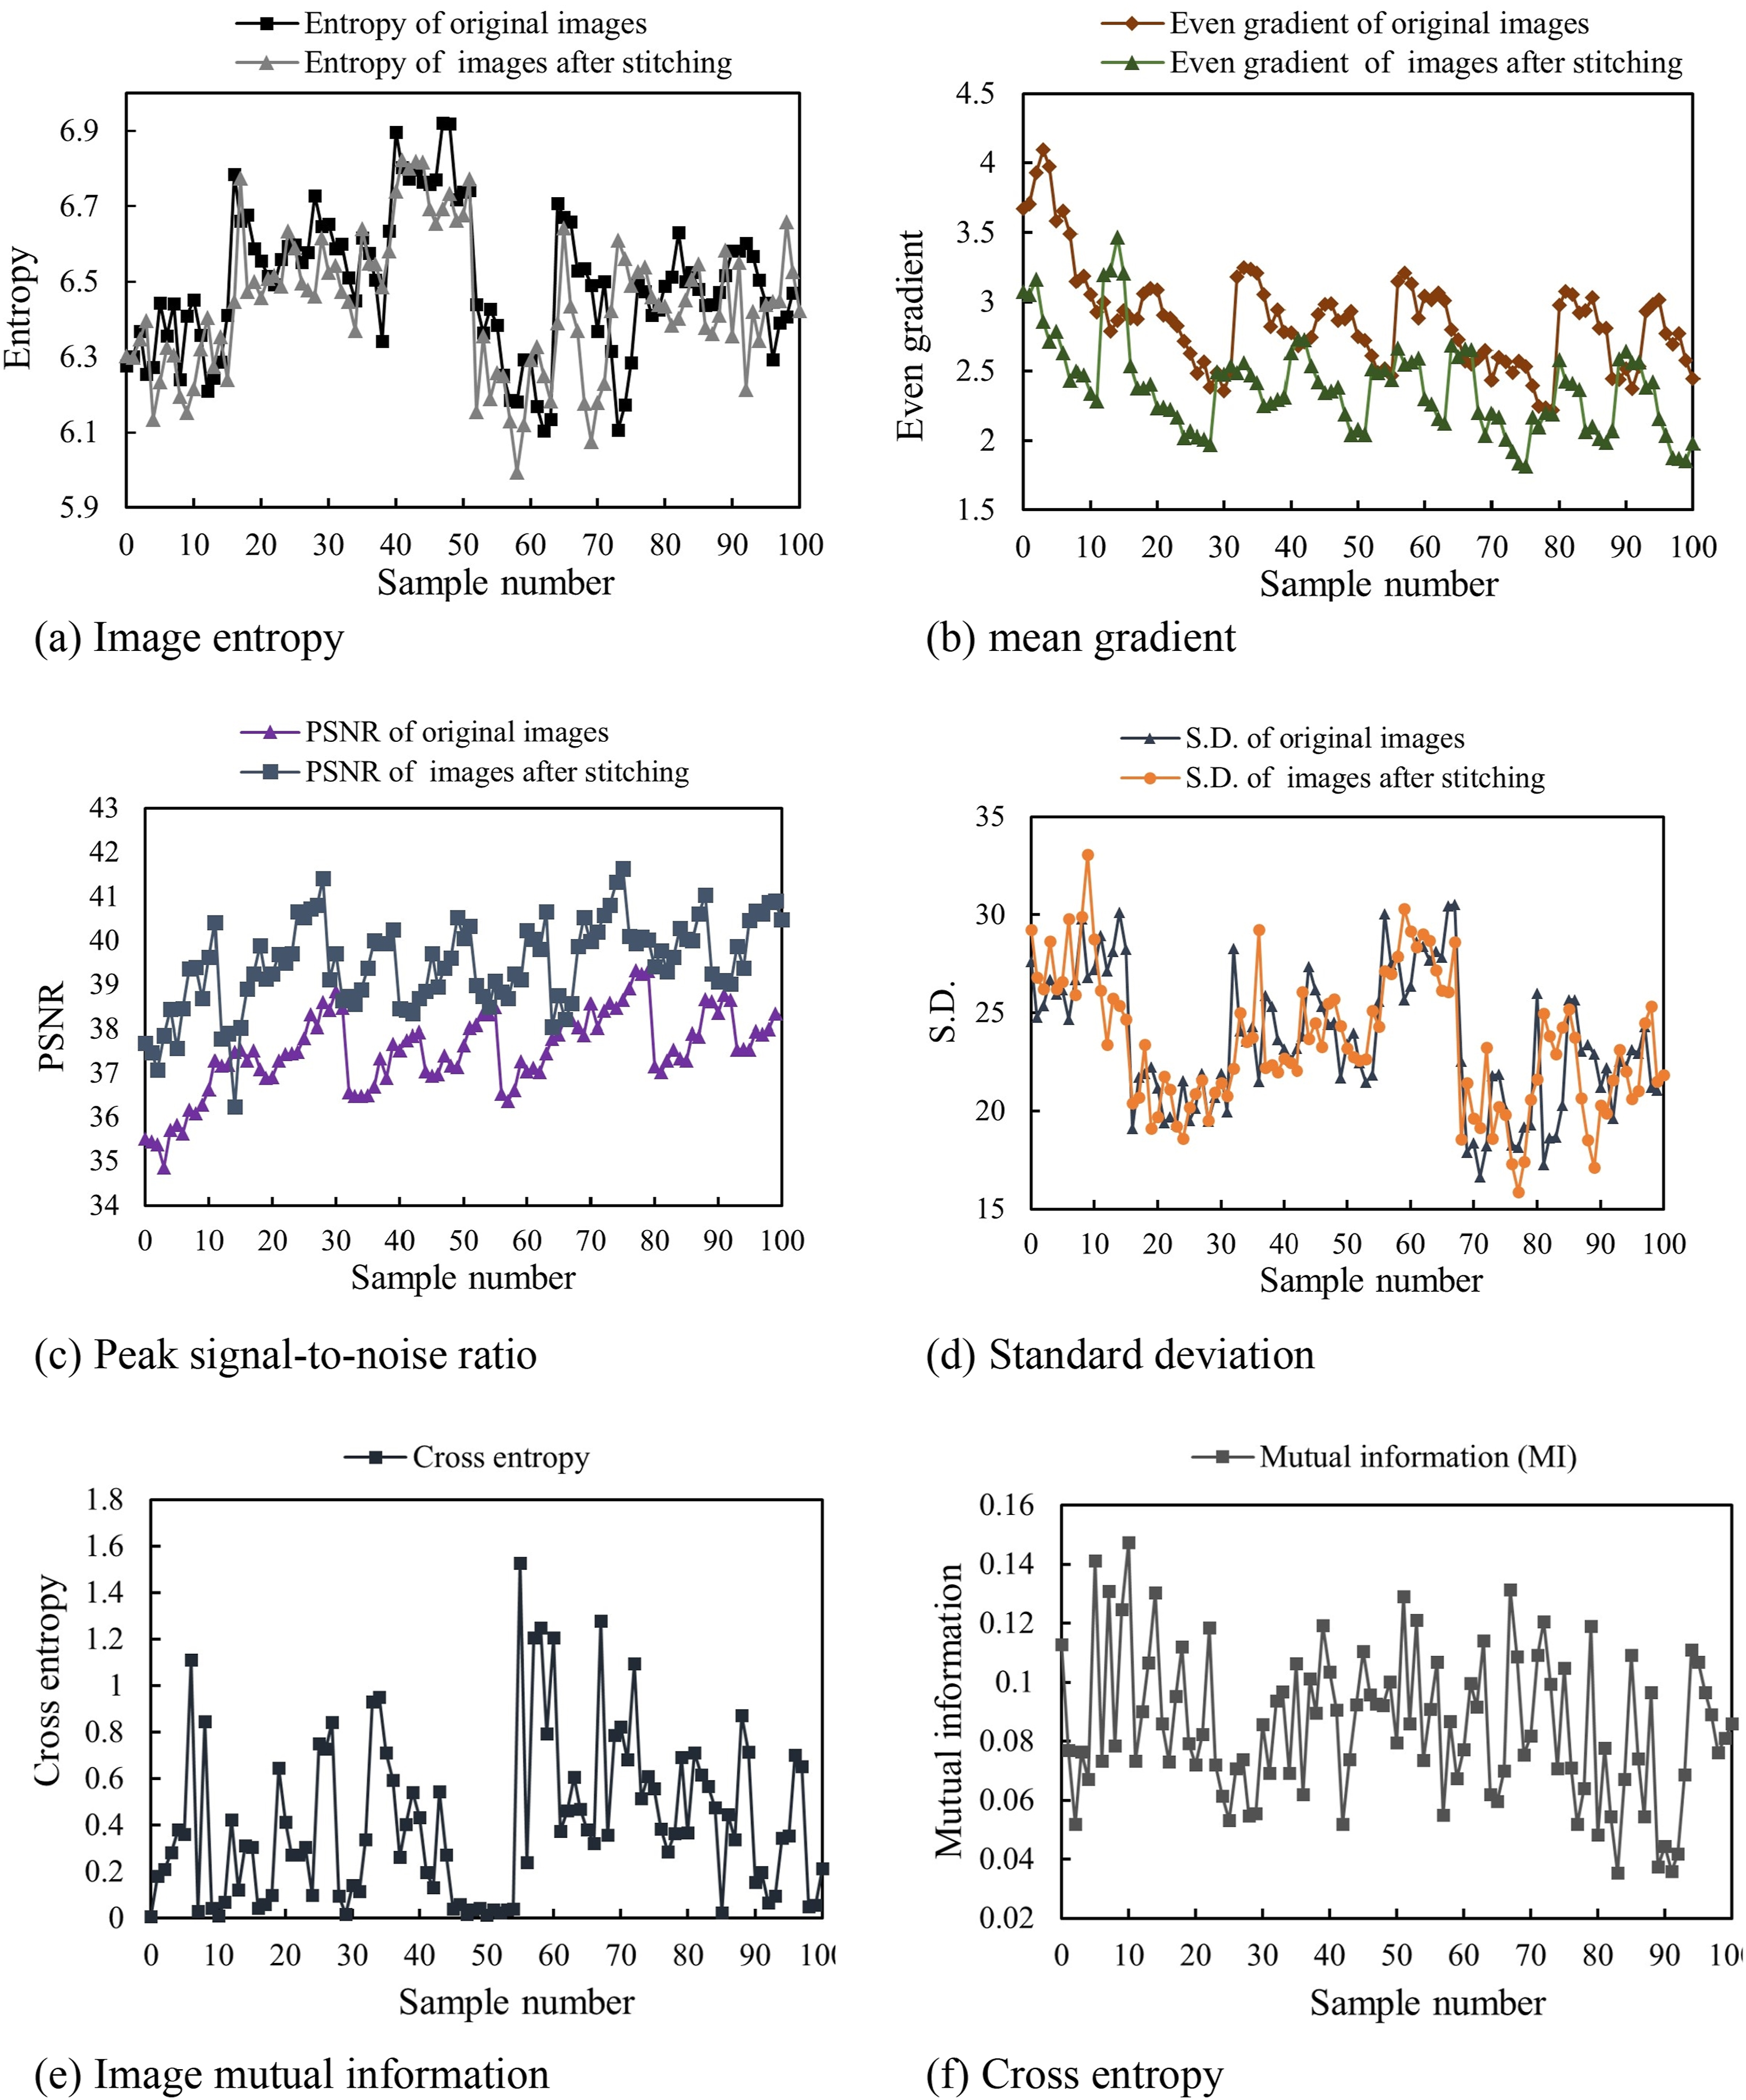
Defect identification results
The girder bottom defects are mostly cracks, while other defects are scarce. Hence, cracks were regarded as the targets of identification and positioning in this study. Linux, an Intel Core i7-4900 processor, and a RTX Titan were used to build a training environment for the deep learning model. The U2-Net model was trained by using bridge concrete crack datasets collected by the authors, which includes 1598 images with cracks and 1846 images without cracks. The crack datasets were randomly divided into 7 (training set):2 (validation set):1 (test set) without using data augmentation methods. The Adam optimizer was used to optimize the loss function.
The images were center cropped into a resolution of 544 × 544 pixels and fed into the U2-Net model. The training epochs of the model were set to 100 epochs, and the early stopping function was used to prevent overfitting. Additionally, the initial learning rate was set as 0.0001, and it decreased by 0.95 times every 10 epochs. By adjusting the learning rate dynamically, the model more easily achieved a stable convergence state. Finally, the model trained 53 epochs.
Performance of the U2-Net Model.
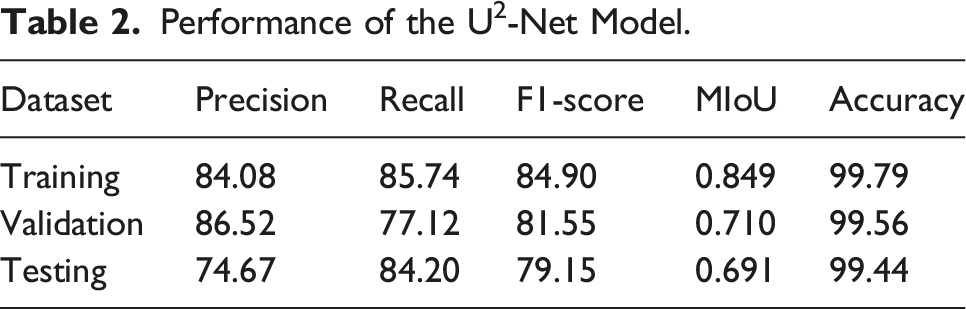
Figure 13 shows the prediction results, including the original test images, label images and predicted images. It can be analyzed from the segmentation results that the model has great generalization performance and can recognize the geometric shape and size of cracks accurately. Examples of crack segmentation on testing images by the trained U2-Net.
Performance of the U2-Net Model and Other four Baseline Models.

The trained U2-Net model was applied to identify cracks in the girder bottom images in practical applications. Twenty-four raw images taken at the bottom of a span were selected. Figure 14 shows the raw images and predicted images of the on-site bridge girder bottom using the U2-Net model. U2-Net can effectively identify the geometric shape and size of cracks under the background of complex noise and texture. Examples of predictions on girder bottom images by U2-Net.
Defect location results
An example of the actual location of the locating defect is shown in the BIM model of the bridge in Figure 15. Based on the BIM model established in the last section, according to the sequence of panoramic image stitching, the relative position of all images participating in the stitching with respect to the first photo in the upper left corner could be determined. Similarly, in the process of defect recognition, each image was cut into 16 images of the same size. The defect was identified for each small image after cutting, and the pixel position of the defect in the small image was determined. The actual size corresponding to each pixel was determined according to the camera calibration result. BIM model of the bridge showing the actual location of the locating defect.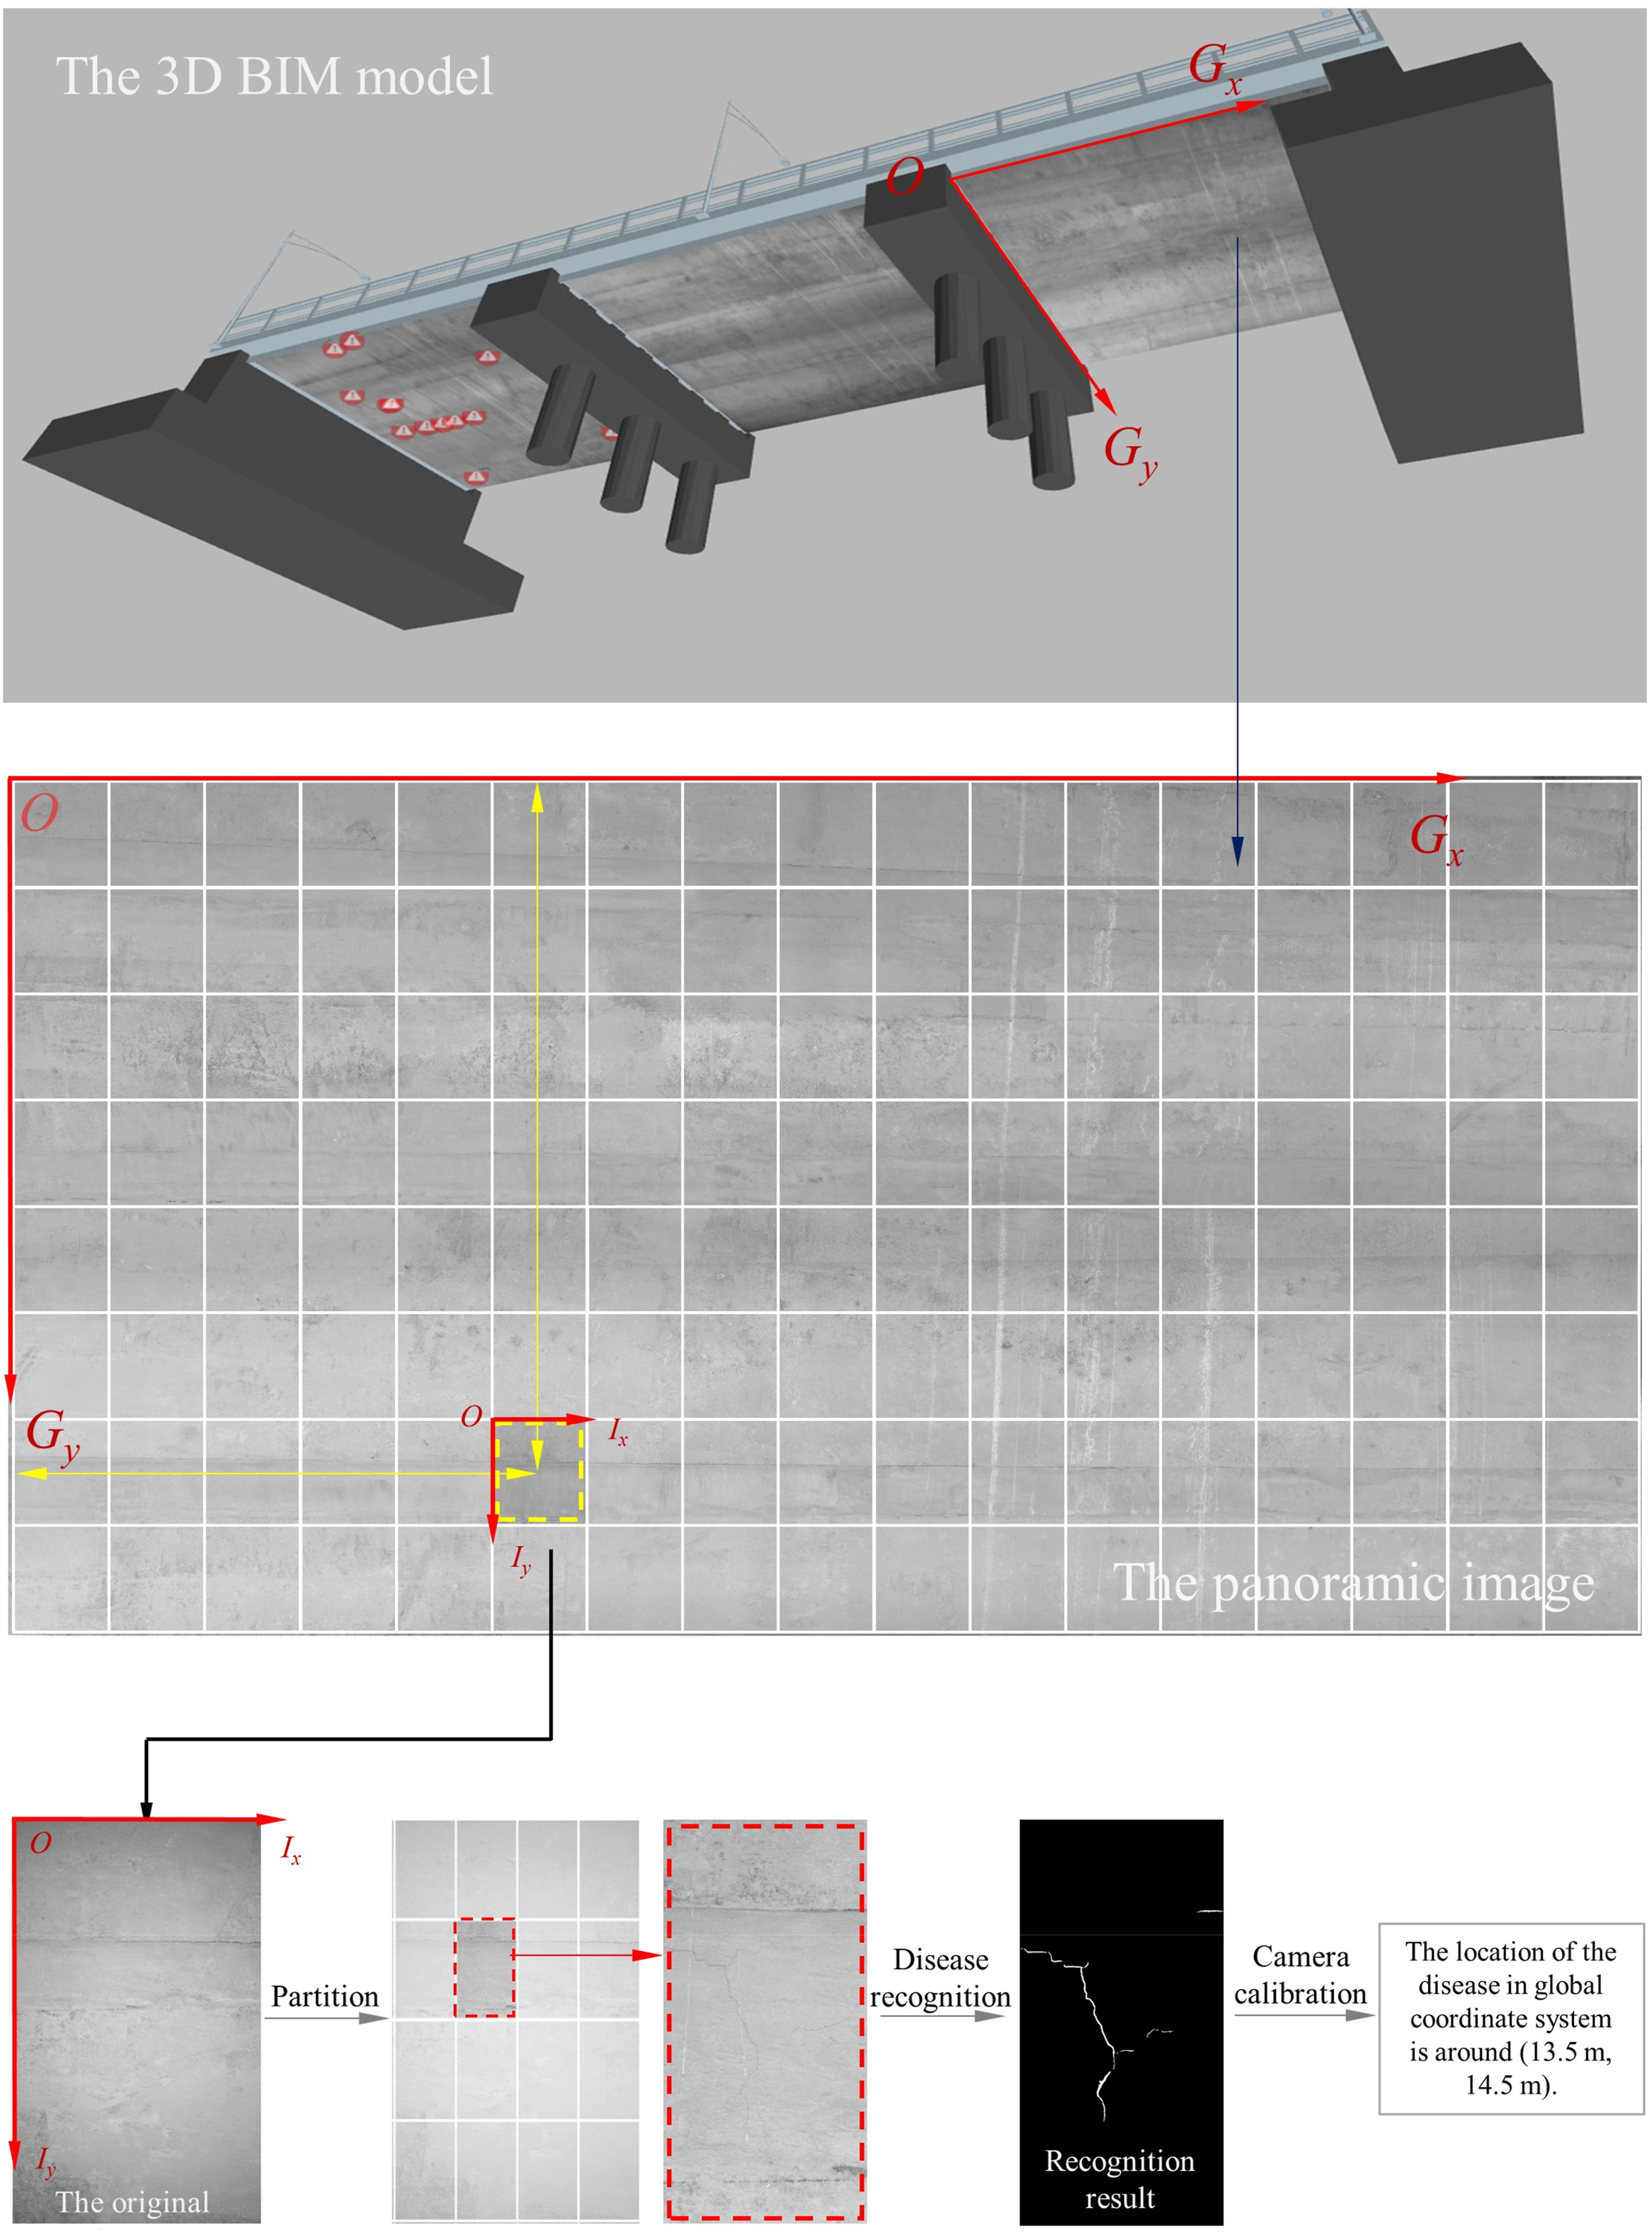
The principle of the defect location method in this study is shown in Figure 15. The original images taken by each camera were identified by the deep learning defect recognition system. For a single image, the image is segmented 4 × 4 at the pixel level first, and a total of 16 sub-images are obtained. Assuming that cracks are identified on the sub-images in the second row and second column, the pixel position of cracks in sub-image is obtained. Assuming that the first pixel in the upper left corner of the whole image (the original undivided image) is the pixel origin of coordinate, the pixel coordinates of the cracks in the second row and second column of the sub-image can be obtained according to the position relationship between the 16 sub-images. Thus, the pixel localization of the defect in a single original image is completed. Then, according to the stitching sequence of the panoramic image, the first image coordinate system in the upper left corner of the panoramic image is the global coordinate system. The first pixel in the upper left corner of the image is the origin of the global coordinate system. Through the image transformation matrix between each two adjacent images, the relative position relationship of each image relative to the first image can be calculated. The pixel coordinates of the identified crack (or other defect) position in the sub-image relative to the global coordinate system can be determined. Assuming that the origin of the space world coordinate system is the origin of the image coordinate system of the panoramic image, combined with the actual size of image pixel, the actual three-dimensional space coordinates of the defect at the bottom of the girder can be calculated.
A defect identification result in Figure 14(f) is taken as an example. This captured image was Camera_00,007_0009, i.e., the 9th photo captured by the 7th camera in Span No. 3, with a resolution of 5066 × 2544 pixels. The resolution of the small image was 1301 × 741 pixels, and the pixel coordinates of the defect from the origin of the panorama were (41,612 pixel, 45,312 pixel). According to the camera calibration results, the actual size of each pixel was approximately 0.32 mm. Therefore, the coordinate of the defect relative to the origin position at the bottom of the bridge (origin of the panoramic image) was (13.5 m, 14.5 m). All identified defects can be calculated to obtain the absolute position coordinates relative to the origin of the bridge bottom (the origin of the panoramic image). Thus, the position of the defects at the bottom of the girder can be obtained, which is convenient for manual inspection and repair.
Discussion
In this section, the main functions of the bridge girder bottom defect recognition system were verified by field tests. The panoramic image mosaic algorithm adopted has high stitching efficiency. In addition to the image stitching speed, the panoramic image stitching results were also satisfactory. A total of 100 × 2 images were selected from the sequence images, objective evaluation methods were used to evaluate the quality of the sample images, and the image quality before and after splicing was verified. In addition, the U2-Net model was conducted on the datasets collected by the authors to segment cracks. The model showed great performance on the datasets and could detect defects under the complex background.
Efficiency of Different Methods for a Bridge Span of 30 m With a Width of 16 m.
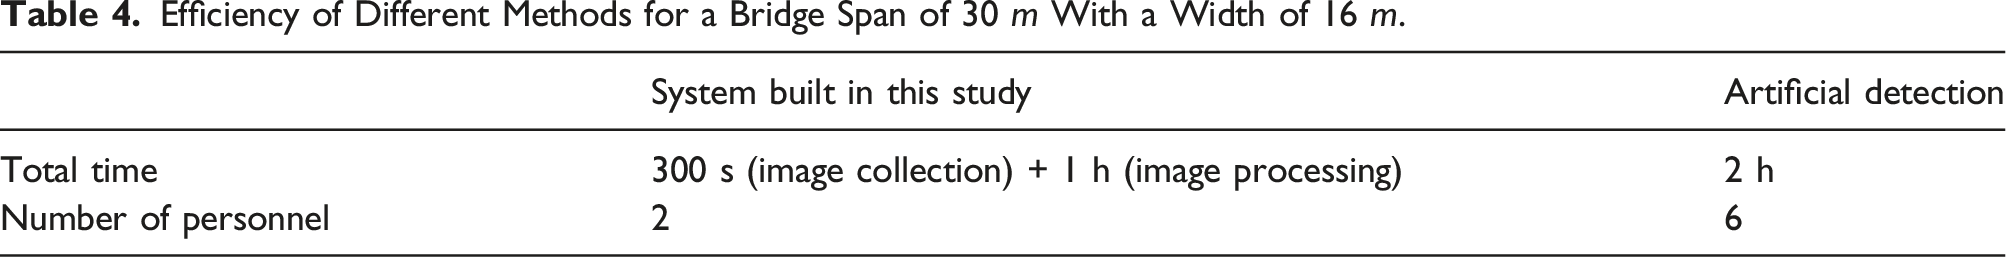
When collecting images of I girder bridges, it is necessary to increase the number of cameras and change the shooting direction, so that all images of the bottom of the bridge can be collected. If there are water pipes between girders, images will be difficult to collect. In addition, it needs to be equipped with appropriate cameras and lenses according to the measuring distance in the real field. The bridge inspection vehicle performs very well on bridges with few obstacles on the bridge deck. However, on bridges with many light poles, the efficiency will be reduced because of retracting and unfolding the vehicle mechanical arm. If the road surface of the bridge is not smooth or the path of the bridge inspection vehicle changes greatly, it will have a bad influence on the stitching of subsequence images. In contrast, under the condition of smooth running and a relatively fixed running track of the bridge inspection vehicle, the system studied in this study greatly improved the personnel allocation and detection efficiency.
Conclusion
This study mainly studied a vehicular defect identification system for the girder bottom of bridges and realized the panoramic image mosaic of a girder bottom 90 m long and 16 m wide. Additionally, the recognition and positioning of the whole girder bottom defect based on local-global images were conducted, and the detection results combined with the BIM digital model were visualized. The quality and efficiency of bridge girder bottom defect detection were greatly improved using this system.
The sequence image stitching method was two-two stitching, which was more efficient than the traditional traversal iterative stitching method. By analyzing and comparing the five indices of image entropy, average gradient, PSNR, mutual information and cross entropy of images before and after splicing, it was verified that the image quality can meet the actual detection requirements. The deep learning model was used to identify bridge defects, and the test F1-score of the model reached 79.15%. The positioning accuracy of the local image was up to 1 pixel, and that of the panoramic image was up to the centimeter level. The results demonstrated that the proposed inspection system and method performed well and realize the accurate localization and measurement of the defects, which is of great significance for the detection of the apparent defects on the girder bottom of bridges.
Combined with the actual measurement requirements, further research will be carried out to meet the needs of more practical engineering applications. Realizing real-time bridge girder bottom defect detection will be a part of the main research. For I girder bridges, perspective distortion correction algorithms will be further studied. It will be extremely important to improve the quality and efficiency of image mosaicing and optimize the defect recognition algorithm to obtain higher recognition efficiency and accuracy. At the same time, combined with the images taken by multiple cameras, the acquisition method of three-dimensional information of the bridge girder bottom will be studied to improve the positioning accuracy of the defects.
Footnotes
Acknowledgements
The authors would like to acknowledge financial support from the National Natural Science Foundation of China (No. 52208306), the Natural Science Foundation of Jiangsu Province (BK20220849) and Jiangsu Provincial Key R&D Program (Social Development) (BE2022820).
Declaration of conflicting interests
The author(s) declared no potential conflicts of interest with respect to the research, authorship, and/or publication of this article.
Funding
The author(s) disclosed receipt of the following financial support for the research, authorship, and/or publication of this article: This work was supported by the National Natural Science Foundation of China (No. 52208306), the Natural Science Foundation of Jiangsu Province (BK20220849) and Jiangsu Provincial Key R&D Program (Social Development) (BE2022820).