
Abstract
In this article, we propose a method of generating two-dimensional schematic diagrams from three-dimensional models of mechanical, electrical, and plumbing systems on computer-aided design software to represent this information in a more traditional, user-friendly format. It can be difficult to grasp the relationships between various mechanical, electrical, and plumbing elements in building information models because they are represented in a visually complex, three-dimensional manner. On the other hand, the relationships between building elements can be easily understood when using traditional schematic diagrams. First, the network of mechanical, electrical, and plumbing systems and a section view are extracted separately from three-dimensional models. Next, these extracted files are displayed as schematic diagrams on computer-aided design software. The expressions of traditional drawings were referenced to generate new diagrams. After schematic diagrams were created, they were evaluated by staff members in the facilities department of a university in Japan.
Keywords
Introduction
The use of building information modeling (BIM), which has been introduced predominantly in new construction, is also increasing in existing buildings. In 2007, a survey conducted by Khemlani concluded that the architecture, engineering, and construction (AEC) industry was still very reliant on drawings for designing and constructing buildings. The objective of the survey was to identify the most important requirements that AEC professionals would like BIM solutions to satisfy. 1 However, the technology to implement BIM is gradually available and maturing. The productivity of BIM to the AEC industry is widely acknowledged and increasingly well understood. However, in contrast to new construction, maintenance of existing buildings depends more on two-dimensional (2D) drawings. In the conservation of existing buildings, the 2D design documents play an important role even now.
Conservation of the building stock constructed during Japan’s period of high economic growth, which occurred from the mid-1950s to early 1970s, is now an urgent problem in Japan. Many buildings were constructed during this period. The plans for these buildings were printed on paper, which have since deteriorated, rendering some of them unusable, while others have been lost. It is urgent that the remaining plans be preserved so that they can be used to repair and maintain the existing building stock. There are many ways of storing paper documents electronically, but in this study, we have been considering the conversion of paper design documents into three-dimensional (3D) models using BIM data.
It is important for facility managers and engineers to be able to easily use building design documents. BIM enables accurate geometrical representations of the parts of a building. However, when data are presented in the form of a 3D model, it can be difficult to grasp the connections between the various elements of mechanical, electrical, and plumbing (MEP) systems because these models are visually complex. Functional relationships are more important than exact locations when performing maintenance on MEP elements. Many engineers who work on the maintenance of facilities are more familiar with and understand 2D drawings better than 3D models. It is important to generate new types of MEP diagrams from 3D models to allow effective facility management since traditional paper documents are easy to use.
Recently, research to utilize BIM in existing buildings has increased. Unlike new construction, existing buildings have many problems, such as lack of design documents and uncertainty in the conditions of buildings. In 2014, Volk et al. presented a review of over 180 publications regarding the use of BIM for existing buildings. For their review, they first divided publications into four categories: functional, informational and interoperability, technical, and organizational and legal. 2
Existing drawings are one of the necessary clues to reproduce building information models. Research about existing drawings has been carried out. Penttilä et al. 3 evaluated the possibilities of BIM in the renovation of historic buildings. In their paper, they observed that when digital drawings were overlaid with new laser-scanned data, some digital copies of the original handmade drawings were not based on actual measurements. 3 Attar et al. 4 recreated BIM of a heritage building located in Toronto, Canada. They used laser scanning, collected architectural blueprints, and conducted site inspections. They used the AutoCAD drawings of the building from the time of renovation as a basis for their model. 4 Tsai et al. 5 observed an actual project, a nine-floor building, and recorded the steps taken during the process of creating BIM models. They recorded the time needed for constructing 3D/4D (four-dimensional) BIM models from 2D drawings and paper-based documents using a BIM software application. 5
Because the data generated by BIM software contain an enormous amount of information, they have the possibility to generate new documents. Some research to generate documents from elaborated BIM data has also been reported. Kim et al. 6 established a framework for automating the generation of construction schedules using stored BIM data. Manrique et al. 7 developed a methodology for the automation of shop drawings from 3D models for the wood-framing design of residential facilities. Martins and Monteiro 8 developed a BIM-based code-checking application for building water network designs. The application simplifies 3D models of MEP elements and can produce floor plans, sections, and 3D views. 8
To generate 3D models from 2D architectural drawings, research to reconstruct 3D solids using orthographic view drawings has been reported. In Japan, Kawasumi and Yamaguchi 9 conducted a semi-automatic reconstruction method of a 3D model from orthographic view drawings of the architecture. Many methods to automate the conversion of 2D drawings into 3D models have been developed by researchers and computer-aided design (CAD) developers. Yin et al. 10 reviewed the researches on automatic generation of 3D building models from both paper and CAD-based architectural drawings. Research about the generation of 3D routes has been seen especially in piping systems. Pipe routing has been a research topic for a long time, not only in ship production but also in plant facilities. The research starts with a 2D workspace and gradually extends to the stage of 3D workspace. Asmara and Nienhuis 11 developed an automatic piping system that used a cell decomposition approach in combination with a mathematical programming technique. Ando and Kimura 12 developed an automatic routing method for simple pipes by considering both elbows and bends.
In Japan, most of the studies on the maintenance of existing buildings have been done at Kumamoto University. Research of computer-aided facility management (CAFM) systems has been conducted continuously, and many functions have been considered. Iki et al. 13 developed a network-based, distributed-database integrated CAFM system for spatial analysis and space planning of an office building. Iki et al. 14 developed a prototype of a CAFM system on an Intranet. The prototype was developed for general users. Shimoda et al. 15 developed a CAFM system that calculates the cost management related to building maintenance. Okada et al. 16 developed a CAFM system to assist the optimal life-cycle management (LCM) business. Currently, cooperation with BIM data and facility management is being considered. In 2015, Nakama et al. 17 developed a system called the Building Information Management System that displays BIM data generated from BIM software on a website. 17
At present, few studies have focused on simplifying 3D models of MEP elements, and none have focused on the conversion of 3D models into 2D MEP diagrams. Therefore, we developed a process to convert 3D models into 2D schematic diagrams to solve this problem, and we achieved the generation of a diagram on specific software and exported the output as an image file. 18 However, in order to enable engineers not only to understand the new diagrams but also to edit them, it is necessary to generate schematic diagrams on CAD software.
Objective
For this study, our goals were to express 2D schematic diagrams of MEP systems from 3D models on CAD software. A network of MEP systems and a section view were extracted separately from 3D models. In CAD software, the network of MEP systems and the section view were expressed one by one. Schematic diagrams were generated by overlaying the network of MEP systems on the section view. The generated schematic diagrams were then evaluated by staff members in the University of Tsukuba’s Department of Facilities.
Conversion from paper drawing to 3D model by manual operation
In this study, 3D models used for generating schematic diagrams were made manually from paper design documents. We previously investigated this conversion with the objective of learning how much of an elaborated 3D model could be reconstructed from existing drawings only. 19 Using Autodesk’s Revit Building Design software, which is widely used in the AEC industry, paper design documents for Building 5C on the campus of the University of Tsukuba were converted into a 3D model as a case study.
An overview of Building 5C is shown in Table 1. Building 5C has been in use since 1973, when the University of Tsukuba opened more than 40 years ago. The exterior appearance of the building is shown in Figure 1. It is a multi-purpose building with laboratories and rooms for offices, meetings, and classes. Seismic reinforcement work on the building was carried out from 2006 to 2008, and the air conditioning, plumbing, and electrical systems of the entire building were also renovated during this period.
Overview of Building 5C.
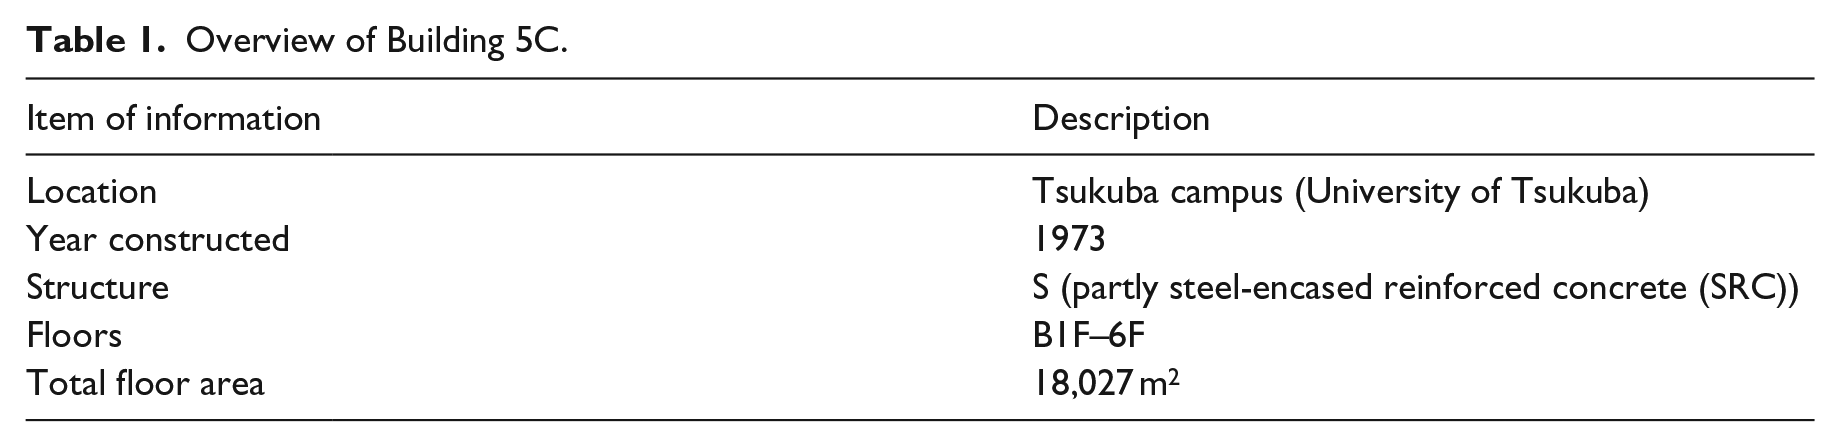
Exterior appearance of Building 5C.
Most of the new construction documents were printed on paper and are stored in the form of sheets or books at the university. On the other hand, design documents for the renovation work performed in 2007 and 2008 are stored in both paper and electronic format. The preservation in the electronic format was carried out mainly in PDF and CAD formats.
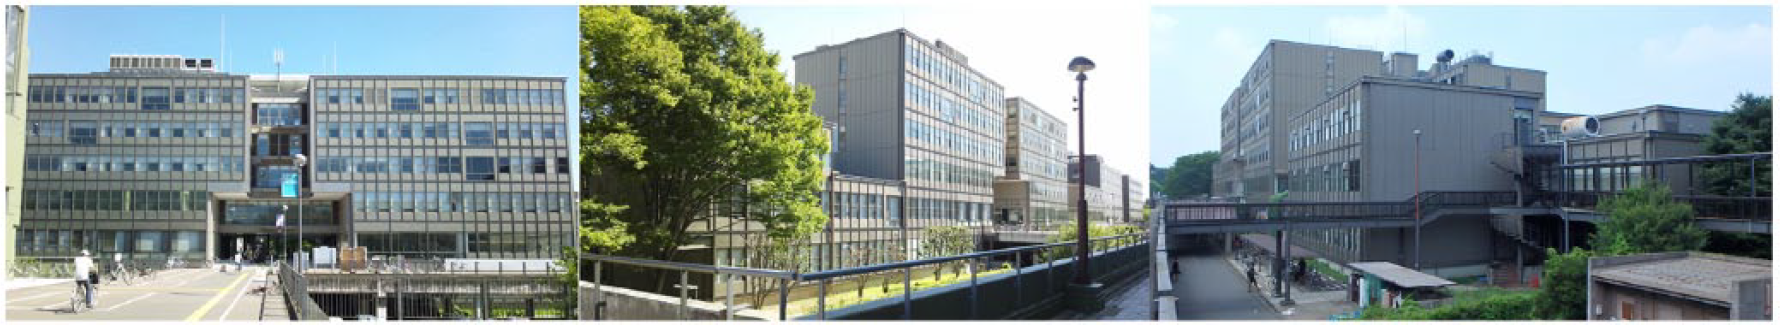
The conversion was performed using the design documents from the most recent renovation projects implemented in 2007 and 2008. Documents from the building’s original construction were used as reference when areas not described in the renovation documents were found. The work done on Building 5C was classified into three categories: architectural and structural, air conditioning and plumbing, and electrical. After architectural and structural elements were recorded, the air conditioning, plumbing, and electrical elements were recorded. The 3D models of MEP elements and building elements that were created by this process are shown in Figure 2.
3D models of the Building 5C’s MEP elements (left) and 3D models of the Building 5C’s architecture elements (right).
Use of MEP diagrams in conservation
For the purpose of learning the use of design documents in conservation, an interview with staff members of the University of Tsukuba’s Department of Facilities was carried out in 2014. Related to the schematic diagrams, the following two questions were asked about the use of the design documents for existing buildings:
What storage medium is used to record the building information?
What is your understanding of the network of MEP systems?
The following answers were given about the storage medium. After receiving requests for repairs, the facilities staff members use the drawings of past works to confirm the actual location of the elements. When they make a new renovation plan, they use the drawings of past works as a reference. We were told that they often use traditional paper drawings, or PDF or CAD files in their operations and rarely use 3D models. CAD software such as AutoCAD, Vectorworks, and the free software JW_cad (the software used by staff members varies from person to person) are often used in Japan to create or revise 2D drawings. For these reasons, many engineers use 2D drawings.
Next is the question about understanding the network of MEP systems. The facilities staff members told us that they usually use a combination of schematic diagrams and 2D plans to locate elements (section and elevation views are used in some cases, too) and then go to the actual location to find them. We were also told that it was important that the connections between the elements of building systems be clear and easy to understand in our representations. When performing construction work, for example, accurate locations and sizes of elements are important in order to determine whether different elements could interfere with each other. However, when performing maintenance, functional relationships between elements are more important than physical locations. As the numbers of objects and their paths increase, it becomes more difficult for 3D models of MEP systems to distinguish each system.
From the above, it is necessary for BIM to allow the generation of MEP diagrams that can be used by facility managers in a way similar to the way that traditional drawings are currently used. As for plan views of MEP systems, their generation is possible by cutting 3D models horizontally. In order to edit new schematic diagrams, it is desirable for them to be generated on CAD software.
Traditional schematic diagrams
The expressions of traditional diagrams were observed for generating schematic diagrams from 3D models. The expressions which are described in standard detail drawings (published by the Ministry of Land, Infrastructure, Transport and Tourism) were also used as a reference. Examples of symbols and lines are described in the standard detailed drawings so that designers and engineers can use these expressions as a reference when they create new drawings. 20 The network of MEP systems and the building skeleton, rooms, and spaces are described separately.
Network of MEP systems
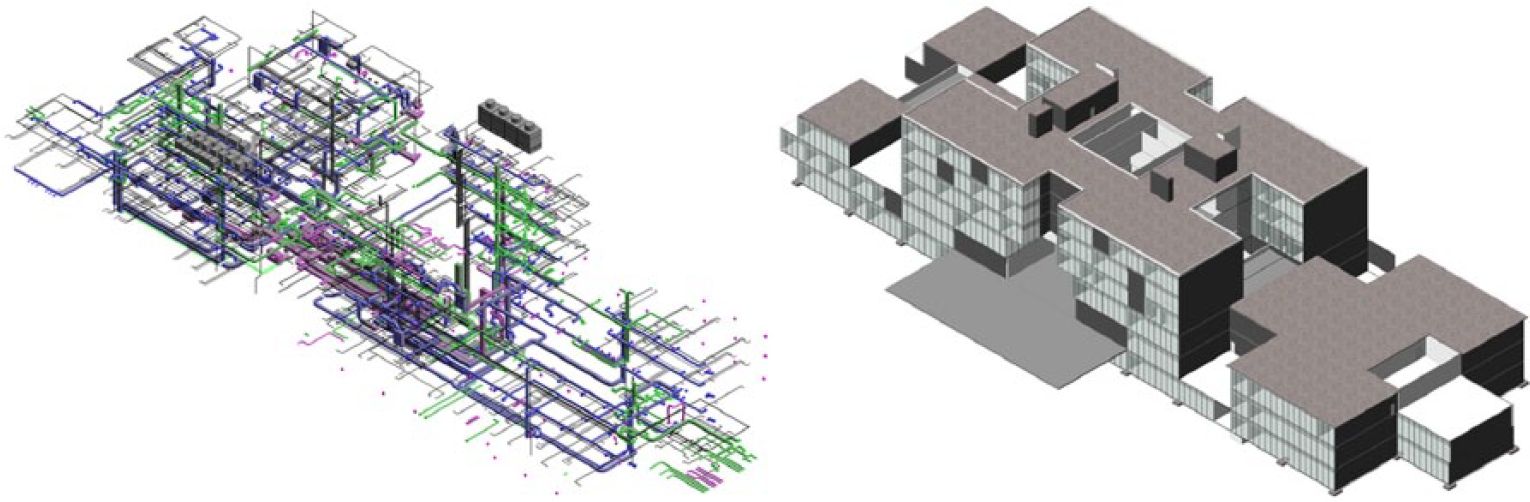
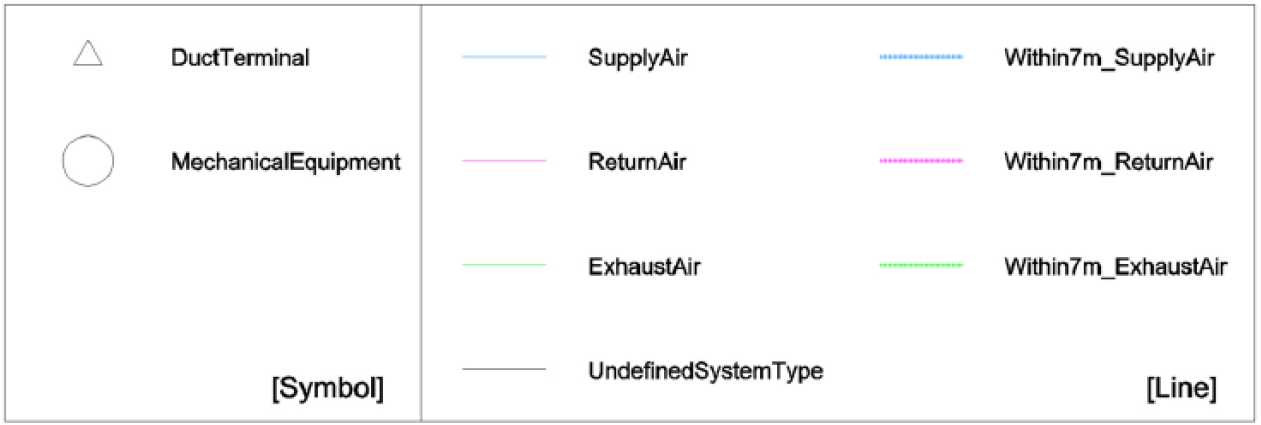
Traditionally, schematic diagrams have been used to represent air conditioning, plumbing, and electrical systems in building plans. For example, Figure 3 shows the schematic diagrams of the air conditioning ducts used for new construction and renovation work in 2007 on Building 5C. In the duct system, ducts and fittings are expressed as lines, and supply devices and terminals are expressed as symbols. Materials flowing through ducts are represented as labels on the lines and by the line styles. On the diagrams used for new construction, the sizes of ducts may be represented as labels near the lines. In addition, different symbols are used to represent different kinds of elements, and labels are added to these symbols. It is important that a network of MEP systems describe exactly what is connected to what and clearly explain what each line represents.
Schematic diagrams of air conditioning ducts used for new construction (left) and schematic diagrams of air conditioning ducts used for 2007 renovation work (right).
Building skeleton, rooms, and spaces in a schematic diagram
The expression of the building skeleton in a schematic diagram is similar to that of a section and elevation view, but they are not identical. For example, the building skeleton in a schematic diagram is not drawn to scale. The values for floor height are shown, but their geometries are not represented to scale. In addition, ceilings are not expressed on a diagram of new construction, but they are expressed on the diagram of the renovation work in 2007.
Usually, one system is expressed with only one schematic diagram. The main spaces and rooms of the building are assembled on the diagram in traditional drawings. However, all spaces and rooms may not necessarily be represented in the schematic diagram, and so the expression of renovation work differs from that of new construction. The names of rooms or spaces are represented as labels within the building skeleton. Rooms and spaces help express the floor position of the MEP elements. With the room and space information, engineers can grasp the spaces through which each component goes.
Based on the above, items for generating schematic diagrams are arranged in Table 2.
Reference features of expression in traditional schematic diagrams.
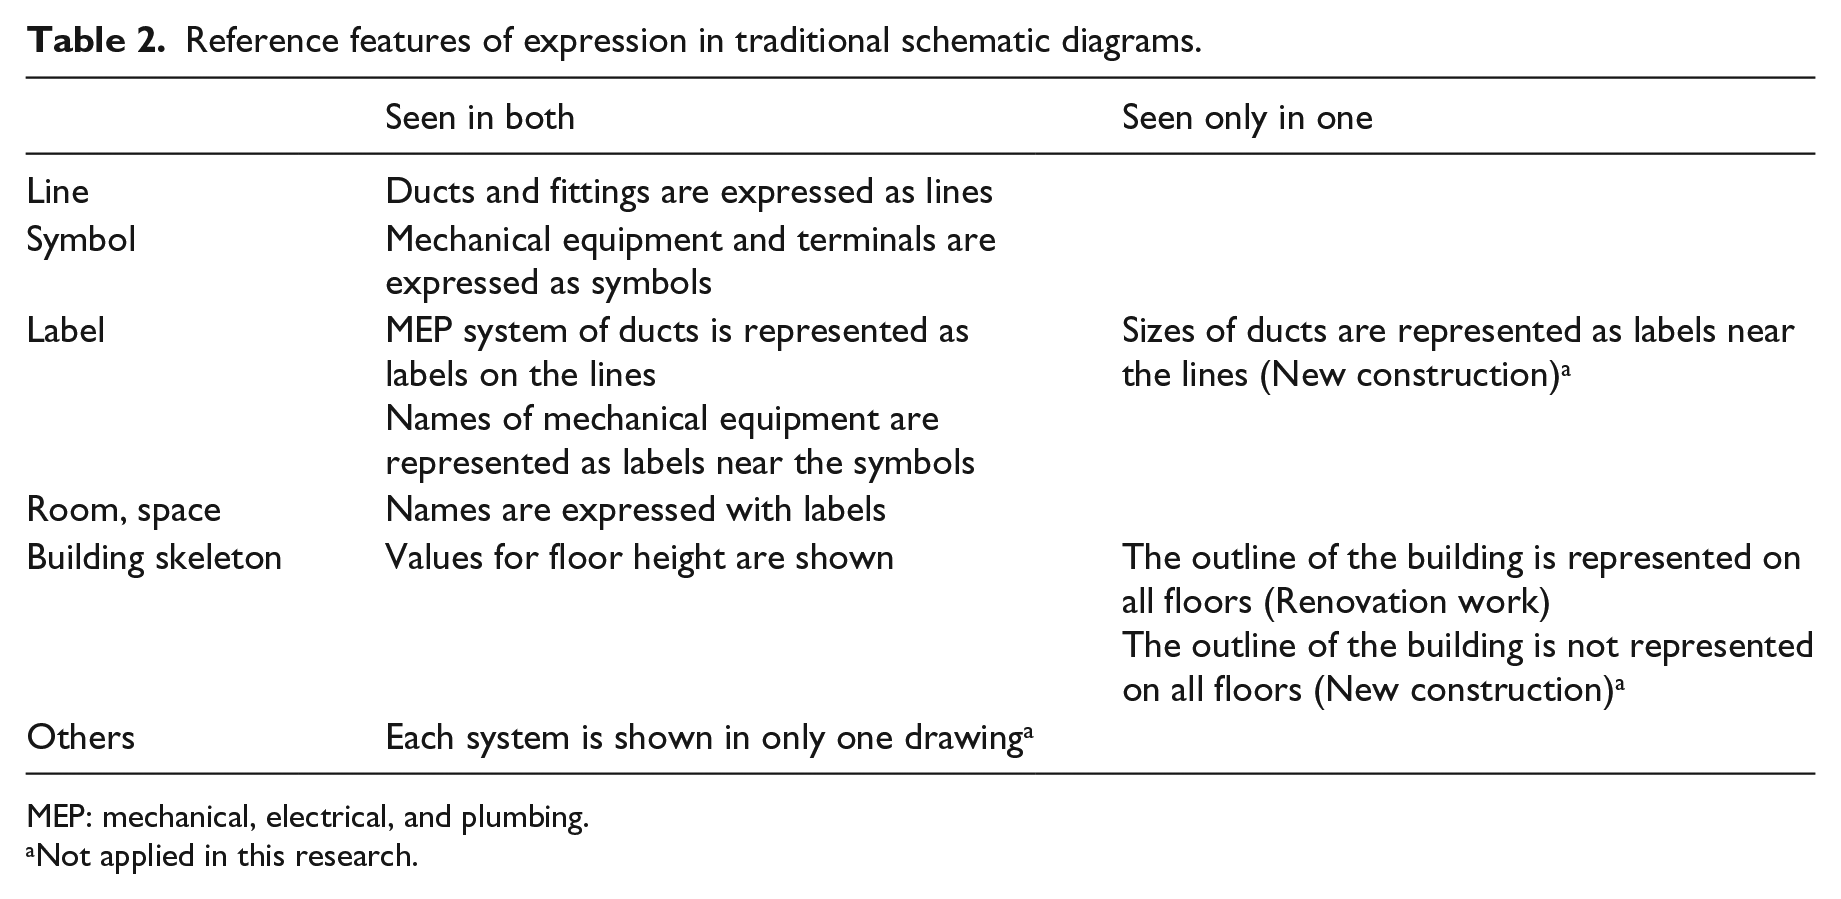
MEP: mechanical, electrical, and plumbing.
Not applied in this research.
Development of conversion system
To generate schematic diagrams that clearly identify each element of a building’s systems and describe these elements, we developed a process using Autodesk’s Revit software and AutoCAD software. Extraction of the network of MEP systems and the section view from Autodesk Revit and generation of the schematic diagrams of MEP systems in AutoCAD are described separately. In CAD software, attribute representation was drawn using scripts. The duct system of the air conditioning was treated as the case study.
Extracting data from 3D models
First, a given network of the duct system and a section view were extracted from the 3D models.
Network of MEP systems
In extracting the network of MEP systems, the processes involved were performed on the Revit platform and implemented using the Revit Application Programming Interface (API) with C#. To draw attribute representation using scripts on AutoCAD, the network of the MEP systems was extracted from Autodesk Revit as an SCR file, which is the format of a script file on AutoCAD. In this procedure, all elements forming a given network of the air conditioning duct system were collected. In addition, all of the categories that belong to the duct system were selected. These included ducts, duct fittings, ventilation machinery, and air terminals. The attribute information used is shown in Table 3. Extracted SCR files were distinguished by the kinds of graphics figures, and three files of lines, symbols, and labels were exported.
Attribute information used for generating schematic diagrams.
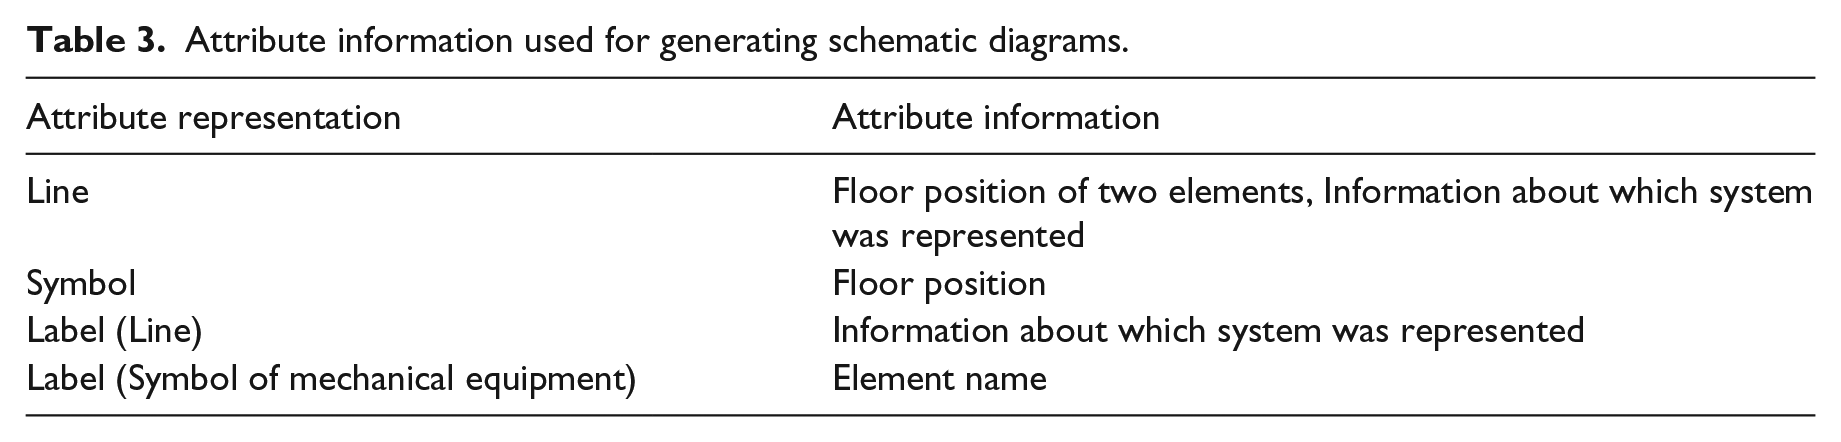
Figure 4 shows the procedure for exporting the SCR file for lines. All elements that formed a given network of the air conditioning duct system were collected. The connection of each element was confirmed in the first step of the process. If an element had a connection, then all of the elements connected to it would be accessed. When two elements had a physical connection, a new line was created using the representative position of each element. In the cases of duct fittings, ventilation machinery, and air terminals, the floor position of the element was adopted as the representative position. In the cases of ducts and flexible ducts, the center of the line linking the initial position to the terminal position was adopted as the representative position. In addition, the kind of MEP system was confirmed. The attribute information of the MEP system was used for choosing the layer on AutoCAD. The line created from two elements and the layer of the MEP system were described for every pair.
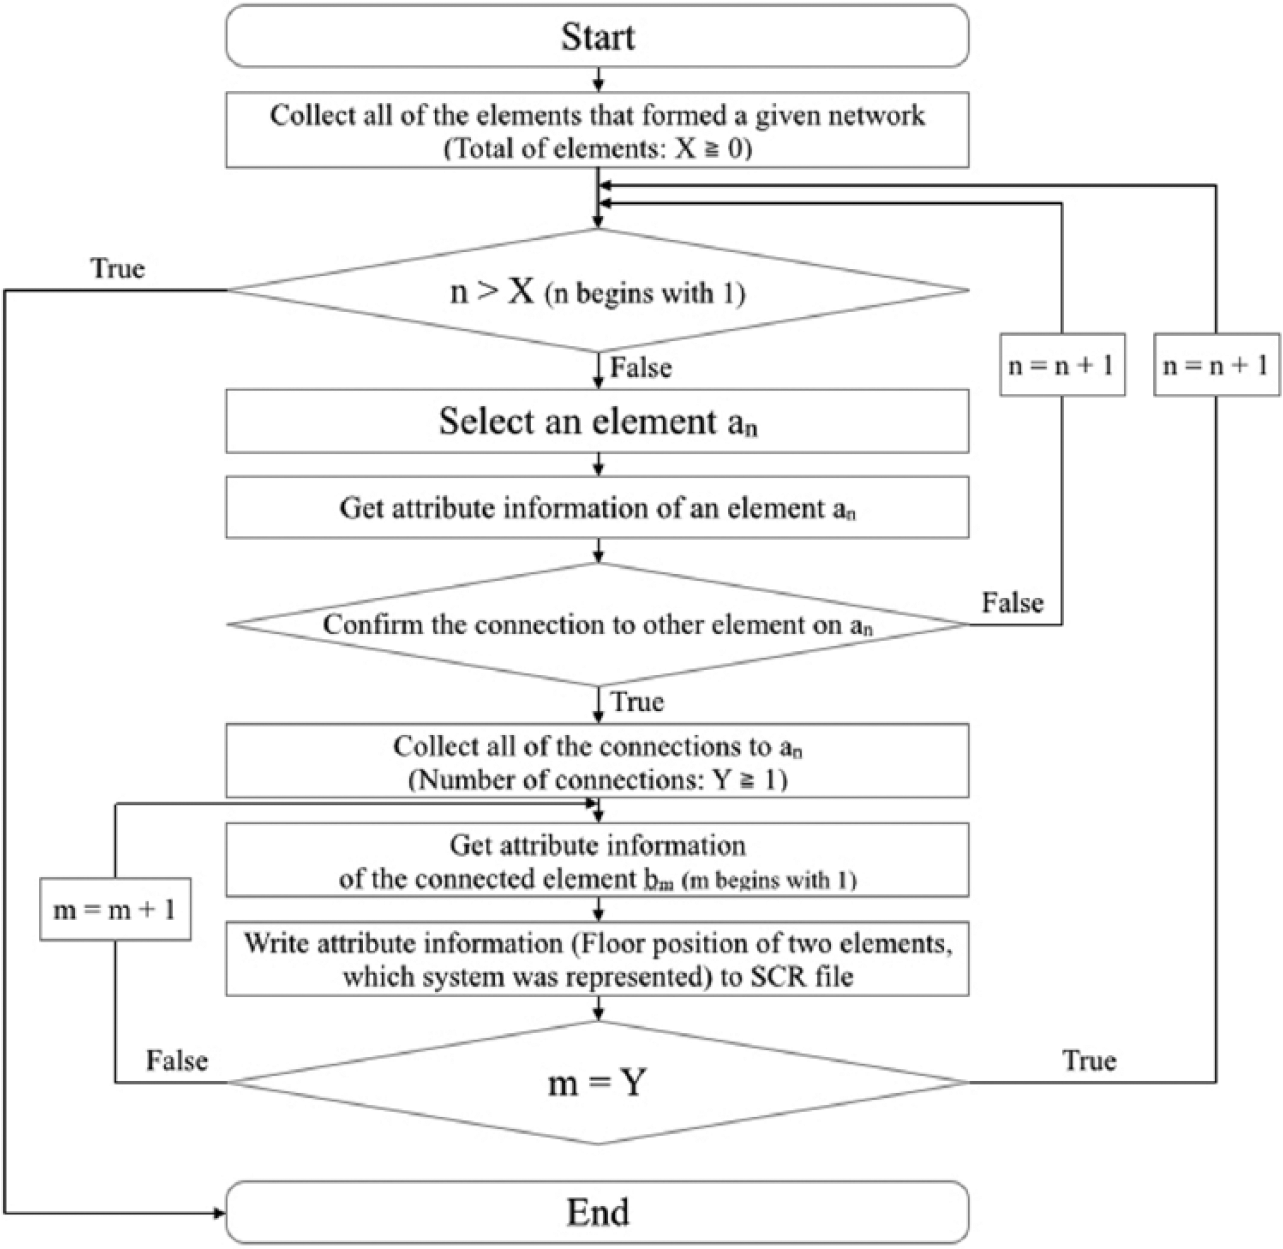
Procedure for extracting attribute information about line data.
In the SCR file with symbols, the attribute information of ventilation machinery and air terminals was used. The floor positions of these elements were recorded. The shape of each symbol was decided when they were exported from Revit. In this study, simple shapes were adopted: a circle for ventilation machinery and a polygon (triangle) for air terminals. The shape of the symbol and the floor position were described using the attribute information for every element.
As the label for lines, part of the name of the MEP system was used. The position of the label of the MEP system was set on the corresponding line. Only the attribute information of ventilation machinery was used for symbol labels. The names of the ventilation machinery were recorded. The position of the label was set near the position of the corresponding ventilation machinery.
In addition, the following adjustments were performed for the whole program:
A reduced scale was set to be the same as that of the section view.
The origin in the file was set to be the same as that of the section view.
Each figure was repositioned by assigning floor positions of the height direction and the longitudinal direction. To prevent the overlap of figures, the value of the short direction was added to the value of each direction.
The program to extract the network of MEP systems was executed by selecting the item in the Add-In ribbon on Autodesk Revit. The screen of the executing program and the extracted files are shown in Figure 5. The time required for program execution was approximately 10 s. The screen of the SCR file opened by Notepad is shown in Figure 6. The script in the SCR files was described by the grammar of AutoCAD. The attribute information of the MEP element was used to set the layer and to describe the script for every figure.
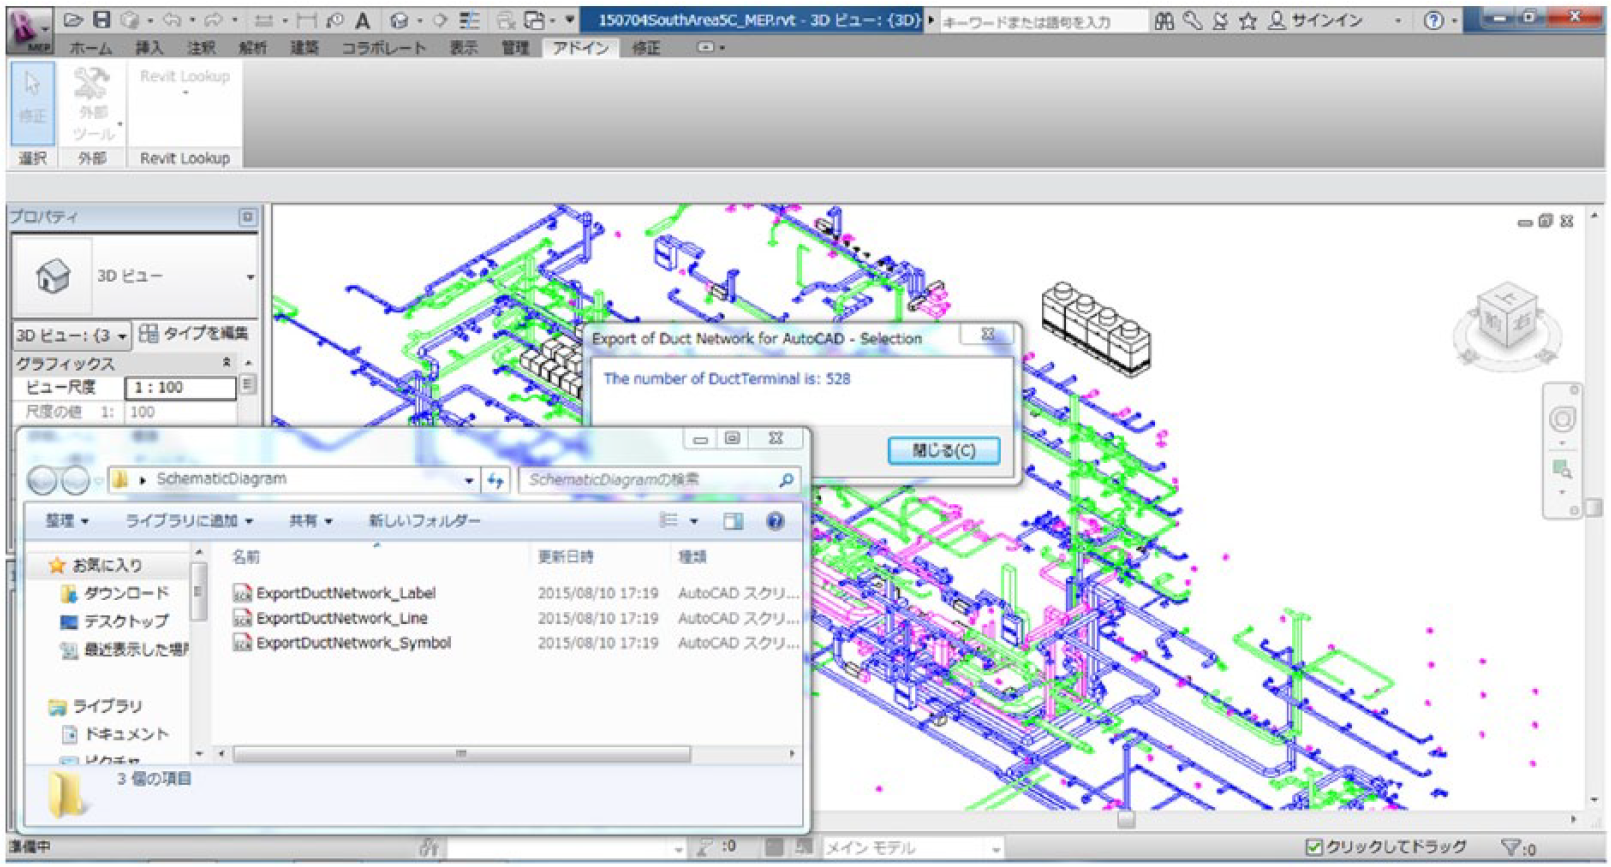
Execution of add-in command on Autodesk Revit and the generated SCR files.
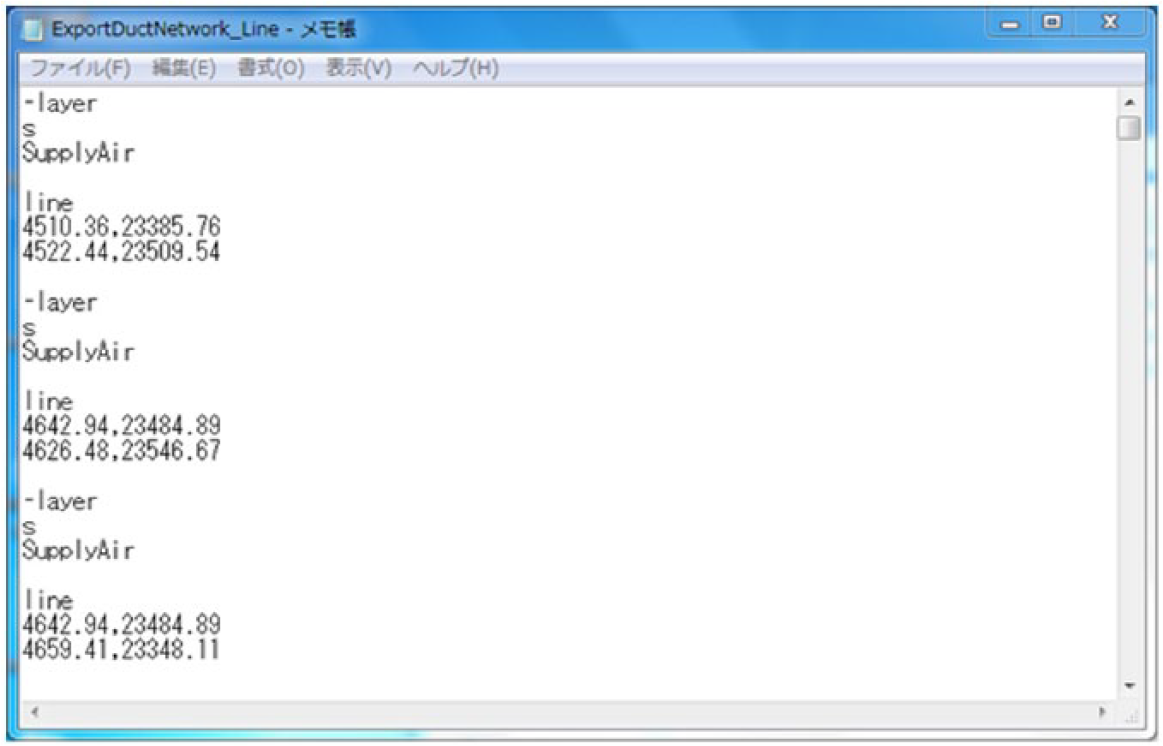
Description in the SCR file (opened by Notepad on Windows).
Section view
The simplest method to express the building skeleton is using a section view. Because the section view alone is insufficient as the expression of schematic diagrams, we proposed modifying the expression of a part of the MEP elements.
A new section view was created when a cutting-plane line was chosen from the 3D models. Expressing only the space and its label in the section view is sufficient. Thus, only the elements forming the rooms and spaces, such as walls, floors, ceilings, and roofs, were displayed. Because a simple expression was preferable for each element, the level of detail (LOD) of the view was set to simple. The name of each space was expressed by labels. When the section view was exported from Autodesk Revit, DWG was chosen as the data format.
Unlike traditional drawings, it is impossible to express all the rooms and spaces of the building within one section view in this way. Moreover, it is difficult to grasp which line of the network goes by which room or space when the network of MEP systems is overlaid on the section view. Therefore, the layer of each element that was in the range of less than 7 m from the cutting-plane line was distinguished when the network of MEP systems was extracted as the SCR file. The distance 7 m was decided after the shape of the plan view for Building 5C was considered.
Layout of extracted data
Next, the schematic diagram of the duct system was generated on Autodesk AutoCAD software using the extracted files. Autodesk AutoCAD is highly compatible with Revit and is widely used in the AEC industry. The procedure to generate the schematic diagrams is shown in Figure 7.
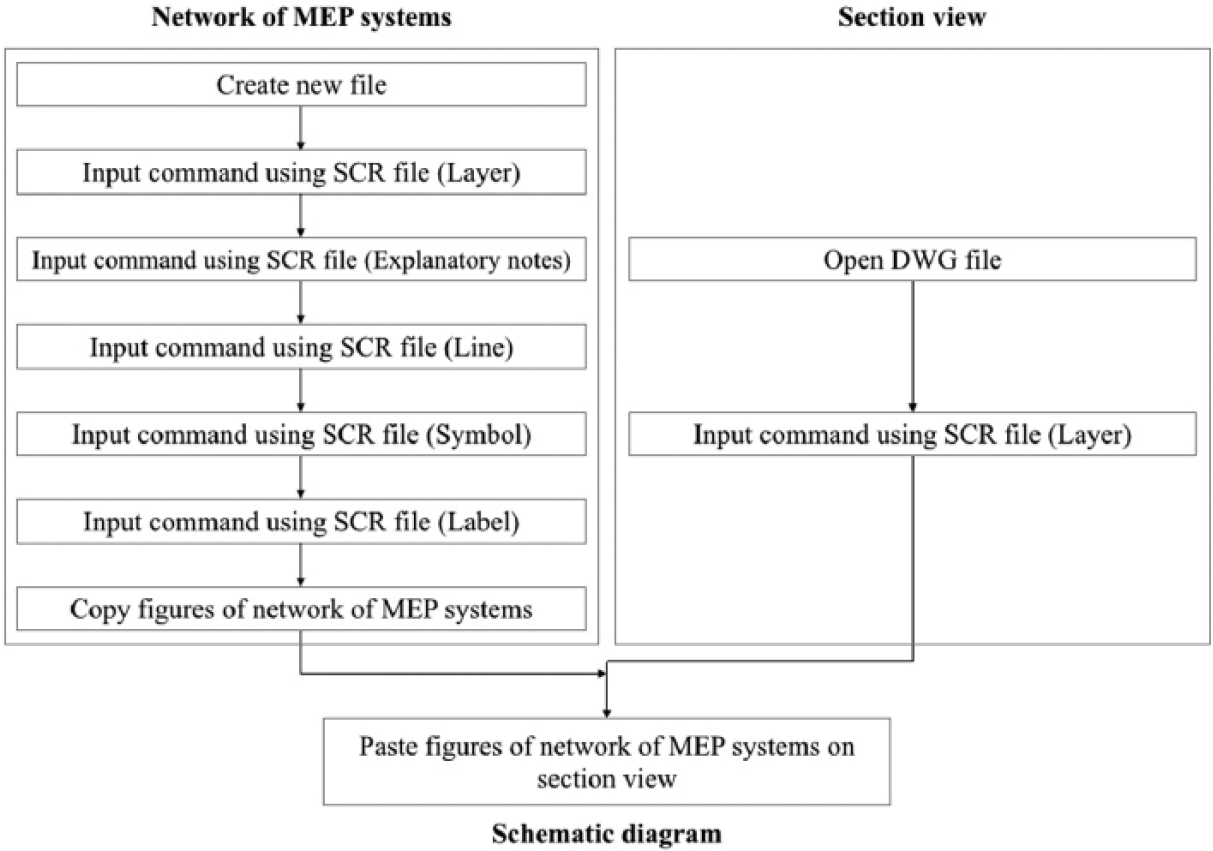
Procedure for generating schematic diagrams on CAD software.
Network of MEP systems
A new file was created for the network of MEP systems. Before operations with the extracted SCR were executed, operations that recorded the setting of layers and the setting of explanatory notes in the SCR files were carried out. For these two extracted script files of layer setting and explanatory notes, the attribute information of MEP elements extracted from Autodesk Revit was used as a reference, and they were made using documentation software. Then, operations with the script files, which were exported from Autodesk Revit, were conducted in the order of lines, symbols, and labels. Thus, the network of the MEP systems was represented.
Overlaying network of MEP systems on the section view
The section view was displayed by opening the exported DWG file. Then, operations with the script file, which recorded the setting of layers for the section view, were executed. The layers used for the section view were set so that the section view would not stand out in comparison with the network of MEP systems. For example, the color of the lines was set in only one color, and the thickness of lines was unified to be thin and one kind. After the section view was revised, all the figures of the network of the MEP systems were copied and pasted on the section view. When these figures were pasted, they were put at the same coordinate position of the original file. In this way, the schematic diagram was generated in AutoCAD by overlaying the network of the MEP systems on the section view. Because the schematic diagram was generated as CAD format, it is possible for everyone to edit it.
The schematic diagram shown in Figure 8 is the entire image. The magnified image is displayed in Figure 9, and the explanatory notes of the diagram are shown in Figure 10. Spellings of attribute information shown in the software were used in the explanatory notes. The expressions of the lines included in the range within each 7 m from the cutting-plane line in the 3D models were changed. The expressions of the lines can be confirmed by enlarging part of the schematic diagram. The line whose expression was changed indicates the pair of elements located near the cutting-plane line.
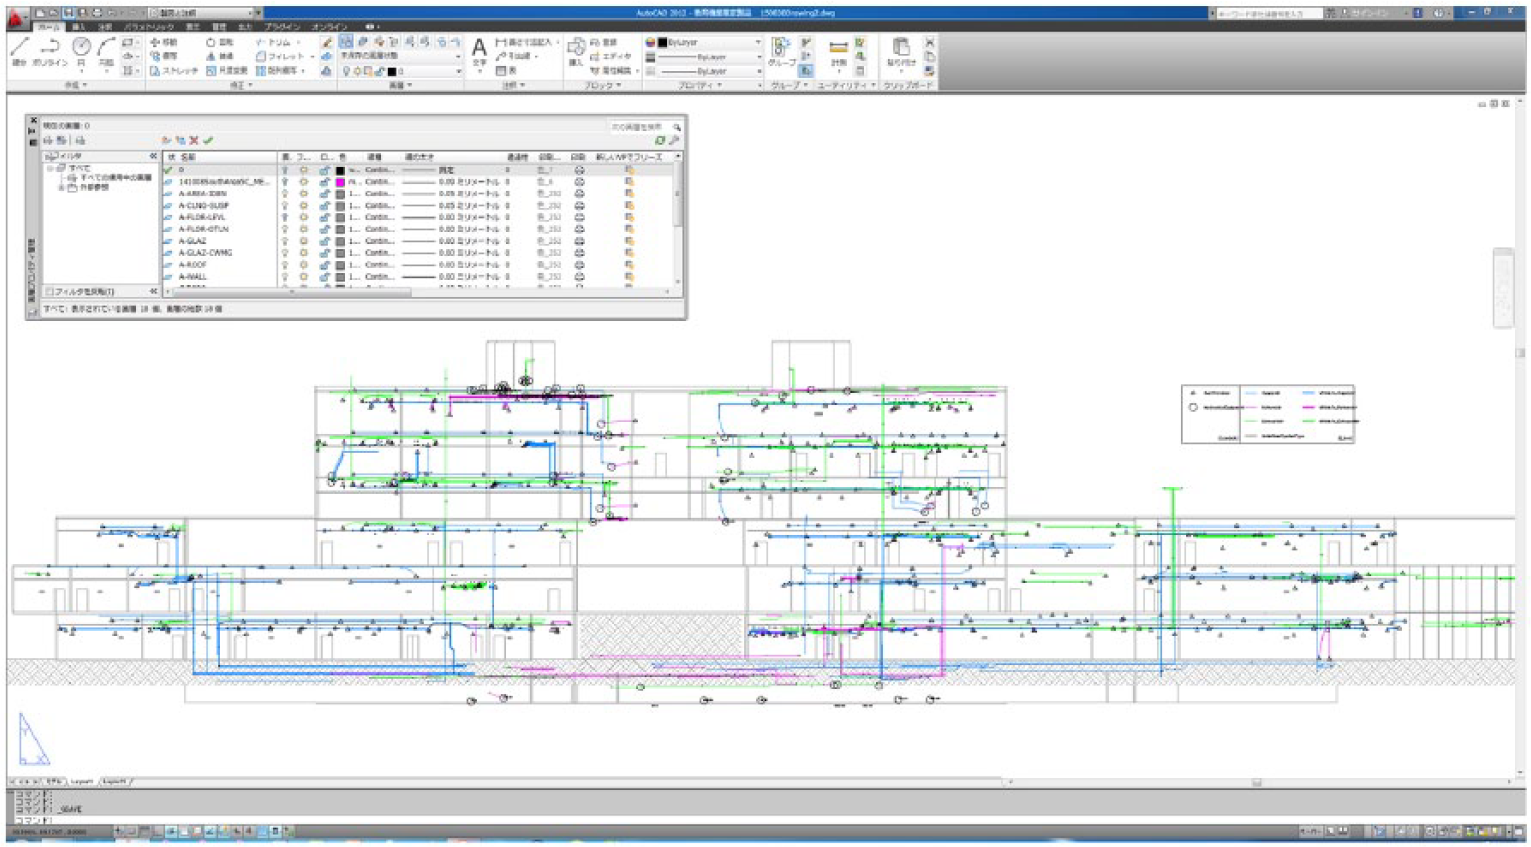
Schematic diagrams of the air duct system generated by the proposed method.
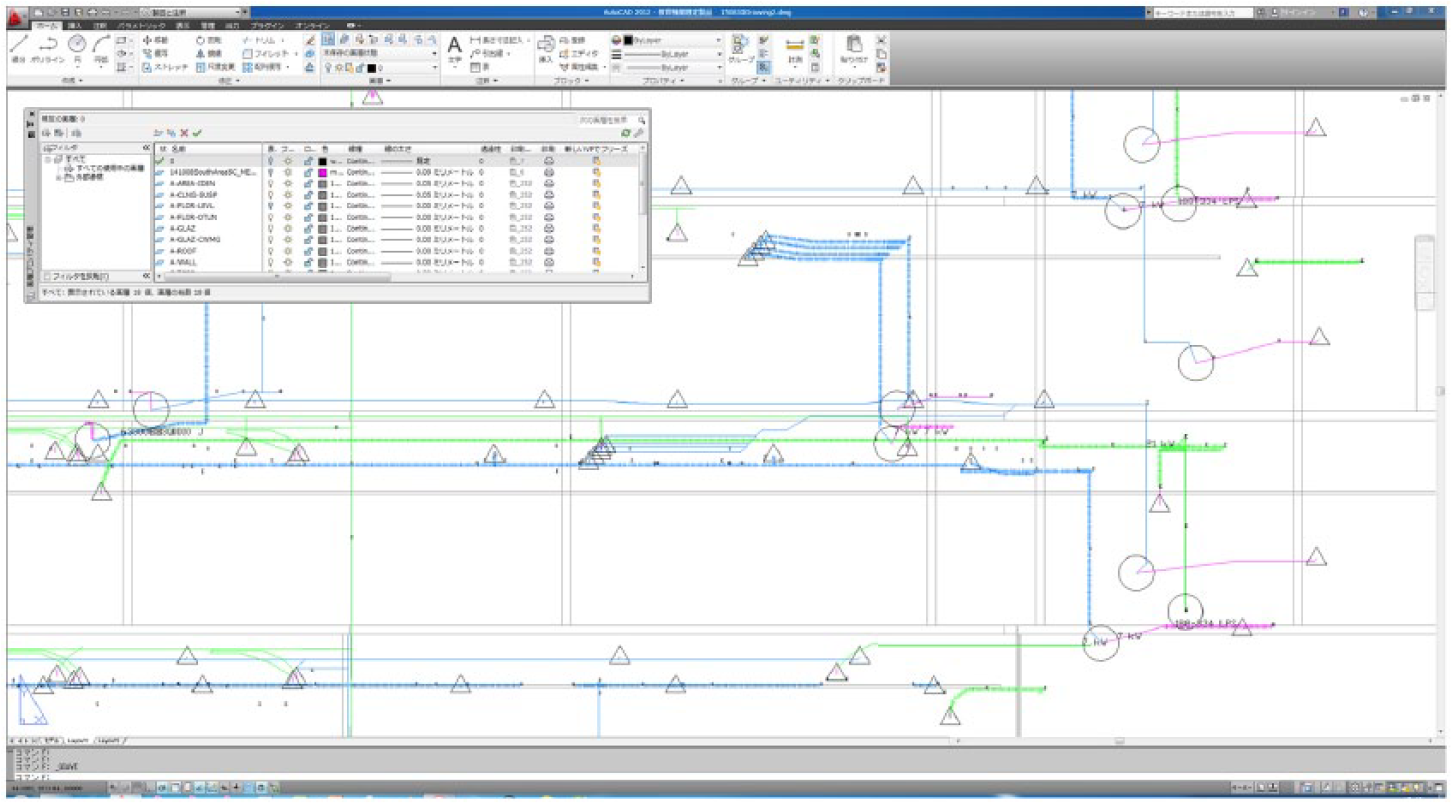
Magnified image of the schematic diagrams shown in Figure 8.
Explanatory notes of the schematic diagrams.
Evaluation of generated schematic diagrams
The generated schematic diagram was evaluated by staff members of the University of Tsukuba’s Department of Facilities. The interview with staff members who were working on the maintenance of buildings on the Tsukuba campus was conducted for the evaluation.
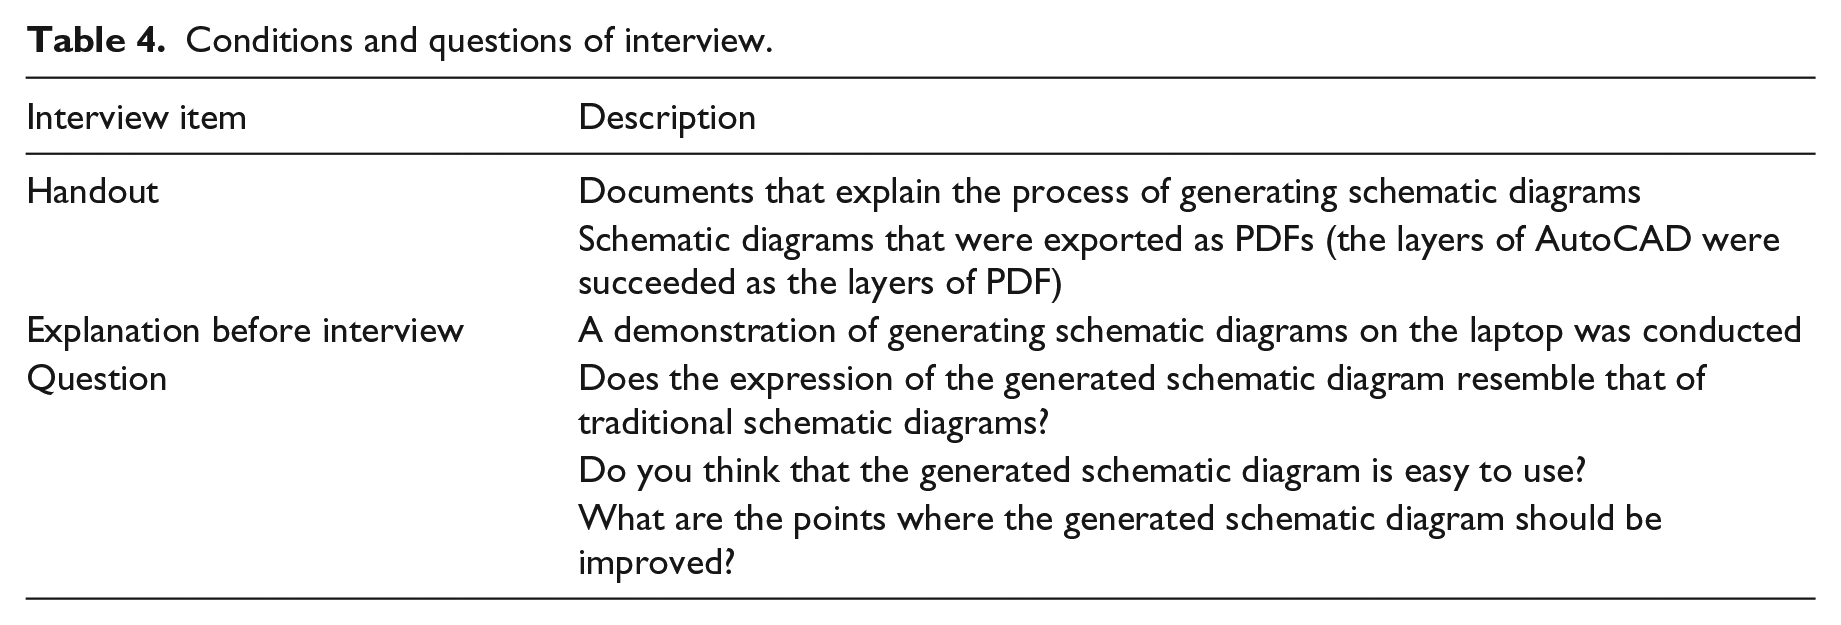
The conditions and questions of the interview are shown in Table 4. Before the interview, handouts were distributed to the respondents. In addition, the respondents watched a demonstration of generating schematic diagrams on a laptop operated by the authors. The interview was carried out in August 2015, and opinions were heard from four people (two specialized in air conditioning/plumbing, one in electrical, and one in architectural/structural).
Conditions and questions of interview.
In the opinion of some members, the expression of spaces in the schematic diagram was not like that of traditional drawings when the two kinds of drawings were compared. The difference between the two drawings was caused by a change in the expressions of some lines and by using the section view. As for whether it was easy to use the generated schematic diagram, they told us that they would have no problems if the procedure of generating schematic diagrams was explained beforehand. However, they told us that the construction workers who used traditional diagrams might have a different opinion. One interviewee answered that it was necessary to revise the expression of each plan view of the MEP systems corresponding to that of the generated diagram. They often use each plan view and the schematic diagram of MEP systems in combination. Therefore, the schematic diagram became more understood by revising the expression of the plan view of MEP systems.
From the interview, it was confirmed that the schematic diagram would be understandable. On the other hand, some points that should be improved regarding the expression of the schematic diagram were confirmed. In addition, for the best expression of the schematic diagram, it is necessary to hear opinions of not only staff members of the university but also construction workers.
Conclusion
In this study, schematic diagrams were expressed by overlaying the network of MEP systems on the section view extracted from 3D models on AutoCAD software. The network of MEP systems was described in SCR files using the attribute information of the MEP elements. The network of MEP systems was expressed using these files on AutoCAD software. To express the building skeleton, rooms, and spaces, the section view was adopted for schematic diagrams. After each drawing was created, the network of MEP systems was put on the section view. The generated schematic diagrams were evaluated by staff members in the facilities department of a university. In interviews, the schematic diagrams were considered to be helpful or useful, but some points that should be improved were noted.
The opinions received from staff members will be used to improve the expressions of schematic diagrams. As future work, it is important to receive opinions of other staff members and construction workers to rearrange expressions of the generated schematic diagrams. Rearranging the process and improving the interface on Revit software are necessary to enable many people to employ the system more easily. Then, consideration of the expression of plan views of MEP elements will be needed because plan views of MEP systems are a part of MEP drawings and include schematic diagrams. On the other hand, it is important that various output methods be available for generating MEP schematic diagrams. If the use of BIM software becomes widespread in maintenance, it will be necessary to generate future MEP schematic diagrams within BIM software.
In the conservation of existing buildings, the use of 3D models created by BIM will increase steadily in the future. Consequently, it is necessary to consider the period of learning the techniques of BIM because many engineers with traditional training are now used to understanding 2D drawings. It is important that 3D models created using BIM be able to generate drawings similar to existing 2D drawings. Also, it must be possible to apply the expressions of these suggested schematic diagrams to not only the duct system but also the piping system and other systems. For these systems, it is necessary to select appropriate elements and attribute information. The option for 3D models of MEP systems to also produce familiar schematic drawings is attractive, and it is expected that the number of engineers who can use BIM data will increase in the maintenance of existing buildings.
Footnotes
Declaration of conflicting interests
The author(s) declared no potential conflicts of interest with respect to the research, authorship, and/or publication of this article.
Funding
This work was supported by Japan Society for the Promotion of Science (JSPS) KAKENHI Grant Number JP15J01014.