
Abstract
The assessment of screening accuracy and setting of cut points for a universal screener have traditionally been evaluated using logistic regression analysis. This analytic technique has been frequently used to evaluate the trade-offs in correct classification with misidentification of individuals who are at risk of performing poorly on a later outcome. Although useful statistically, coefficients from a multiple logistic regression can be difficult to explain to practitioners as it pertains to classification decisions. Moreover, classifications based on multivariate assessments are challenging to understand how performance on one assessment compensates for performance on another. The purpose of this article is to demonstrate and compare the use of logistic regression with classification and regression tree (CART) models in the identification of students who are at risk of reading comprehension difficulties. Data consisted of 986 Grade 1 students and 887 Grade 2 students who were administered a screening assessment at the middle of the school year as well as the 10th edition of the Stanford Achievement Test. Results indicated that CART performs comparably with logistic regression and may assist researchers and practitioners in explaining classification rules to parents and educators.
The early identification of at-risk readers has become a ubiquitous process in both the academic and state policy arenas (Fuchs, Fuchs, & Hamlett, 2007; Johnson, Jenkins, & Petscher, 2010). Universal screening, especially, serves as early warning systems (EWSs) of risk assessment for a variety of outcomes, but particularly reading. Although the terminology of “early warning system” is frequently associated with the identification of students who are at risk of dropping out of high school (e.g., Davis, Herzog, & Legters, 2013; Neild, Balfanz, & Herzog, 2007), it may be viewed more broadly to characterize sets of assessments, which are used to classify students who are at risk or not at risk of a particular benchmark (e.g., school dropout, being classified as having a learning disability).
Despite a difference in nomenclature, what underlies EWSs, universal screening, and early identification is typically a common methodology for relating scores from an assessment at one point in time to performance above or below a specified cut point on a future assessment. Many studies focused on developing EWSs or evaluating the diagnostic accuracy of universal screeners employ logistic regression, receiver operating characteristic curve (ROC) analyses, or a combination of both methods (e.g., Adlof, Catts, & Lee, 2010; Bridges & Catts, 2011; Hintze, Ryan, & Stoner, 2003; Nelson, 2008; Petscher & Kim, 2011; Piasta, Petscher, & Justice, 2012; Roehrig, Petscher, Nettles, Hudson, & Torgesen, 2008; Shapiro et al., 2008; Speece et al., 2011). Within this area of screening research, a commonality among the studies in addition to methodological similarities is that screening or diagnostic accuracy is evaluated in the context of univariate rather than multivariate assessment. For example, Roehrig and colleagues (2008) used ROC curves to evaluate the classification accuracy of Dynamic Indicators of Basic Early Literacy Skills (DIBELS) oral reading fluency with a standardized reading comprehension outcome. Alternatively, work by researchers such as Shapiro et al. (2008) showed that a multivariate combination of DIBELS oral reading fluency and a measure of reading comprehension jointly predicted performance at a cut point on a state achievement test better than univariate predictions. Also, Catts and colleagues (2001) used logistic regression with five predictors to predict at a cut point on later comprehension outcomes. An outworking of the study was that the authors provided the logistic regression equation and demonstrated how the model coefficients could be used to calculate the probability of reading difficulties for students. A particular tension when moving from research to practice with multivariate screening accuracy is that logistic regression may be challenging to implement in school contexts. That is, even where logistic regression and ROC curve analyses may provide better screening accuracy, requiring teachers, school psychologists, and paraprofessionals to compute log-odds values from generalized linear model equations and convert to odds ratios or predicted probabilities could raise implementation and interpretive challenges (e.g., compensatory nature of weights in logistic regression). An alternative methodology, called classification and regression tree analysis (CART; Compton, Fuchs, Fuchs, & Bryant, 2006; Fuchs, Compton, Fuchs, Bryant, & Davis, 2008; Fuchs et al., 2007) is a potentially useful method both analytically and in practice for classifying individuals as at risk or not at risk with multivariate screening.
Estimation in EWSs
As noted previously, common methods employed for validating screeners for use as EWSs include logistic regression and ROC curve analysis. A distinguishing feature of these methods is that they are parametric models, meaning that they make assumptions about the underlying data. Unlike logistic regression, ROC curve analysis, or even more basic approaches to screening like point biserial correlations, the CART model is a nonparametric approach that does not make any distributional assumptions, does not require any functional form for the predictors, and does not assume additivity of the predictors, which allows for the identification of complex interactions (Buchner, Wasem, & Schillo, 2017). A particular benefit of the nonparametric tree-building approach of CART is that interactions between predictors do not need to be a priori specified and entered into the equations as in parametric linear or nonlinear models. Rather, interaction effects are explored via the CART system during the tree splitting process. This noted advantage has led researchers to conclude that regression tree models hold significant promise for improving prediction equations (Strobl, Malley, & Tutz, 2009). Moreover, research has demonstrated that CART modeling maintains a superior advantage over methods such as logistic regression in dealing with multicollinearity due to its ability to use advanced resampling procedures (Hayes, Usami, Jacobucci, & McArdle, 2015).
CART models are predominantly found in medical applications (i.e., diagnosis and prognosis of illnesses) such as the case reported by Jarvis et al. (2013), who applied a CART model in the development and validation of an EWS for hospital mortality in emergency medical admissions. The authors stated the existing EWS that was rooted in logistic regression had little utility due to the complexity of the calculations required to apply the formulas based on seven independent variables. However, by leveraging a CART model, they were able to develop a simpler paper-based classification system to discriminate in-hospital mortality. In the context of educational research, CART is still emerging but with limited application. Compton et al. (2006) compared a CART model with logistic regression in the identification of early warning signs of at-risk readers in Grade 1 and found that the diagnostic accuracy of the CART model was significantly better than the logistic regression prediction model. Rumberger and Lim (2008) reviewed studies published over a period of 25 years that analyzed predictors of high school dropout and graduation for EWSs. Of the 203 studies that met the criteria, 389 analyses were conducted—the majority of which were logistic regression—and none used CART models. Such findings suggest that although the technique is available and has been used in limited instances, more research is necessary to fully understand its capabilities and utility as it pertains to screening in education research.
CART
At its most basic level, a CART model classifies individuals into mutually exclusive subgroups of a population using a nonparametric approach that results in a classification tree (Breiman, Friedman, Olshen, & Stone, 1984). CART algorithms search for the optimal split on a set of one or more predictor variables and partition the sample into binary subsamples called nodes. The sequence of sample partitions within CART models that classify individuals into nodes are called decision rules (Kotsiantis, Zaharakis, & Pintelas, 2007). For example, suppose that we have 100 students with data on four hypothetical screening assessments that all have score ranges of 100 to 1,000, as well as an outcome assessment with a pass/fail indicator (see Figure 1). When a split within the sample occurs on one of the assessments (e.g., Test 1), the nodes form either a rectangular box or a circle. A box designates a final classification based on that portion of the diagram, and is referred to as terminal node, whereas circles are referred to as nonterminal nodes. These nonterminal nodes are indicative of instances where optimal classification may occur based on the data from another assessment used to predict risk. From this illustration, the rectangular boxes denote that there is one rule for identifying students as at risk and two rules for identifying students as not at risk of failing the outcome assessment. Rules are derived using the criterion specified in each nonterminal node followed with a “yes” or “no” answer. The rule for identifying students as at risk is based on students who score less than 244 on Test 1 and less than 350 on Test 2. The two rules whereby students may be classified as not at risk are (a) a student who scores equal or greater than 244 on Test 1 or (b) a student who not only scores less than 244 on Test 1 but also scores greater than or equal to 350 on Test 2. In this way, the compensatory aspect of CART classification is readily observed as not all students who score less than 244 are immediately classified as at risk. For those individuals who are less than 244 on Test 1 but have higher scores on Test 2 (⩾350), classification as being at risk is avoided because their higher Test 2 scores compensate for lower Test 1 scores.
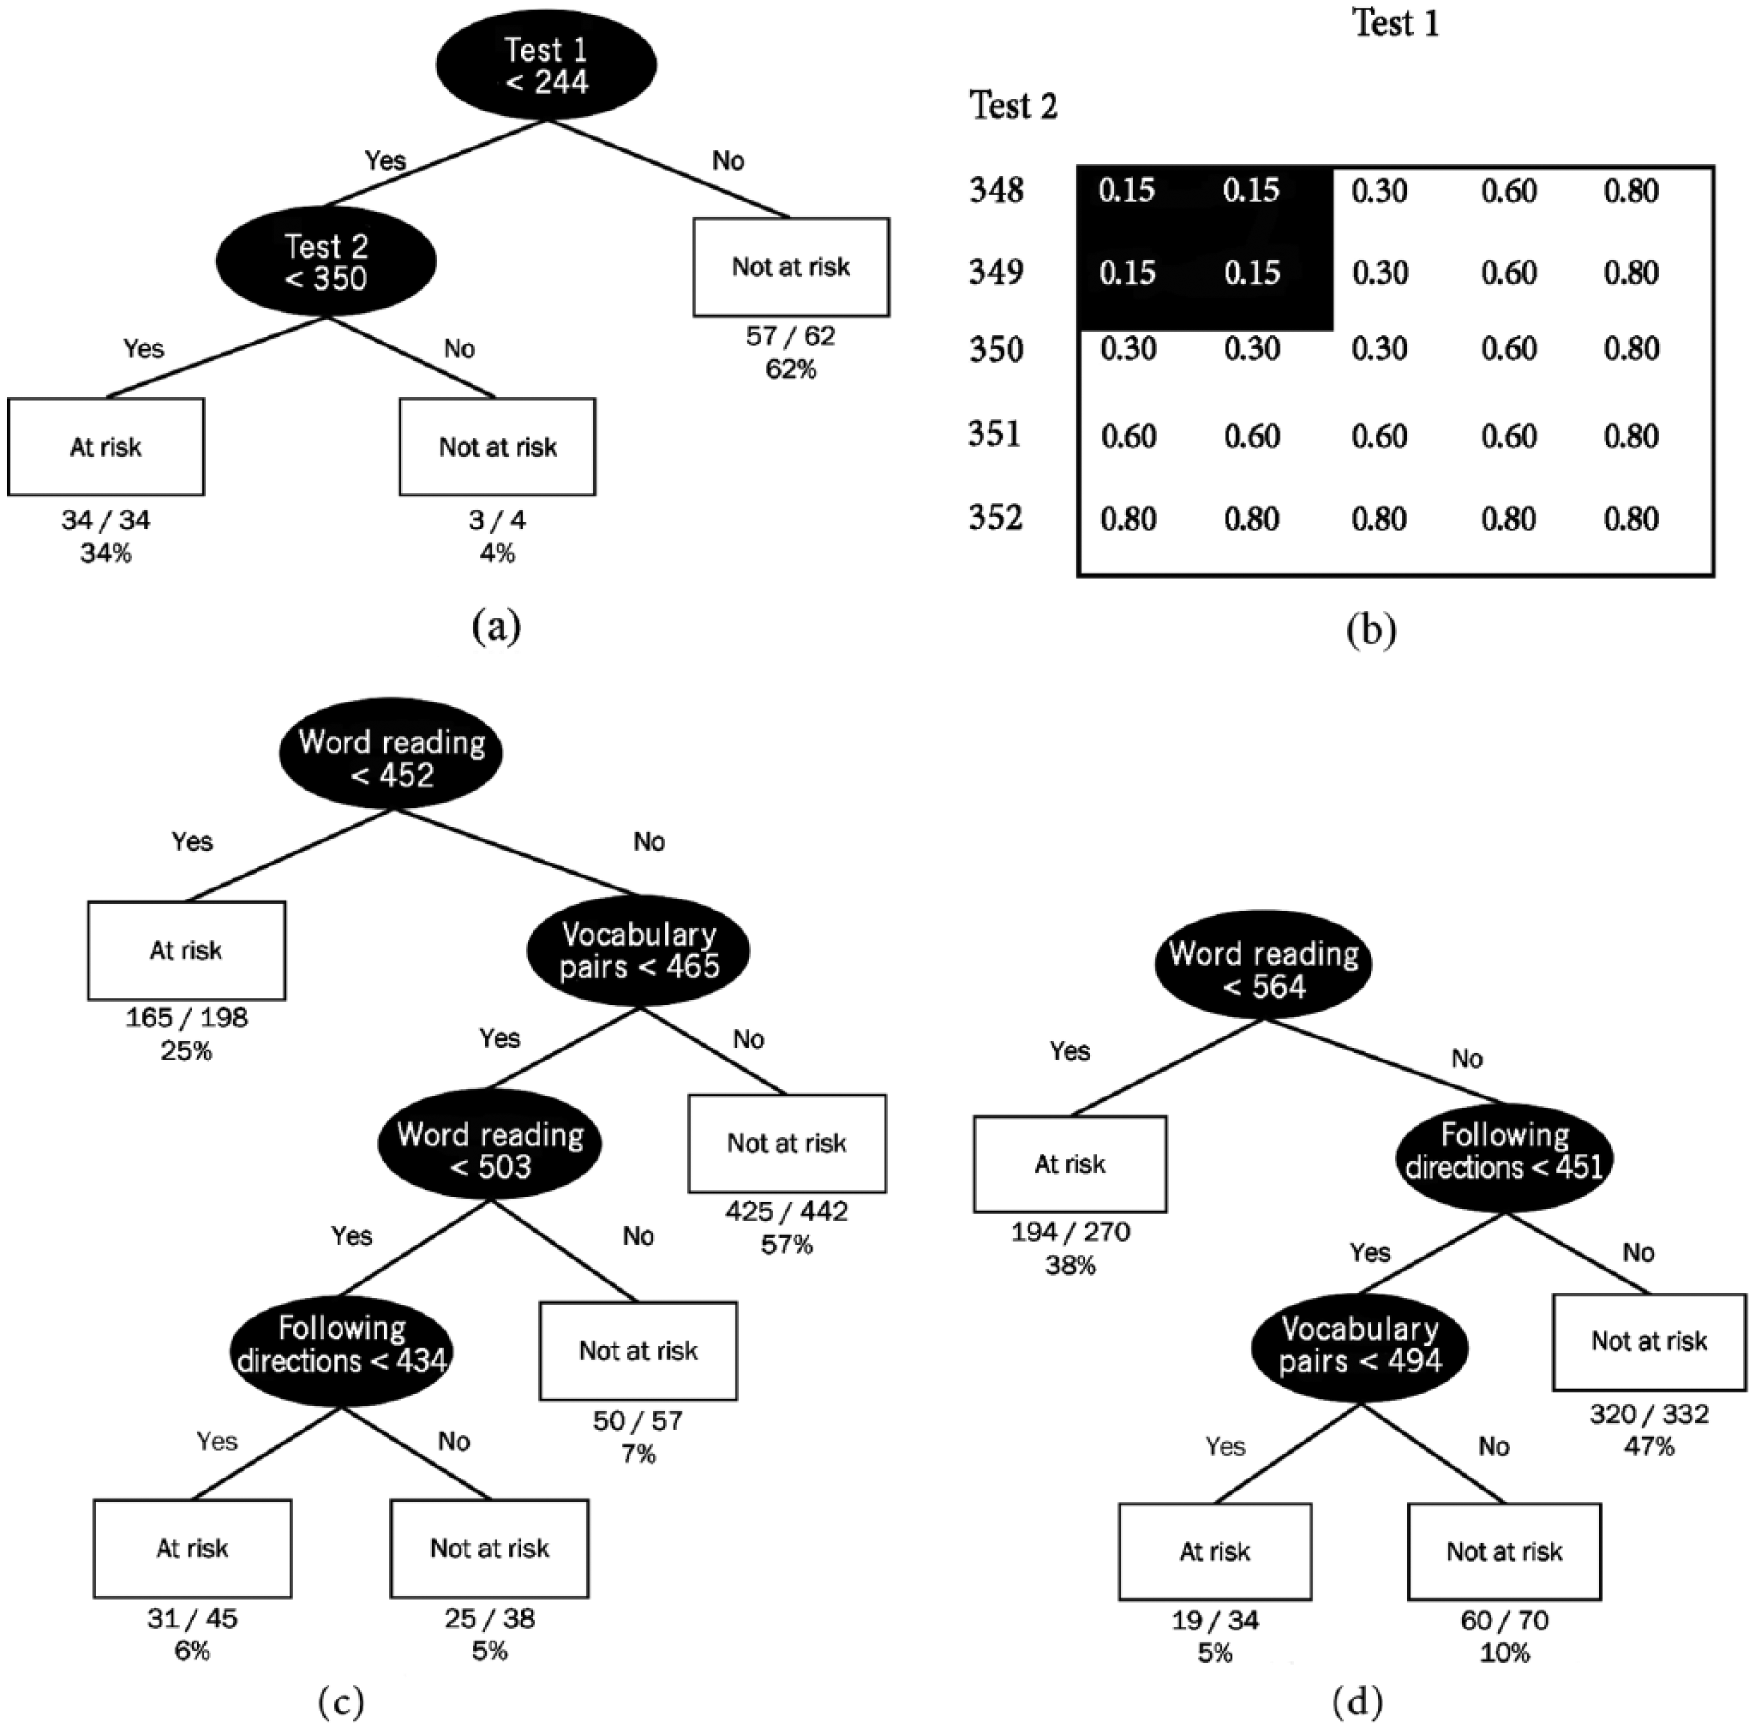
Sample (a) CART chart and (b) logistic regression contingency table; CART classification rules for (c) Grade 1 and (d) Grade 2.
In addition to the rules by which a student is classified as at risk or not at risk, Figure 1 provides information on the classification accuracy of the tree. Under each of the three terminal nodes of Figure 1 (i.e., the rectangles), a ratio is provided that designates the number of students correctly identified, in the numerator, out of the total number of students in that node. For example, 34 students with Test 1 scores less than 244 and Test 2 scores less than 350 are correctly identified as at risk, because all students meeting this rule failed the outcome assessment (i.e., 34/34); thus, 100% of students in this node were correctly classified as at risk. The percentage that appears below the ratio is the percentage of students in the total sample who were in the terminal node; 34 students in this terminal node out of the total number of 100 in the sample then constitute 34% of the sample. Following the example to completion, there are four students (4% of the total) who have Test 1 scores less than 244 and Test 2 scores equal to or greater than 350, putting them in a not-at-risk category. However, only three students out of the four are correctly identified (i.e., passed the outcome assessment), with the remaining student representing a false negative (i.e., predicted to pass but failed). Similarly, 62 students have scores equal to or greater than 244 on Test 1 and are classified in a not-at-risk category, and five of the 62 students are incorrectly identified and, therefore, represent additional false negatives.
Subgroup splits in the CART model are determined by the software program (e.g., the R rpart package) to improve the overall classification accuracy. The CART model uses an exhaustive subgroup comparison to identify the best predictors and predictor levels that most efficiently split the sample into the most homogeneous subgroups of individuals who are identified as at risk or not at risk based on their observed scores. Note that in our hypothetical example, we noted that we suppose four assessments were administered; yet, only two of them were shown in Figure 1. There are two points to make about this observation. First, just as in logistic regression, it is possible that scores from one or more predictors are not significant contributors to understanding individual differences in classification, which results in those variables not appearing in the CART model based on the splitting algorithm. Moreover, it is possible that a variable may appear in the CART model many times because the search for the single variable that will result in the best subsequent split to the data includes all variables at each split. Like other statistical methods, the principle of parsimony is applicable to CART models. This principle suggests that the simplest model that fits the data is often the best model. In a CART model, this principle is applied by “pruning” the classification tree. Second, the representation in Figure 1 of the assessments (i.e., Tests 1 and 2) demonstrates the splitting rules that lead to a decision and have no bearing on the ordering or administration of the assessments (i.e., Test 2 does not need to follow Test 1 in administration).
Although the literature is mixed about formal stopping rules for CART, several authors (e.g., Hayes et al., 2015) have outlined various heuristics one may use in the selection of a final CART model, including node impurity, minimum of splits, maximum tree depth, loss matrix identification, and minimum complexity parameter. The minimum split parameter specifies the minimum number of cases that must exist in a node for a split to be attempted; increases in the minimum split generally decrease the number of splits. The maximum split parameter denotes the limit of how large the decision tree can grow before node impurity exists. A loss matrix is used to weight classification errors differently. For example, to increase the negative predictive value, the specification would be to view false negatives as more costly. The default specification is to weight all classification errors equally. The amount of weight to apply to a type of error is a decision that is based on the inherent costs associated with misclassification (Lewis, 2000).
Last, a minimum complexity parameter value dictates the minimum decrease in the overall lack of fit that must result by an additional split. Within CART, fit is measured by the model’s relative error, which is equivalent to 1 – R2, as well as the relative error found in the cross-validation samples (i.e., the cross-validation relative error) by the number of splits. Where the complexity value becomes critical to model selection is the trade-off between model bias and variance. That is, as model complexity increases, bias reduces but variance increases. Creating a training data set on which a portion of the sample (e.g., 80% random sample) has the CART algorithms calibrated allows for an empirical test of generalizability via the cross-validation portion of the sample (i.e., the remaining 20% of the sample). The process of model pruning via changing the minimum splits and maximum tree depth will allow the user to better identify stable classifiers. A recommended minimum standard is the value of the complexity parameter that results in a cross-validation relative error less than one standard error above the minimum cross-validation relative error (Therneau, Atkinson, & Ripley, 2013). Tables and plots of the cross-validation results can be consulted to determine an appropriate complexity parameter value. The use of this model-based statistic as a splitting criterion changes the model to an essentially nonparametric approach (Harrell, 2001).
Logistic Regression
What is more readily familiar to persons who evaluate screening accuracy is logistic regression, whereby a dichotomously scored dependent variable is regressed on one or more selected independent variables. This technique is widely used not only to predict log-odds of success on the dependent variables but also to study the rates of true and false positives and negatives as they pertain to the classification of individuals as at risk or not at risk of achieving success. This approach relies on empirically estimated coefficients, Euler’s constant (the base of the natural log[e] equal to 2.718), and the transformation of log-odds to a predictive probability. Results are a by-product of the following type of equation:

The beta coefficients (i.e.,
Similar to what is seen in Figure 1, students with Test 1 scores less than 244 and Test 2 scores less than 350 are identified as at risk (via shading), whereas other students are identified as not at risk. This particular example demonstrates that logistic regression or CART could be used interchangeably to explain classification decisions; yet, this is partly due to the inclusion of only two predictors in the model. In such instances, a CART flowchart or a contingency table of predicted probabilities can be used and explained quite easily about how performance is related to risk. As the model complexity increases via the inclusion of more predictors, contingency tables from a logistic regression or even the beta coefficients from the equation are more difficult to explain and show how scores lead to classification decisions. It is possible that controlling for the classification accuracy of the model, CART may be a viable alternative for universal screening as it allows researchers and practitioners to easily see classification rules and potentially identify areas that are more malleable to instruction or intervention.
Purpose of the Present Study
A CART model approach to early identification systems in education could maintain numerous benefits from both statistical and practical vantage points. Although a number of published studies have evaluated CART with other methods of early identification, the corpus of findings in this area is limited especially in education. Subsequently, a goal of this study is to add to the body of literature and increase the awareness of the utility of CART for education so that others may view the merit of each application. This study used data from a sample of students in Grades 1 and 2 in Florida public schools during the 2012–2013 academic year to answer the following research question:
Method
Participants
Study participants were Grades 1 (n = 1,028) and 2 (n = 918) students from Florida. An evaluation of the data revealed that 42 cases in Grade 1 and 31 cases in Grade 2 should be removed due to the presence of univariate and multivariate outliers. The final data sets consisted of 986 Grade 1 and 887 Grade 2 students. Demographic characteristics for Grade 1 students indicated that 45.9% were White, followed by 28.8% Hispanic, 12.8% Black, 6.3% Asian, and 6.2% multicultural. Similarly, 44.6% of Grade 2 students were White, 29.7% Hispanic, 15.2% Black, 5.3% Asian, and 5.2% multicultural.
Measures
Florida Center for Reading Research (FCRR) reading assessments (FRA; Foorman, Petscher, & Schatschneider, 2014)
FRA screening assessments consist of computer-adaptive alphabetic and oral language tasks designed to be administered at different grade levels. In this study, the tasks administered by grade level were as follows: word reading (Grades 1 and 2), word building (Grade 1), spelling (Grade 2), vocabulary pairs (Grades 1 and 2), and following directions (Grades 1 and 2). The word reading task requires students to pronounce each word displayed on the screen. In the word building task, the student sees a word on the screen and is asked to manipulate individual letters at the bottom of the screen to change the word into a different word. The student types a word pronounced by the computer in the spelling test. In vocabulary pairs, three words are displayed on the screen and read aloud and the student is required to identify the two words that go together (e.g., /dark/, /night/, /swim/). And, in the following directions task, the student is required to listen and attend as he or she hear single and multistep directions from the computer. The student then must respond to the directions by clicking on or moving the specified objects on the computer screen (e.g., put the square in front of the chair and then put the circle behind the chair). FRA tasks are scored using a scale of 200 to 800 (M = 500, SD = 100). Marginal reliability estimates for the FRA tasks range from .85 to .94 in Grades 1 and 2 (Foorman et al., 2014).
Stanford Achievement Test–10th Edition (SAT-10; Harcourt Assessment, 2004)
The SAT-10 reading comprehension subtest was used as the reading comprehension outcome measure. The reading comprehension subtest assesses students’ reading achievement using conceptually appropriate literary, informational/expository, and functional text followed by questions (Harcourt Assessment, 2004). Internal consistency reliability coefficients for spring testing in Grades 1 and 2 were found to be .91. Scores on the reading comprehension subtest were reported as national percentile ranks.
Procedure
Students were individually administered each of the FRA subtests in the context of planned missing data design to reduce testing burden on the students. Assessments were given between December 2012 and January 2013 for the FRA. The SAT-10 was administered by the district in April 2013 and the data were obtained through the local school district as this test was given district-wide to all students.
Data Analysis
Grade-based correlations among the FRA task scores from the individual literacy components were examined for multicollinearity in each of the grade-level imputed files. None of the Pearson correlations was higher than .80, eliminating concerns of redundancy in the subsequent logistic regression analyses. Following this step, the SAT-10 scores were dummy coded to such that scores below the 40th percentile were coded as 1 for “at risk” and 0 for “not at risk.” A previous report by the American Institutes for Research (2007) demonstrated that the 40th percentile represents a reasonable grade-based target for proficiency in Grades K through 2. The final data sets for each grade were then split into a calibration data set, consisting of a random sample of 80% of the students in each grade, and a validation data set, consisting of the remaining 20%. An 80/20 split is a common division in statistical learning and data mining when conducting cross validation (Salford Systems, n.d.). Both the CART and logistic regression models were based on the exact same data sets, with the models built on the calibration data set and tested on the validation data set.
The two methods were evaluated using sensitivity (proportion of true positives), specificity (proportion of true negatives), positive and negative predictive value, and overall correct classification (OCC) measured at a specific cut point, as well by the ROC area under the curve (AUC) index that is useful for diagnostic accuracy for full range of scores from a screener. Researchers have proposed different threshold values for sensitivity and specificity; many seek levels of at least .80, and some recommend at least .90 (Compton et al., 2006; Jenkins, 2003). Jenkins (2003) suggested that screening assessments should demonstrate a negative predictive value of .90 to .95 and a sensitivity level of .90 to .95. Developers of EWSs are sometimes interested in maximizing the negative predictive value while maintaining high overall classification accuracy (Petscher, Kim, & Foorman, 2011). Other researchers have offered interpretative frameworks for classification indices including Glover and Albers (2007), who identified a goal of .75 to .80 across sensitivity, specificity, and predictive value indices; as well as Kettler and Feeney-Kettler (2011), who provided suggested thresholds and substantive interpretations for a range of indices. The goal of this strategy is to minimize false negatives (i.e., not underidentifying students so that at-risk students can receive timely interventions). For example, the norming of the dependent variable used in this study sought to maximize a negative predictive value of .85 when aligned to the 40th percentile of the SAT-10 reading comprehension test (i.e., no more than 15% of students are underidentified). However, it should be noted that to gauge the diagnostic accuracy over the full range of screener scores, it is critical to attend to the AUC index (Smolkowski, Cummings, & Strycker, 2016).
Logistic regression
The logistic regression models in this study were developed in a hierarchical manner. Based on the correlations between the individual FRA tasks and the dichotomized SAT-10 variable, the FRA tasks were entered into the logistic regression ordered by correlational magnitude. FRA tasks that added at least 2% unique variance above the test already in the model, as measured by the Nagelkerke pseudo R2, were retained for the final classification model from the logistic regression. Cohen (1992) has shown that an R2 between 2% and 13% represents a small, practically important contribution to explained variance. This same standard was applied to the increase in Nagelkerke pseudo R2, which is estimated by means of maximum likelihood in logistic regression and can be interpreted in the same way as the R2 estimated in an ordinary least squares regression.
CART
CART models assessed the individual performance of each FRA task, at every available cut point, in classifying students into risk and no-risk categories. To ensure a parsimonious model, several specifications were evaluated to achieve a termination point in the modeling process. A minimal split size of three students was made, a decision guided by Compton et al. (2006). In addition, the number of splits was limited by specifying a minimum reduction in the cross-validation relative error (i.e., a complexity parameter), identified after running a base model with no minimum specified. Each grade-based model included 10-fold cross validation (i.e., v = 10) for the purpose of evaluating the quality of the prediction tree and determining the appropriate minimum complexity parameter (Breiman et al., 1984). The value selected for the complexity parameter was the value resulting in the fewest number of splits with a cross-validation relative error less than one standard error above the minimum cross-validation relative error. Plots of the cross-validation relative error against complexity parameter values were consulted for this decision. In the process of using the CART model, the intention was to build and prune trees based on setting the floor negative predictive value of .85 (i.e., ensure the negative predictive value was at least .85). To accomplish this, revisions to the model in Grade 2 included the specification of a loss matrix. Logistic regression analyses were run using SPSS Statistics 21 and CART analyses were run using the R 2.15.3 package rpart.
Results
Descriptive Statistics
An analysis of missing data in the final data sets revealed that each test had less than 10% missing data (see Table S1; online supplementary materials). To address the missing data, multiple imputation with SAS 9.4 software was used to create a data set with complete cases for all variables. Logistic regression can analyze and summarize multiple imputed data sets, but there is no accepted procedure for analyzing and summarizing classification trees generated from multiple imputed files. Therefore, a decision was made to conduct 20,000 imputations and then use the mean imputed value for each missing value (Lang & Little, 2014). The difference between means calculated prior to and after imputation for each screening assessment was found to be trivial as evidenced by Cohen’s d effect sizes ranging from .00 to .04 (Cohen, 1992). Correlations among the measures are reported in Table 2 and suggested medium to large relations.
Grade 1
Logistic regression
Based on the correlations between the FRA tasks and performance on the SAT-10 (see Table S2; online supplementary materials), the FRA task scores were entered into the logistic regression ordered by correlational magnitude beginning with word reading, followed by word building, vocabulary pairs, and following directions. Due to the minimal increase in the explained variance based on the Nagelkerke pseudo R2 (1.7%), the following directions test was deleted from the model, resulting in a Nagelkerke pseudo R2 of 72%. The resulting classification accuracy based on the multiple logistic regression is reported in Table 2. It is important to note that without using ROC curves or attempting to maximize a particular index, classification accuracy in logistic regression is often, by default, based on any categorizing any student with a predicted log-odds greater than or equal to 0 as not at risk and those with a log-odds less than 0 as at risk. With this understanding, the classification accuracy for the logistic regression yielded a sensitive (SE) value of .87, indicating that 87% of students who were below the 40th percentile of SAT-10 were identified as at risk on the screen (i.e., log-odds < 0). The specificity (SP) of 0.90 indicated that 90% of all students who were at or above the 40th percentile of the SAT-10 were correctly identified as not at risk on the screen (i.e., log-odds ⩾ 0). The false positive (FP) and false negative (FN) rates of 10% and 13%, respectively, reflected the overidentification and underidentification errors. Positive predictive value (PPV) was .78, indicating that 78% of all students identified as at risk by the screen scored less than the 40th percentile on the SAT-10, and negative predictive value (NPV) of .94 reflected 94% of all students who were identified as not at risk on the screen scored ⩾ the 40th percentile on the SAT-10. OCC is an aggregate-type measure of classification accuracy and reflects the proportion of students in the sample who were correctly based on either at risk or not at risk performance. The logistic regression model correctly classified 89% of all students. The AUC index was .96, indicating excellent discrimination in classifying individuals.
CART
Similar to the logistic regression, the four FRA tasks were entered into the CART model using the calibration data set. Ten cross validations were specified along with a minimum of three cases required to add another split. A complexity parameter and a cost matrix were not specified, so that the number of splits would not be limited and both types of classification errors would be treated the same. Based on the cross-validation results from the base model, the classification tree was pruned by specifying a complexity parameter of 0.02. The selection of a complexity parameter (cp) of 0.02 results in a cross-validation relative error below the recommended standard of one standard error above the minimum cross-validation relative error, indicated by the dotted line. Additional cut points could be selected, but they would result in a larger number of splits.
The pruned tree with the final classification rules is shown in Figure 1c. Note that just as in the logistic regression model, word building was not a practically important predictor; this is reflected by the absence of word building in the CART diagram (see Note 1). Similarly, the logistic regression and CART models produced similar R2 values, where .62 was observed in the logistic regression compared with .64 in CART. Where CART differs from logistic regression is in the ease of understanding how a student is identified as at risk or not at risk. For example, according to the logistic regression, classification would occur by computing the log-odds based on the intercept and slope coefficients in Table 1. Students with log-odds less than 0 would be classified as at risk and those at or above 0 would be not at risk. To determine classification accuracy, 2 × 2 contingency tables would be created to evaluate correct classification and false positive/negative rates. Conversely, the CART model in Figure 1c provides a more accessible venue for interpretation. According to this diagram, students would be identified as at risk based on two rules: (a) The student achieved a word reading score below 452 or (b) the student achieved a vocabulary pairs score below 465, a word reading score of 452 to 502, and a following directions score below 434. Students would be classified as not at risk based on the following rules: (a) a word reading score less than 452 and vocabulary pairs greater than or equal to 465, (b) vocabulary pairs less than 465 and word reading score greater than 503, or (c) a word reading score between 452 and 503, a vocabulary score less than 465, and following directions score greater than or equal to 434.
Logistic Regression Final Model Results in Grades 1 and 2.
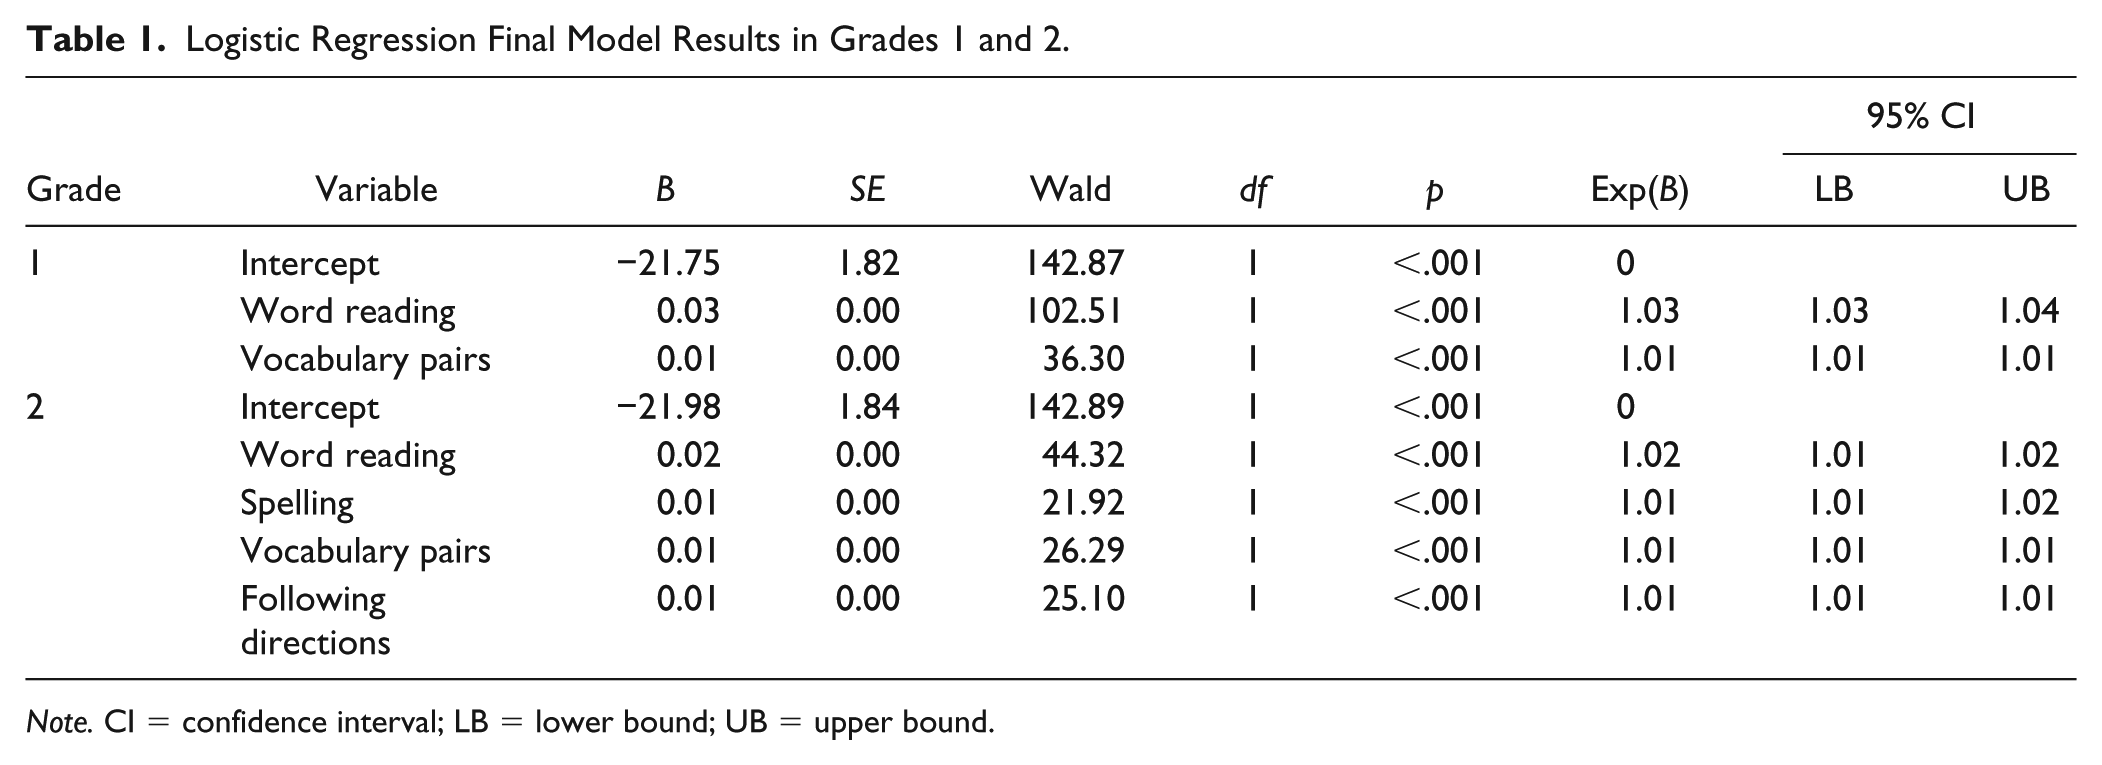
Note. CI = confidence interval; LB = lower bound; UB = upper bound.
What is not readily noticeable in Figure 1c is that an interaction exists in the determination of rules. That is, the two different cut points for word reading used in the tree point to an interaction between word reading and both vocabulary pairs and following directions. CART models allow the predictors to interact with each other, such that different combinations of cut points may be used to differentially classify individuals’ level of risk. Although logistic regression allows for the estimation of an interaction coefficient among independent variables, the estimation is often difficult to interpret (Lemon, Roy, Clark, Friedmann, & Rakowski, 2003).
The classification rules observed in the calibration data set were applied to the validation data set to predict group membership as well as probabilities associated with membership in each group. Using these results, classification accuracy was calculated. Comparing the indices between CART and logistic regression (see Table 2) showed that both models produce similar classification accuracy. Sensitivity was slightly higher for CART (.92) compared with logistic regression (.87), which also resulted in lower false negatives for CART (.08) and a higher rate for logistic regression (.13). All other indices were quite similar. An ancillary statistic that CART provided was a determination of a variable’s importance on a scale of 1 to 100. Variable importance is based on the number of times a variable is used in making splits and its splitting efficiency. Both primary splits (i.e., the black circles) and surrogate splits are considered. Word reading was found to have the greatest variable importance with a value of 62, followed by vocabulary pairs at 16, word building at 15, and following directions at 7. Because of the number of times word building is used as a surrogate split, and its efficiency in making surrogate splits, its variable importance is higher than that of following directions even though it is not included in the final CART model as a splitting variable.
Indices of Classification Accuracy in Grades 1 and 2.
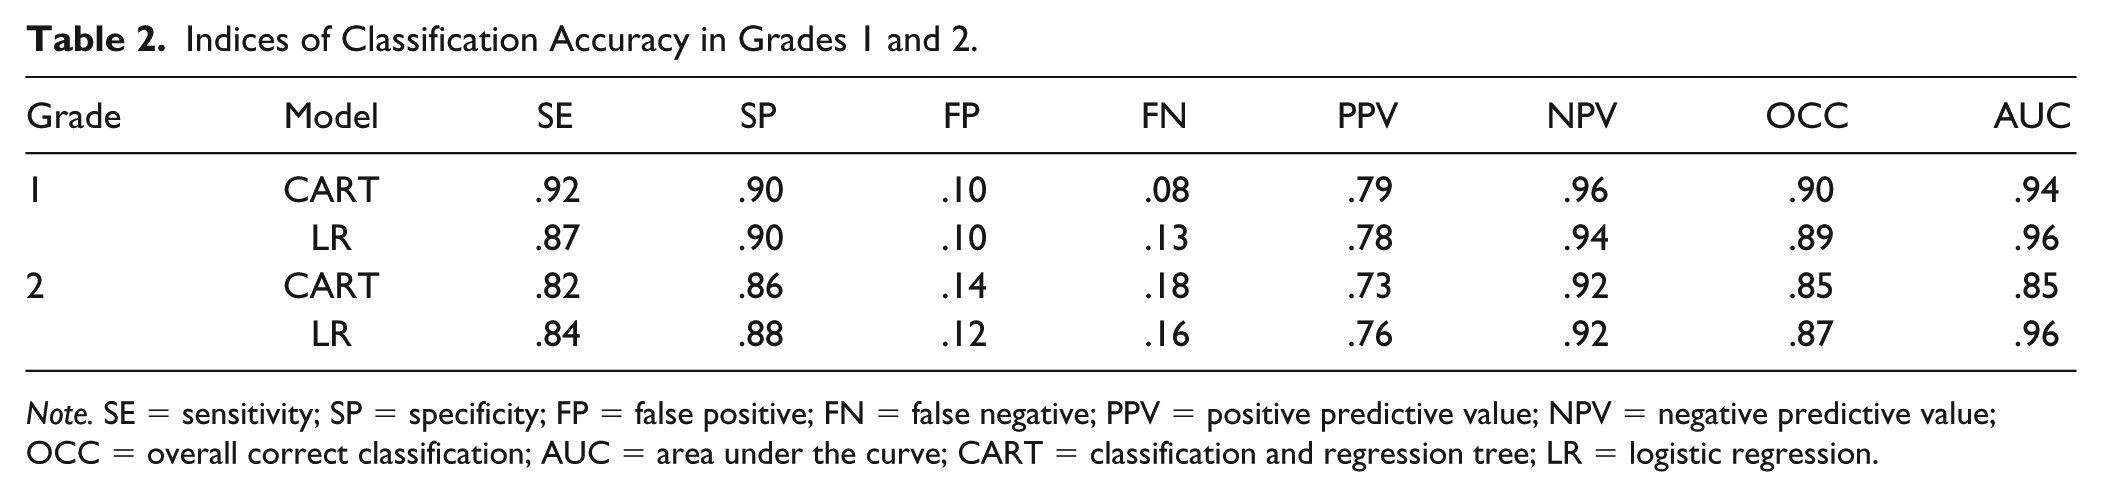
Note. SE = sensitivity; SP = specificity; FP = false positive; FN = false negative; PPV = positive predictive value; NPV = negative predictive value; OCC = overall correct classification; AUC = area under the curve; CART = classification and regression tree; LR = logistic regression.
Grade 2
Logistic regression
The process used for Grade 1 analyses was replicated for the Grade 2 sample. Correlations among the FRA tasks and the SAT-10 (see Table 2) reflected that similar medium-to-large associations were observed as compared with Grade 1. Subsequently, the FRA task scores were entered into the logistic regression ordered by correlational magnitude as follows: word reading, spelling, vocabulary pairs, and following directions. All four FRA tasks were found to contribute to explaining a significant and practically important percentage of variance and were kept in the final model. Approximately 70% of the variance in classification of students as below or above the SAT-10 threshold was explained by the FRA tasks, as indicated by the Nagelkerke pseudo R2 of .70. Model coefficients from the final model (see Table 1) were used to generate estimated SAT-10 logit scores for each case in the validation data set. Resulting classification accuracy for the model (see Table 2) demonstrated good sensitivity (.84), specificity (.88), PPV (.76), negative predictive value (.92), OCC (.87), and AUC (.96).
CART
In a similar manner, the FRA tasks were specified in a base CART model using the calibration data set. Ten cross validations were specified along with a minimum of three cases required to add another split. As noted earlier in the Grade 1 base model, a complexity parameter and a cost matrix were not specified, so that the number of splits would not be limited and both types of classification errors would be treated the same. Based on the cross-validation results from the base model, the classification tree was pruned by specifying a complexity parameter of 0.016. The value of 0.016 was chosen over that of 0.096 so that the tree would have more than one split, in addition to greater confidence that the cross-validation error is below the threshold.
The classification rules generated from the pruned tree were applied to the validation data set to predict group membership as well as probabilities associated with membership in each group. Because the negative predictive value was only slightly higher than the standard of .85, the calibration model was revised to specify the addition of a loss matrix, where the cost of false negatives would be treated as 2 times the cost of false positives based on a judgment of the cost of underidentifying students at risk. The pruned tree resulting from this revision is shown in Figure 1c. Word reading was rated as the most important variable with a value of 48, followed by spelling at 26, vocabulary pairs at 16, and following directions at 9. The R2 for Model 2 is .71, which was comparable with the logistic regression model of .70.
The resulting CART diagram (Figure 1d) shows that students were classified as at risk based on two rules and as not at risk based on two rules. At-risk classifications were based on (a) the student achieved a word reading score below 564 or (b) the student achieved a word reading score of 564 or above, a following directions score below 451, and a vocabulary pairs score below 494. Not-at-risk classifications were based on (a) student achieved a word reading score at or above 564 and a following directions score at or above 451 or (b) the student achieved a word reading score less than 564, a following directions score less than 451, and a vocabulary pairs score greater than or equal to 434. Classification accuracy of these decision rules (see Table 2) indicated that the CART model performed comparably with the logistic regression results on all indices, with the exception of the AUC, which was lower for CART (.85) compared with the logistic regression (.96).
Discussion
The purpose of this study was to introduce the reader to an emerging methodology for multivariate risk classification known as CART, and to compare this approach to a more commonly used methodology in logistic regression. Using a large sample of students in Grades 1 and 2, the two models performed comparably in terms of the selected indices for classification accuracy. The final Grade 1 models yielded specificity values of at least .90 and negative predictive value greater than .90. PPV for both models was less than .80, the AUC index was approximately the same for both approaches, and the sensitivity for CART was slightly higher than in the logistic regression. However, as discussed earlier, this study emphasized maximizing negative predictive value. The Grade 2 models showed a similar level of comparability between models across all indices, with the exception of the AUC, which was larger for the logistic regression than the CART analysis.
Given the comparability between the CART and logistic regression results, the CART model may be more appealing in an educational context for several reasons. CART is able to estimate and synthesize multivariate screening analysis with ease. This is important because the use of multiple measures allows for a more robust assessment of student performance across one or more intended substantive areas, and provides students with opportunities to more fairly demonstrate performance (Baker, 2003). Assessing the full representation of the intended construct also yields a more reliable estimate of the student’s true score. The research consensus is that reading success in the primary grades is predicted by print knowledge (i.e., knowledge of letter names and sounds, phonological awareness, word reading, and spelling) and language skills (i.e., syntax, vocabulary, and listening comprehension; National Early Literacy Panel, 2008). Measurement of these multiple skills and their use in classification models is essential to accurately identifying students at risk of reading difficulties. Although both CART and logistic regression can model the joint relationships of multiple assessments, there are several technical advantages of CART to consider. First, as a nonparametric method, a CART model is not sensitive to the presence of the outliers, unlike logistic regression. Second, logistic regression is less sensitive to the collinearity between the variables. Third, the ability to model complex interactions in CART, yet present the result of the interaction in a useful chart, makes CART more accessible. CART models complex interactions among predictors that may be difficult or impossible to estimate in the regression framework unless the interaction terms are specified a priori or an all subsets type of approach is used.
The visual appeal of CART is such that it may be easier to communicate to practitioners for use in making student-level decisions. Classification rules can be communicated using decision trees instead of logistic regression formulas. Using the decision tree, practitioners can identify a student as at risk or not at risk and have the ability to know which assessment(s), and, therefore, which component skill(s), placed the student in an at-risk category—and be able to do so using a simple paper and pencil format. Evidence from the health care field suggests CART models may be easier for some practitioners to understand and implement quickly (Jarvis et al., 2013). Their use in EWSs could be studied to determine whether school staff find them easier to use than logistic regression. At the same time, there are several limitations to comparing CART with logistic regression models. For example, a notable disadvantage of the CART model is that it is sensitive to the presence of missing data and, thus, either listwise deletion or data imputation is required to estimate the CART model. Combining decision trees from multiple imputed files is not easily conducted in a CART model, although parameter estimates from multiple imputed files can be averaged in logistic regression. In addition, improvements in sensitivity or specificity could be expected for logistic regression by adjusting the cut score used in group classifications using ROC curve results. Depending on the importance of one decision over another, adjustments to the model specifications could be made in both models when used in practice. The specifications used in this study were designed to meet or exceed negative predictive value of 0.85, while maintaining acceptable levels of sensitivity and specificity. Similarly, using a different measure of classification accuracy may affect the results in this report by favoring one method over the other. And, as noted by Kuhnert, Do, and McClure (2000), both CART and logistic regression may be used complimentary in the development of an EWS, because each method presents both advantages and disadvantages and provides different tools to the researcher. An advantage of logistic regression is the focus on the relative statistical significance of the predictors, whereas CART emphasizes the absolute effects. Both types of outcomes may be important in analyzing and interpreting the results of the models and identifying at-risk students.
Study Limitations and Future Directions
Although CART and logistic regression in the data presented here provided an opportunity to unpack the relative merits of each technique, it is worth noting that such findings may not generalize to all data sets. With varying sample sizes, correlations among the measured variables, selection of varying model models such as minimum splits and loss matrix weights, and the level of training and cross-validation samples, studies seeking to use CART as a supplement or alternative to analytic tools such as logistic regression or ROC curve analysis should evaluate these and other heuristics provided in the literature for a robust attention to methodological trade-offs. An additional limitation in the study is that observations were deleted based on univariate and multivariate outlier statistics. In practice, data observations represent real humans who cannot simply be removed; thus, future research may evaluate how to best provide optimal classification for those who do not conform to normal distribution theory. In future research, investigators may also wish to evaluate (a) how CART models could be more strongly associated with intervention strategies, (b) the utility of such models with wide-scale universal screeners, and (c) the impact of CART model-building heuristics on classification accuracy.
Conclusion
As practitioners seek to place into practice results from emerging research on effective screening models and practice, the utility of CART may enhance professionals’ ability to leverage strong screening accuracy with ease to communicate findings. CART diagrams allow for practitioners to tie splits on variables to benchmarks on screening measures, such that interpretations to teachers and caregivers may be done in a way that facilitates multitiered systems of support language (e.g., the student was at moderate risk on Measure 1 and at risk on Measure 2, leading to an overall level of high risk). Teaching and intervention approaches may be informed by CART models such that clearer ties from the pathways to risk could be used to develop fine-tuned intervention strategies for students who are in need of immediate intensive interventions.
Supplemental Material
AEI-18-ORIG-0014-R1_SupplementalFile – Supplemental material for Moving the Needle on Evaluating Multivariate Screening Accuracy
Supplemental material, AEI-18-ORIG-0014-R1_SupplementalFile for Moving the Needle on Evaluating Multivariate Screening Accuracy by Yaacov Petscher and Sharon Koon in Assessment for Effective Intervention
Footnotes
Declaration of Conflicting Interests
The authors declared the following potential conflicts of interest with respect to the research, authorship, and/or publication of this article: At the time of this manuscripts’ development, the FRA was a research tool and is now available in commercial form as the RAPID assessment.
Funding
The authors disclosed receipt of the following financial support for the research, authorship and/or publication of this article: This project was funded in part by the National Institute of Child Health and Human Development (P50HD052120) and originally appeared a technical document supported by the Regional Educational Laboratory: Southeast.
Notes
Supplemental Material
Supplemental material for this article is available online.
References
Supplementary Material
Please find the following supplemental material available below.
For Open Access articles published under a Creative Commons License, all supplemental material carries the same license as the article it is associated with.
For non-Open Access articles published, all supplemental material carries a non-exclusive license, and permission requests for re-use of supplemental material or any part of supplemental material shall be sent directly to the copyright owner as specified in the copyright notice associated with the article.