
Abstract
With the increasing demand for laboratory safety management, precise detection and graded early warning of misconduct become more critical. Traditional manual monitoring methods suffer from low efficiency, limited coverage, and difficulty handling complex scenarios. To address this, this paper proposes a laboratory misconduct graded early warning model based on object detection algorithms and Graph Convolutional Networks. The model uses You Only Look Once version 9, combined with Convolutional Block Attention Mechanisms, to enhance key feature extraction and accurately identify misconduct. Meanwhile, the Graph Convolutional Network explores spatial correlations between behaviors, and gated recurrent units capture temporal dynamic features to implement graded risk warning. The experimental evaluation showed a minimum loss of 0.027 after 120 iterations, demonstrating superior performance compared with the comparison models, which recorded loss values of 0.24, 0.25, and 0.32. In graded early warning tests, the model reaches an accuracy of 95.62%, with precision and recall exceeding 92%, clearly higher than the highest values of comparison models at 88.21% and 88.01%. These results indicate that the model can achieve precise detection and graded early warning of laboratory misconduct, providing an intelligent solution for laboratory safety management and promoting efficient and accurate safety monitoring.
Keywords
Background
In the context of rapid scientific and technological development, laboratories serve as key sites for research and teaching, which is important in promoting technological progress and cultivating professional talent. However, common misconduct in laboratories can easily cause equipment overheating, short circuits, and other faults, leading to fire, electric shock, and other safety accidents, seriously threatening personnel and property safety. 1 Traditional manual monitoring methods have low efficiency and coverage, weak flexibility, and poor generalization ability, making them insufficient to meet modern laboratory safety requirements. 2 Object detection is a fundamental task in computer vision that focuses on recognizing and pinpointing objects within images or video frames. 3 The You Only Look Once version 9 (YOLO v9) algorithm adopts a unique single-stage detection strategy, transforming the detection task into a regression problem and completing object classification and localization in a single neural network. 4 The Graph Convolutional Network (GCN) can directly operate on graph-structured data, fully utilizing node and edge information, and thus has a unique ability to capture complex relationships between data. 5 Based on this, this paper proposes a laboratory misconduct graded early warning model combining the YOLO algorithm and GCN, aiming to accurately detect and identify violations and provide a new intelligent solution for laboratory management. The innovation lies in introducing an attention mechanism, which enables YOLO to focus more on key regions and features closely related to misconduct, enhancing the algorithm's adaptability and robustness in complex scenarios. Furthermore, an adaptive graph convolution kernel is designed, automatically adjusting convolution weights and parameters according to the importance of nodes and edges in graph data, effectively mining potential correlations and patterns between misconduct behaviors and achieving precise classification and graded early warning.
Literature review
Detecting misconduct is key in preventing safety accidents, enhancing management efficiency, and improving personnel safety awareness. Researchers at home and abroad have conducted a series of practical studies. Yan et al. proposed a violation detection system based on YOLO and Convolutional Neural Networks (CNN) for safety monitoring at substation construction sites. The experiments showed that the model reached a precision of 0.852 and a recall of 0.922, satisfying the accuracy requirements for identifying actual violations in power construction. 6 Shanti et al. proposed a real-time monitoring model for high-altitude activities based on deep learning and unmanned aerial vehicles. Tests indicated that the model reached an accuracy of 97.2% and a recall of 90.2%, with an average time of approximately 12 s to detect violations. 7 Zhu and Yang introduced a real-time student behavior detection model for classrooms, which leveraged multi-scale feature fusion and self-calibrated convolution. Experimental results showed that the model accurately detected student behavior in class while maintaining fast real-time computation. 8 Patwal et al. introduced a hybrid model integrating CNN and Long Short-Term Memory networks to address low efficiency in time-frequency abnormal behavior detection. Tests showed that the model achieved a detection accuracy of 92.4%, a false positive rate of 4.1%, and single-frame processing delay controlled within 32 ms. 9 Patel analyzed crowd behavior using an online object tracking method enhanced by motion compensation. Experimental results indicated that the technique reached a multi-object tracking accuracy of 90.2% across three datasets, ran at 38 frames per second, and achieved an abnormal behavior recognition accuracy of 89.5%. 10
The YOLO algorithm has been widely applied in scenarios such as autonomous driving obstacle detection, security monitoring object tracking, industrial quality inspection defect detection, and medical image lesion screening due to its end-to-end fast detection capability and high real-time performance. Ganagavalli and Santhi proposed an abnormal activity detection model based on YOLO to identify criminal behavior. Tests showed that the area under the curve for subjects performing destructive behavior reached 0.8299, with excellent recognition accuracy across 14 types of criminal activities. 11 Xiao et al. proposed a daily behavior recognition model for ducks based on YOLO version 8 and attention mechanisms for animal behavior detection under low-light conditions. Experimental testing demonstrated that the model achieved an average precision of 94.8% under well-lit conditions and 93.6% under dark conditions. 12 Zhao et al. proposed a YOLO-based steel surface defect detection model. Tests indicated that the model reached an average precision of 81.1% and 75.2% on two test datasets, improving by 4.3% and 5.8% compared to comparison models. 13 GCN has been widely applied in social network analysis, recommendation systems, chemical molecular property prediction, and biological network modeling due to its ability to capture node dependencies and aggregate neighborhood features in graph-structured data. Wang et al. proposed a three-dimensional object detection model based on self-attention GCN for point cloud detection in autonomous driving. Tests showed that the model improved average precision by 4.88%, 5.02%, and 2.79% compared to comparison models. 14 Xu et al. proposed a tool wear recognition model based on GCN and cross-attention structures for high-precision machining. Test results indicated that the model achieved a weighted average F1 score of 0.987 and enabled real-time recognition of tool wear during machining. 15
In summary, researchers have made inevitable progress in detecting misconduct. However, studies on identifying and providing graded early warning of laboratory misconduct remain limited. Therefore, this paper proposes a laboratory misconduct graded early warning model based on YOLO and GCN. The model aims to accurately identify violations during experimental processes, optimize management efficiency, and improve laboratory safety.
Graded early warning model based on YOLO v9 and GCN
Detection algorithm design combining YOLO v9 and attention mechanism
Laboratory environments are complex and variable, with frequent activities of personnel and equipment. Meanwhile, the types of misconduct are diverse, placing high demands on algorithm accuracy and robustness. YOLO algorithms can efficiently process a large number of video frames in a short time, quickly capturing potential misconduct and providing strong support for timely intervention. 16 YOLO v9 introduces the Generalized Efficient Layer Aggregation Network (GELAN) based on YOLO v8, significantly enhancing feature extraction capability and achieving higher detection accuracy. The GELAN feature extraction process is shown in Figure 1.
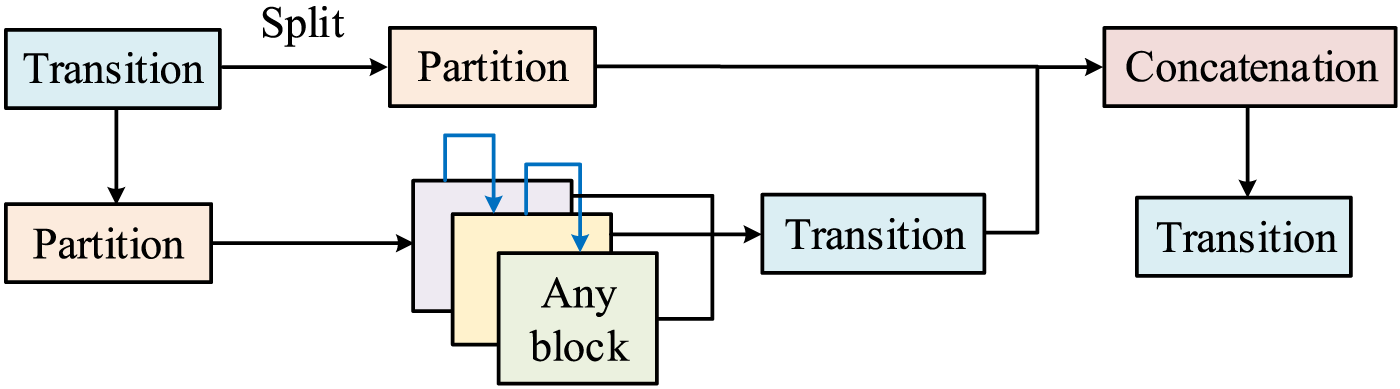
GELAN feature extraction process diagram.
As shown in Figure 1, GELAN first extracts features through cross-stage local expansion networks combined with arbitrary computation blocks. At the same time, the module's pooling and convolution layers downsample feature maps to obtain multi-scale features. These multi-scale feature maps are then input to the detection head to predict object categories and locations. Finally, post-processing, such as non-maximum suppression, produces the final detection results. The process optimizes the network structure through gradient path planning, achieving efficient information flow and parameter utilization. In this process, the initial convolution expression is shown in Equation (1).

In Equation (1),

In Equation (2),
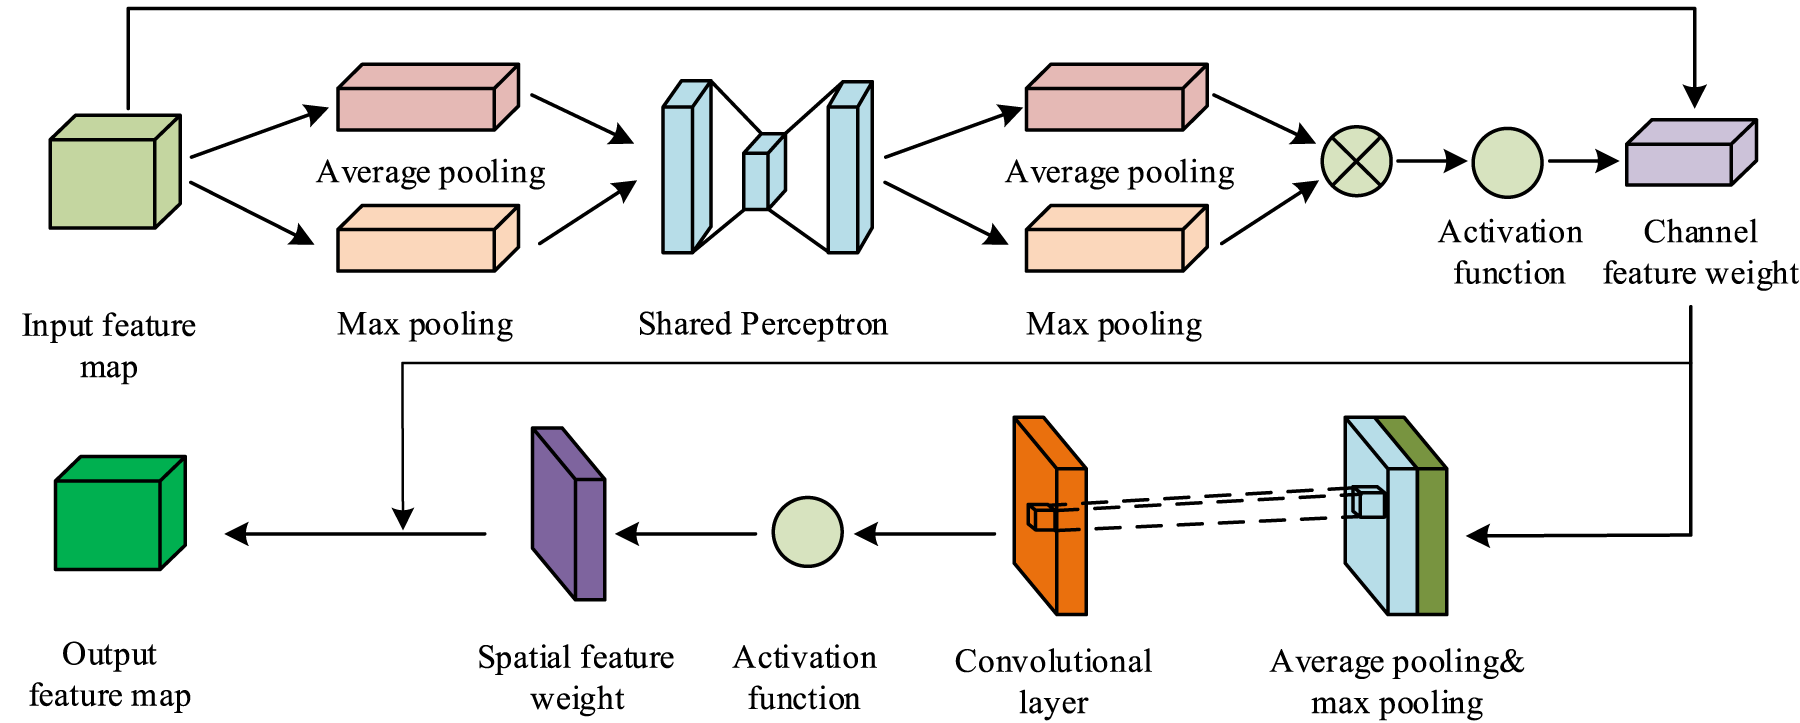
Schematic diagram of the CBAM optimization process.
As illustrated in Figure 2, within CBAM, the input feature map first undergoes average and max pooling to extract feature vectors, which are then fed into a shared perceptron. The resulting outputs are summed and passed through an activation function to produce channel attention weights. These weights are applied to the original feature map channel-wise, generating the channel-enhanced feature map. This enhanced map is subsequently processed through average and max pooling, followed by a convolution operation to produce intermediate features. An activation function then generates spatial attention weights, which are applied position-wise to the channel-enhanced feature map to obtain the final enhanced feature map. The calculation of CBAM's channel attention is presented in Equation (3).

In Equation (3),

In Equation (4),
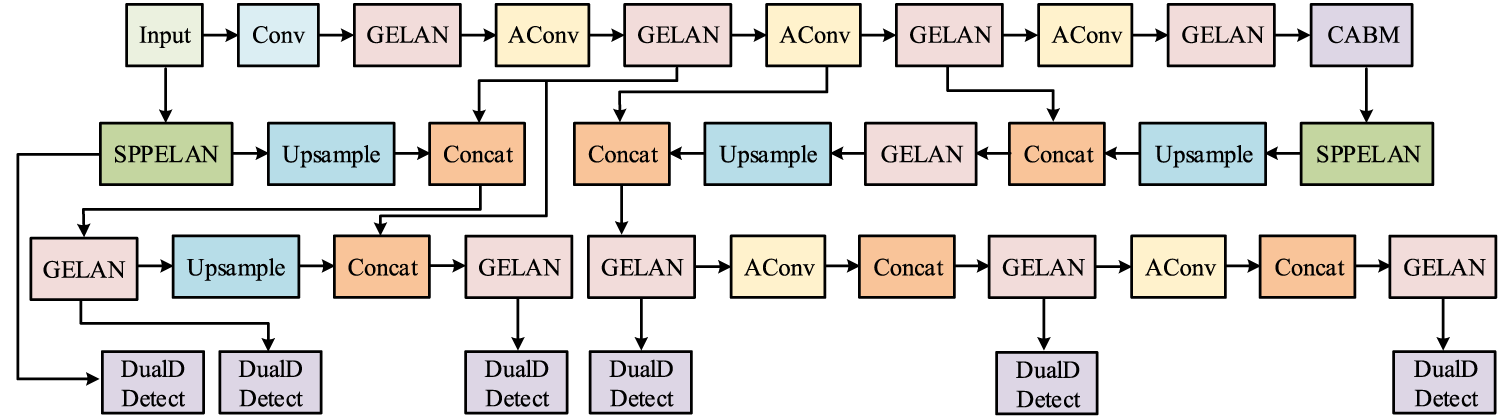
Schematic diagram of the structure of CBAM-YOLO v9.
As shown in Figure 3, CBAM-YOLO v9 extracts and preliminarily processes features through convolution, efficient layer aggregation, and adaptive convolution operations. CBAM enhances feature representation. Upsampling increases feature map resolution, and concatenation fuses features from different levels. Finally, dual detection layers complete object detection. CBAM-YOLO v9 employs a dynamic allocation strategy, expressed in Equation (5).

In Equation (5), t represents the dynamic allocation index, s denotes the prediction score, u indicates the localization match, and

In Equation (6),

In Equation (7),
Although the constructed CBAM-YOLO v9 algorithm can detect laboratory misconduct precisely, relying solely on the algorithm cannot fully explore potential correlations and risk level differences among different misconduct behaviors. When processing graph-structured data with complex relationships, GCN can construct a multi-dimensional relationship graph of elements in the laboratory scenario and aggregate node correlation information through graph convolution operations. It effectively analyzes dependencies and pattern features between misconduct behaviors, transforming isolated detection results into correlated risk information and providing key spatial association support for subsequent risk level assessment and dynamic early warning of misconduct. 19 The GCN data analysis process is shown in Figure 4.
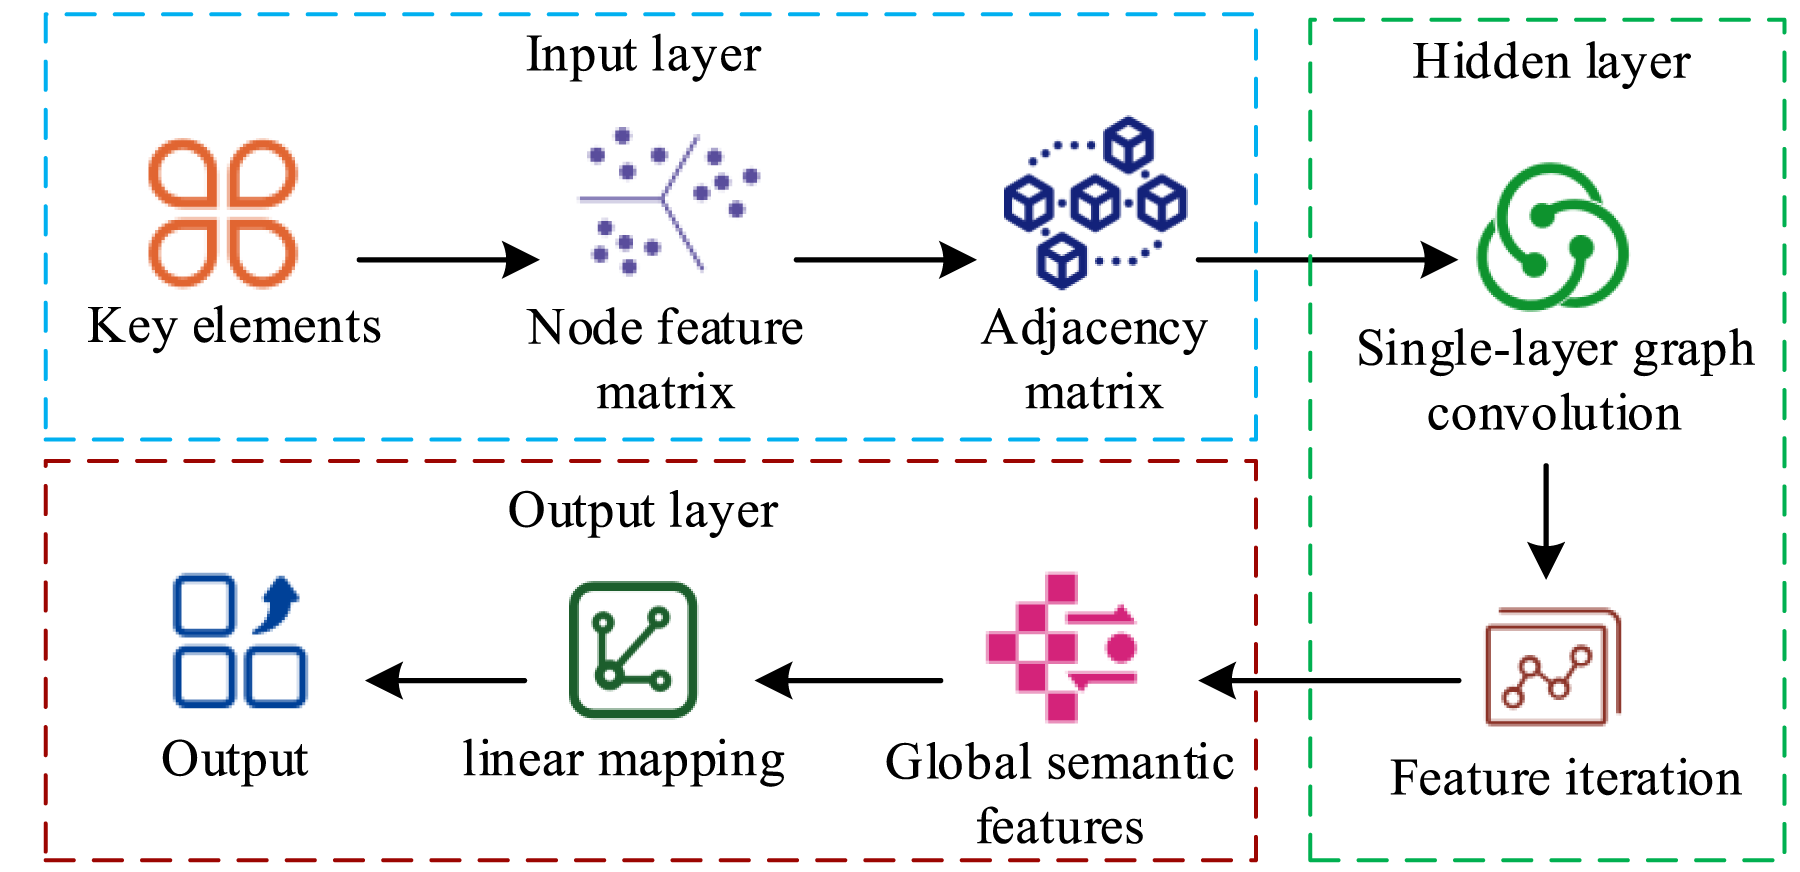
Schematic diagram of the GCN data analysis process.
In Figure 4, the input layer receives the original node feature matrix, providing a proper format for subsequent layers. The hidden layer, the core of GCN, consists of multiple stacked graph convolution layers. Repeated aggregation and transformation captures local and global structural information and enables feature interaction among neighboring nodes. The output layer maps the abstract features learned by the hidden layer into specific prediction results according to task design. The graph convolution operation is expressed in Equation (8).

In Equation (8), H represents the node feature matrix, l denotes the number of graph convolution layers,

In Equation (9), Z represents the output node prediction matrix. GCN constructs a multi-dimensional relationship graph that includes personnel, equipment, behaviors, and environment, and uses graph convolution to extract cross-dimensional features and hidden association patterns. This enables risk level assessment and dynamic early warning of misconduct. However, GCN alone cannot capture temporal dynamics and struggles to model the time dependencies of violations. As a temporal model, GRU effectively extracts temporal features of behavior sequences through gating mechanisms, modeling the continuity of infringements and improving the timeliness of early warning. 20 The hybrid GCN-GRU structure is shown in Figure 5.
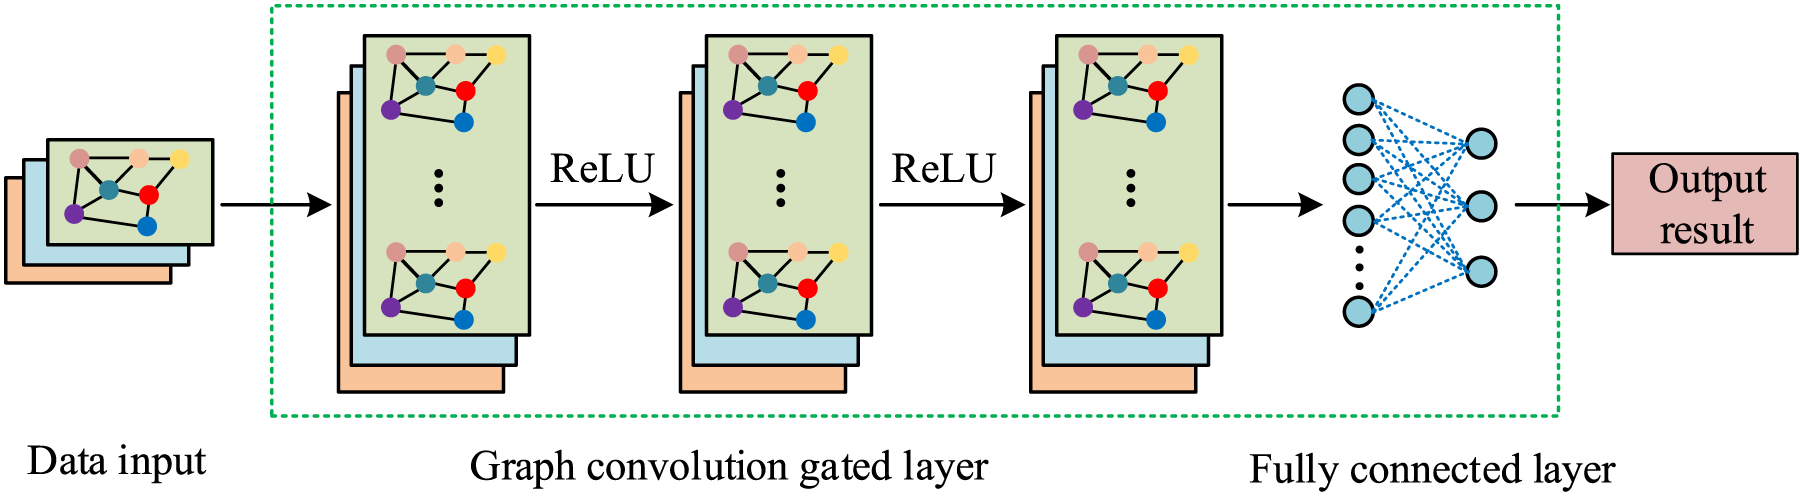
Hybrid model GCN-GRU structure diagram.
As shown in Figure 5, the GCN-GRU model inputs multi-layer graph-structured data, extracts features through graph convolutional gating layers, and captures topological relationships and feature interactions between nodes. After each graph convolution operation, a non-linear transformation is applied to strengthen the model's capacity to capture complex features and perform deep feature extraction on the input graph data. The features processed by multiple graph convolutional gating layers are passed to a fully connected layer, integrating and transforming the feature dimensions, mapping graph-structured features to the output space and producing the corresponding results. The graph convolution operation replaces the memory gate, correlation gate, and hidden state in GRU, achieving joint learning of spatiotemporal features in graph-structured data and improving feature extraction in complex environments. The memory gate is expressed in Equation (10).

In Equation (10), U represents the output of the memory gate,

In Equation (11), r represents the output of the correlation gate. The candidate hidden state stores selective neuron state information, expressed in Equation (12).

In Equation (12), C denotes the candidate hidden state, and

In Equation (13), the core is the weighted integration of the historical and candidate states through the memory gate, generating a new hidden state and achieving information retention and update. In summary, this study combines CBAM-YOLO v9 and the GCN-GRU model to construct a laboratory misconduct graded early warning model (YOLO v9-GCN-GRU) to precisely identify misconduct, explore spatial correlations and temporal dynamic features between behaviors, and implement graded risk level early warning. The YOLO v9-GCN-GRU model process is shown in Figure 6.
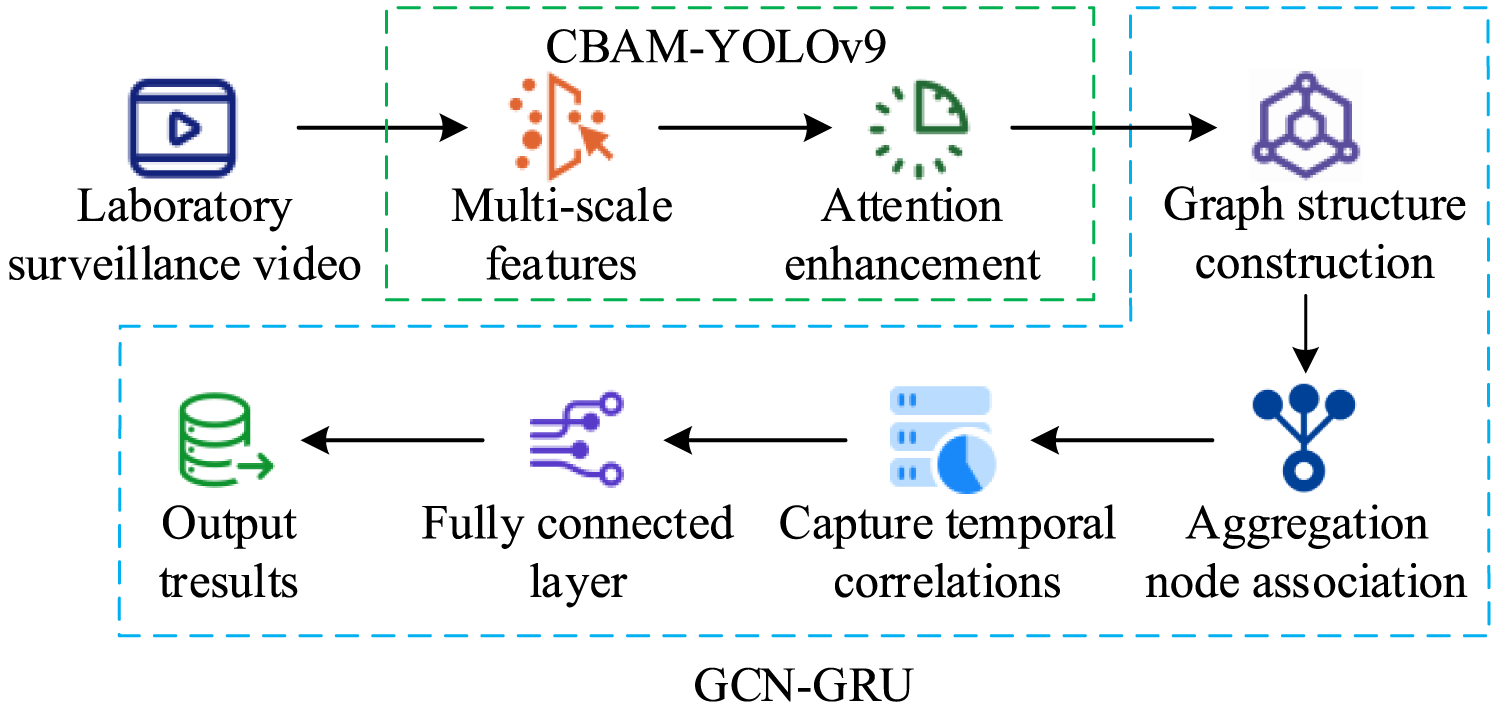
YOLO v9-GCN-GRU model operation flow chart (Icon source from: iconpark.oceanengine.com).
As shown in Figure 6, in the YOLO v9-GCN-GRU model, laboratory monitoring data first enter the CBAM-YOLO v9 module. GELAN extracts multi-scale features to capture objects and scene information at different scales in video frames. CBAM attention enhances key features, highlighting features critical for misconduct detection and suppressing irrelevant information. After feature processing, extracted features are converted into graph-structured data, representing elements and their relationships as nodes and edges. GCN aggregates node associations in the graph structure to explore spatial feature correlations, while GRU captures temporal dependencies in video sequences and integrates temporal information. Finally, the fully connected layer integrates and classifies the processed features, outputting graded early warning results and achieving detection and risk-level assessment of laboratory misconduct.
Performance analysis of CBAM-YOLO v9 misconduct detection algorithm
To evaluate the performance of the CBAM-YOLO v9 misconduct detection algorithm, the study compared it with Faster Region-based CNN (Faster R-CNN), Squeeze and Excitation-YOLO v8 (SE-YOLO v8), and Fully Convolutional One Stage (FCOS). The experiments were conducted on a Windows 10 system using the PyTorch deep learning framework with the Adam optimizer. The CPU was Intel Core i9-13900K@5.8 GHz, the GPU was NVIDIA RTX 3090 (24GB), and the memory was 32GB. The UCF-Crime and ShanghaiTech datasets were used. The average loss was measured, and the results are shown in Figure 7.
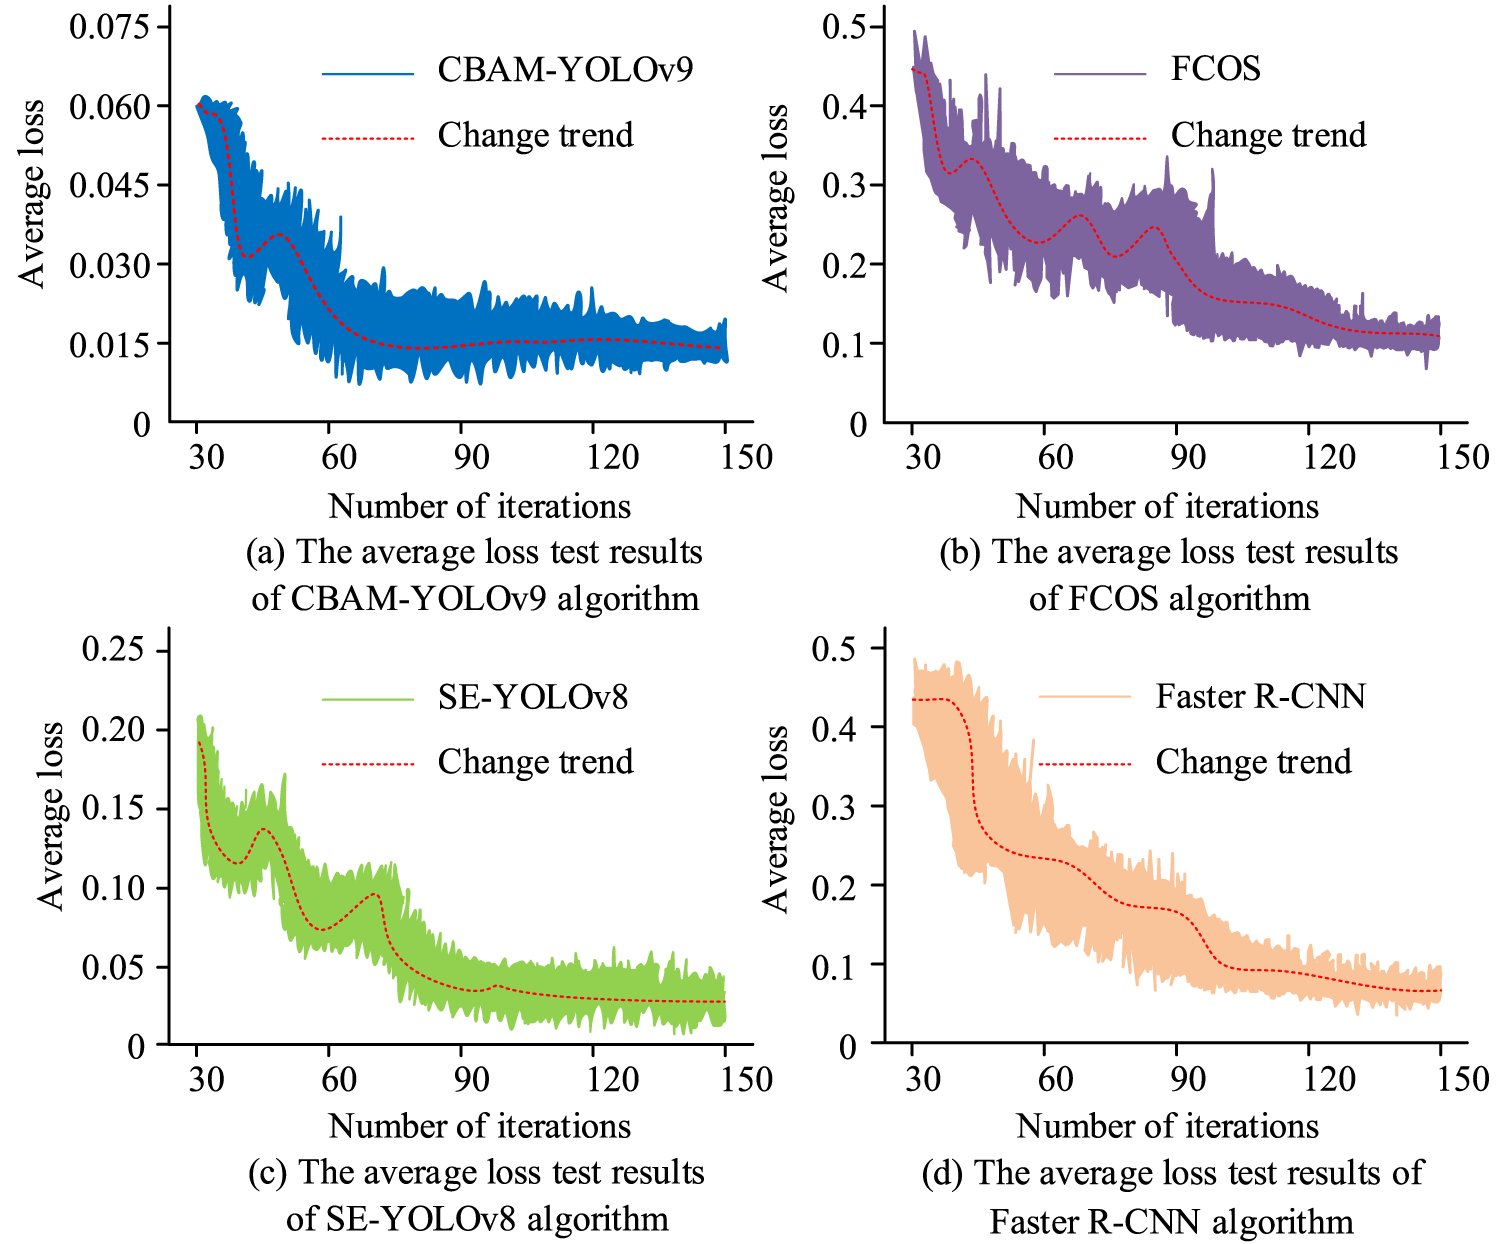
Comparison of average loss training and testing results.
In Figure 7(a), CBAM-YOLO v9 reached an average loss of 0.015 after 120 iterations, with the overall loss curve stabilizing gradually after 60 iterations. Figure 7(b) showed that FCOS exhibited large fluctuations in average loss between 30 and 90 iterations, with the lowest average loss of 0.12. Figure 7(c) indicated that SE-YOLO v8's average loss curve stabilized after 90 iterations. Figure 7(d) revealed that Faster R-CNN reached an average loss of 0.03 at 130 iterations. In summary, CBAM-YOLO v9, by introducing GELAN and CBAM attention, precisely focused on key features of laboratory misconduct and filtered background interference, achieving faster loss convergence than other algorithms. Subsequently, the mean Average Precision (mAP) and Frames Per Second (FPS) of the four algorithms were tested, as shown in Figure 8.
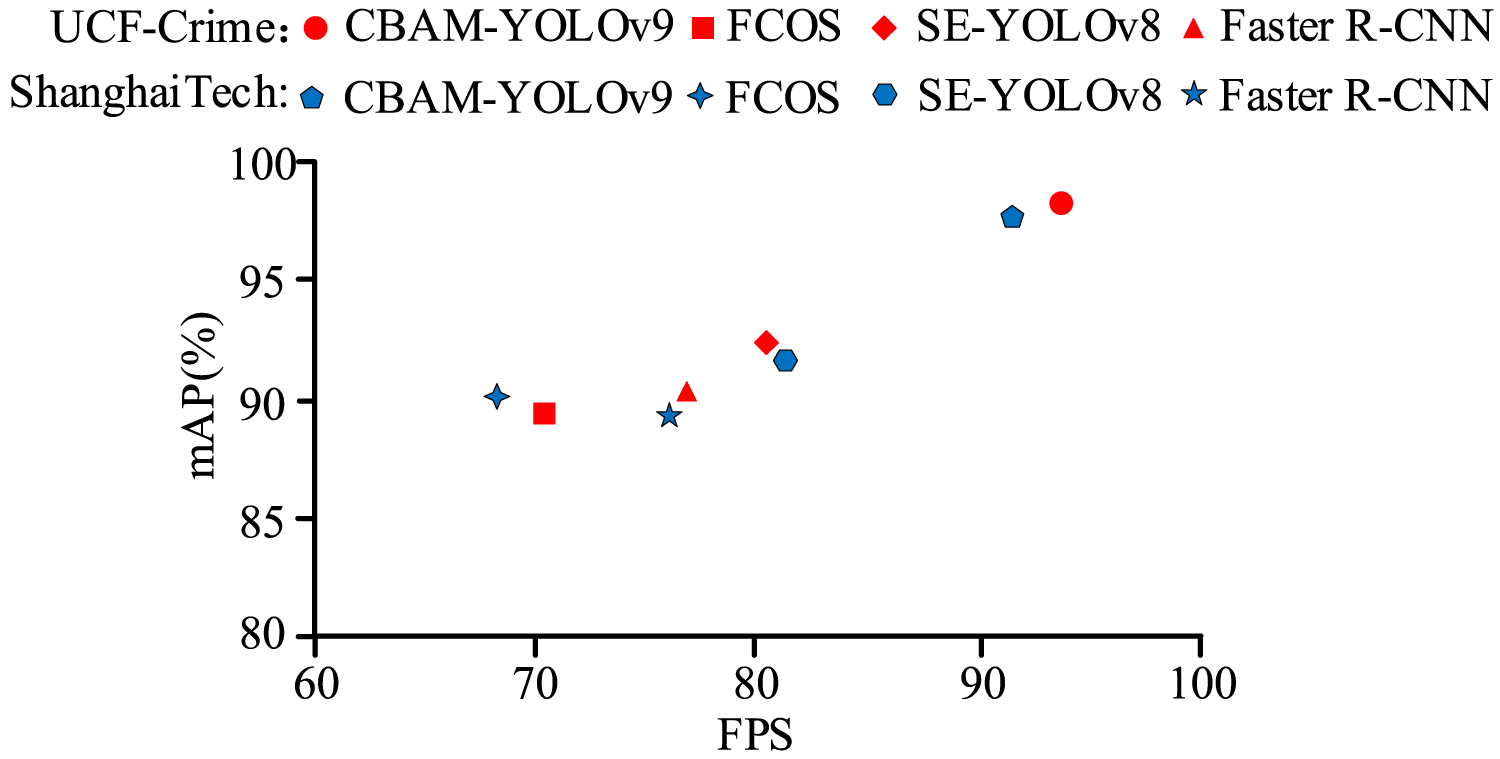
Comparison of mAP and FPS test results.
Figure 8 indicated that on the UCF-Crime dataset, CBAM-YOLO v9 achieved a mAP of 97.2%, while SE-YOLO v8 achieved 92.7%. CBAM-YOLO v9 reached 93 FPS on UCF-Crime, 12 frames higher than SE-YOLO v8. On ShanghaiTech, CBAM-YOLO v9 achieved 91 FPS, 24.3 frames higher than FCOS. CBAM-YOLO v9, through CBAM synergy, enhanced feature representation for small and occluded objects, achieving high accuracy and high frame rate. The Area Under Curve (AUC) value and F1 scores were tested to further evaluate performance, with results shown in Figure 9.
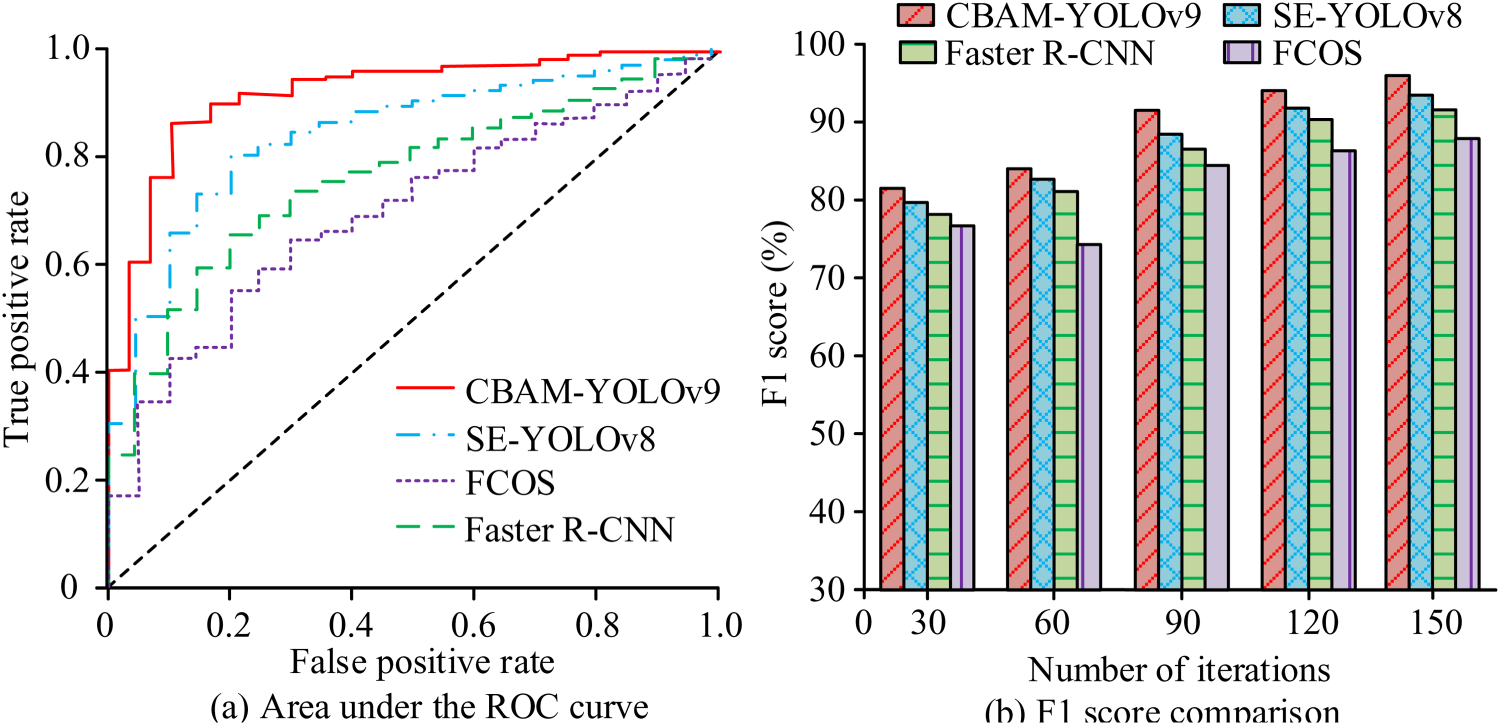
Comparison of AUC and F1 score test results.
As shown in Figure 9(a), CBAM-YOLO v9's Receiver Operating Characteristic (ROC) curve was closest to the top-left corner, with an AUC of 0.921. Figure 9(b) indicated that its F1 scores remained above 80%, reaching 93.7% at 120 iterations. In conclusion, CBAM-YOLO v9 demonstrated strong robustness and fast convergence, accurately detecting misconduct behaviors.
After validating CBAM-YOLO v9, the study assessed the performance of the laboratory misconduct-graded early warning model based on CBAM-YOLO v9. It compared YOLO v9-GCN-GRU with YOLO v9-GCN, SE-YOLO v8-Transformer, and Fully Convolutional One Stage-Spatial Temporal-GCN (FCOS-ST-GCN). The datasets were constructed from Lab A and Lab B of a university. The loss test results are shown in Figure 10.
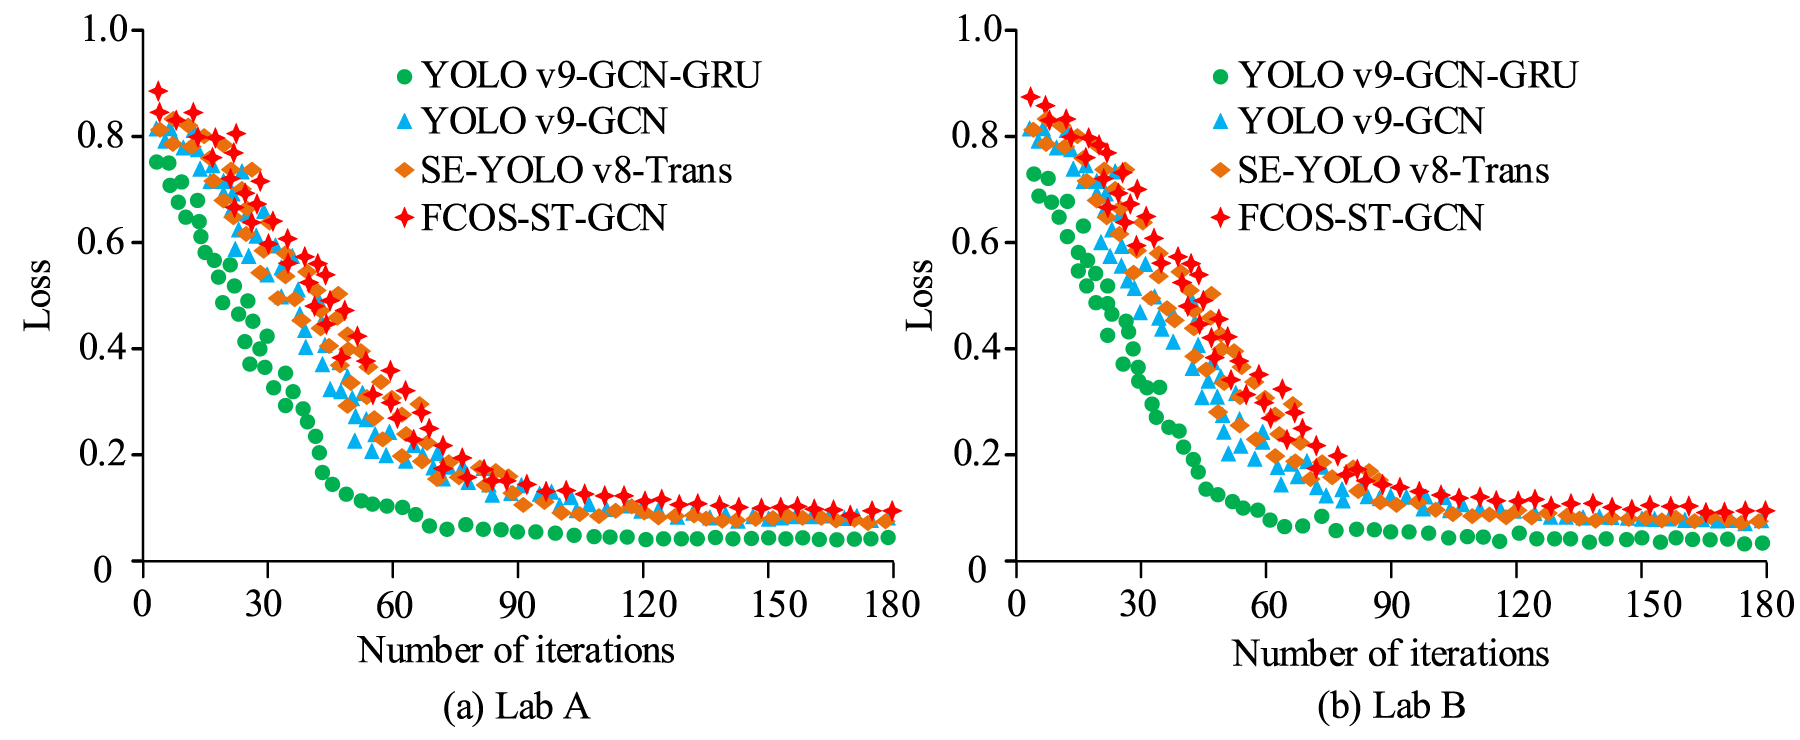
Comparison of loss value test results.
Figure 10(a) showed that on the Lab A dataset, YOLO v9-GCN-GRU reached a loss of 0.11 at 60 iterations, while YOLO v9-GCN, SE-YOLO v8-Trans, and FCOS-ST-GCN reached 0.20, 0.22, and 0.27, respectively. Figure 10(b) showed that on the Lab B dataset, YOLO v9-GCN-GRU reached a loss of 0.027 at 120 iterations, with the loss curve stabilizing after 60 iterations. Overall, YOLO v9-GCN-GRU achieved the lowest loss and fastest convergence compared with the other models. To further verify performance, graded accuracy and per-frame processing delay were tested, as shown in Figure 11.
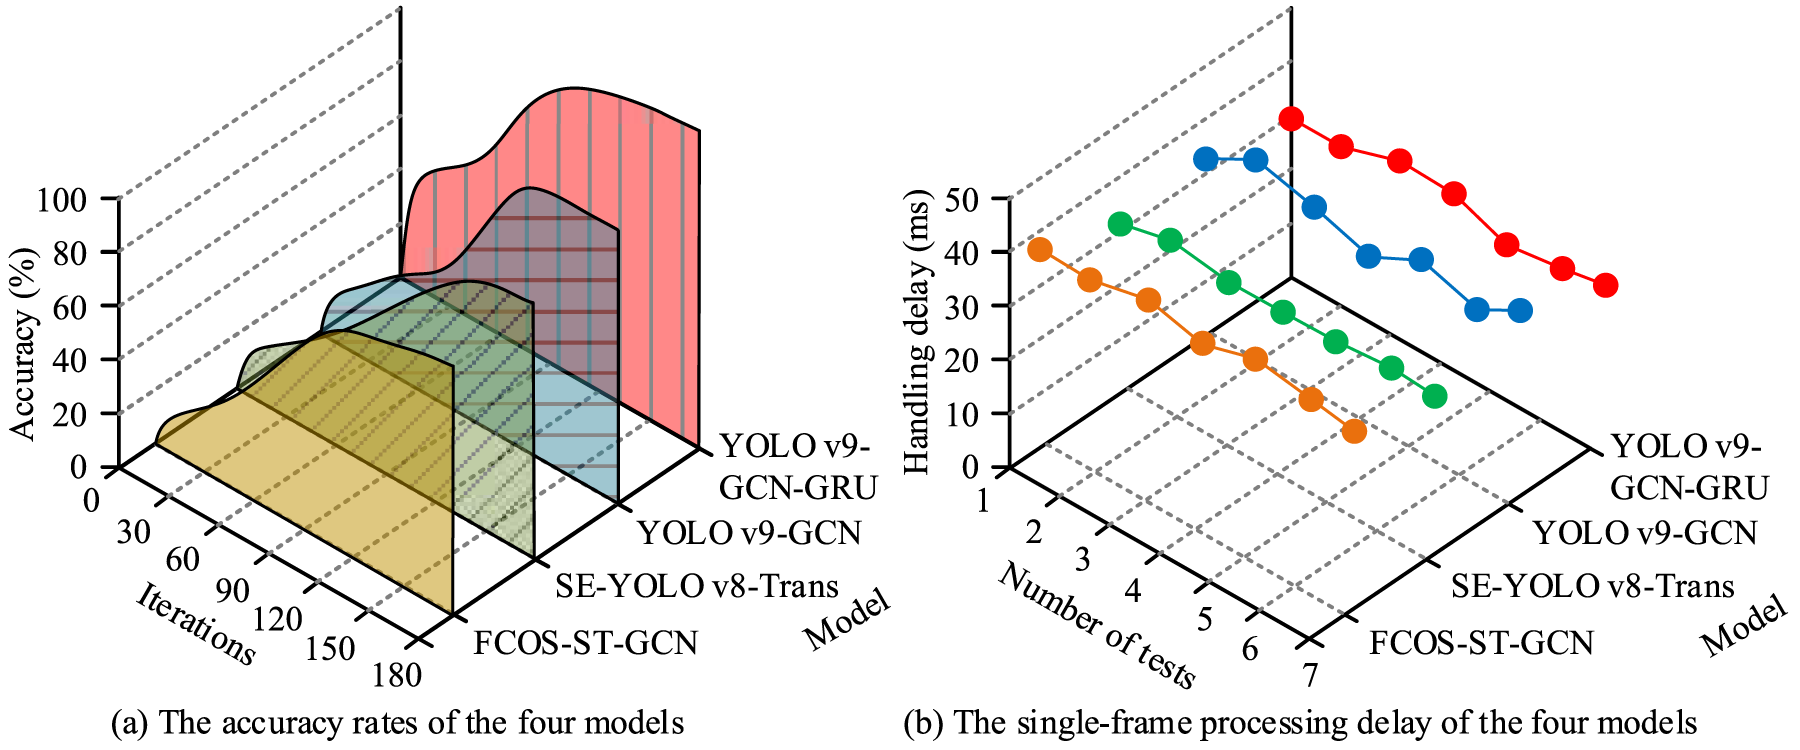
Comparison of accuracy and single-frame processing delay test results.
Figure 11(a) showed that at 150 iterations, YOLO v9-GCN-GRU reached a graded accuracy of 94.57%, 4.45% higher than YOLO v9-GCN and 7.13% higher than SE-YOLO v8-Trans. Figure 11(b) indicated that its average per-frame processing delay was 29.46 ms, 6.79 ms, and 2.75 ms lower than FCOS-ST-GCN and YOLO v9-GCN, respectively. In summary, YOLO v9-GCN-GRU achieved significant advantages in graded accuracy, enabling fast and precise early warning of misconduct. Precision and recall were tested to analyze overall performance, with results shown in Table 1.
Comparison of precision and recall test results.
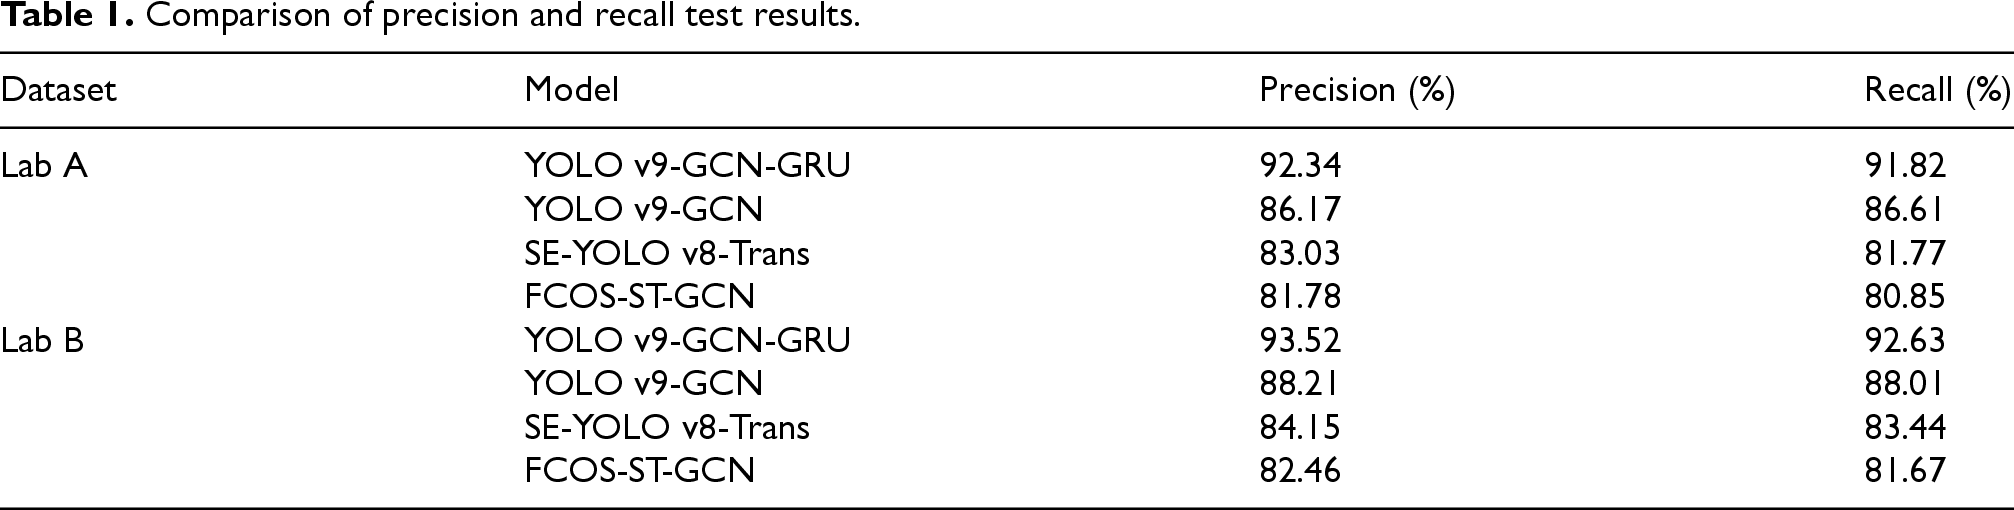
Table 1 indicated that on the Lab A dataset, YOLO v9-GCN-GRU achieved a precision of 92.34%. On the Lab B dataset, its precision reached 93.52%, while YOLO v9-GCN, SE-YOLO v8-Trans, and FCOS-ST-GCN achieved 88.21%, 84.15%, and 82.46%, respectively. YOLO v9-GCN-GRU improved recall by 9.19% compared with SE-YOLO v8-Trans. In conclusion, YOLO v9-GCN-GRU leveraged GCN to enhance risk correlation for graded prediction, reduced false warnings from isolated behavior detection via GRU, and shortened preprocessing time through CBAM's efficient feature extraction, maintaining high graded precision.
To address the limitations of traditional laboratory safety monitoring methods, such as low effectiveness and insufficient coverage, this study proposed a laboratory misconduct graded early warning model based on the CABM-YOLO v9 object detection algorithm, further optimized with GRU and GCN. Experimental results showed that the proposed CABM-YOLO v9 achieved a minimum average loss of 0.027, with the overall loss curve gradually stabilizing after 60 iterations. On the two datasets, its mAP reached 97.2% and 95.4%, while the Area Under Curve (AUC) was 0.921, and the F1 score reached 93.7%. Furthermore, experiments indicated that the YOLO v9-GCN-GRU graded early warning model achieved loss values of 0.031 and 0.027 on the two datasets. The graded accuracy exceeded 94%, with an average per-frame processing delay of 29.46 ms. Both precision and recall exceeded 92%, outperforming comparable models. Overall, the YOLO v9-GCN-GRU model demonstrated high misconduct detection rates and accurate graded early warning performance. Although the proposed model performed well, the coverage of behavior categories was limited, and its generalization capability requires further evaluation. Future work tests more categories of misconduct to improve adaptability in complex dynamic scenarios, providing more comprehensive support for intelligent laboratory safety management.
Footnotes
Acknowledgment
N/A.
Ethical approval
N/A.
Author's contribution
Yubin Wang, writing—original draft, writing—review and editing, conceptualization, methodology.
Funding
The author received no financial support for the research, authorship, and/or publication of this article.
Declaration of conflicting interests
The author declared no potential conflicts of interest with respect to the research, authorship, and/or publication of this article.
Data availability
All data generated or analyzed during this study are included in this article.