
Abstract
As intelligent transportation systems increasingly rely on vehicle detection algorithms, their actual deployment faces significant challenges. The high computational complexity of deep learning models conflicts with resource-constrained edge devices and their real-time requirements. The detection system must maintain a stable frame rate under low-latency conditions in high-traffic environments to ensure timely traffic monitoring and decision-making, as well as adaptability to complex environments. Poor weather, changes in lighting, and intricate backgrounds can affect detection accuracy, leading to false or missed detections. Consequently, this study proposes a hardware-oriented lightweight vehicle detection framework that optimizes computational efficiency while ensuring detection accuracy. First, MobileNetV3 reconstructs the YOLO backbone feature extraction network to reduce the computational redundancy. Second, conventional convolutions are replaced with depthwise separable convolutions to decouple spatial and channel feature learning. Third, the original C3 module (a cross-stage partial bottleneck structure with three convolutional layers) is reconfigured using redesigned GhostBottleneck blocks (lightweight residual blocks that stack Ghost Modules—where the first expands channels via depthwise separable convolution and the second compresses channels while retaining shortcut connections). In addition, the introduction of a novel dual-stream attention mechanism enhances prediction accuracy while maintaining detection performance. A paired-sample t-test was used to evaluate the effectiveness of the proposed algorithm. The results demonstrate that the P-values for all three key performance metrics —precision, recall, and mAP@0.5 — are significantly lower than 0.05, confirming that MDE-YOLO achieves statistically significant improvements over YOLOv5s in these metrics. Compared with YOLOv5, the proposed method reduces the number of parameters, computational complexity, and model weight by 69.9%, 77.5%, and 67.8%, respectively, while maintaining an average recognition rate reduction of only 0.5%. The slight decrease in accuracy can be considered an acceptable trade-off, providing a methodological framework for overcoming the “accuracy-resource” dilemma in traffic perception systems.
Introduction
Automobile ownership has increased significantly in the current era of rapid economic development. The widespread use of vehicles has substantially improved the daily lives of people. However, it has also created numerous challenges in traffic system management and monitoring. On the one hand, the dramatic growth in traffic volume has resulted in frequent road congestion; on the other hand, it has become increasingly difficult to effectively regulate illegal driving behaviors, which undoubtedly underscores the urgency and necessity of developing an intelligent transportation system (ITS).
From a technical perspective, the foundation of ITS development is in the ability to accurately and in real-time utilize video data to comprehensively capture vehicle-related information on roadways. Numerous authoritative studies have demonstrated that the ongoing advancement of ITS constitutes a core strategy for effectively reducing traffic accidents and addressing highway safety concerns. Continued progress will significantly enhance travel safety and establish robust safety measures for future travelers.
In the domain of traffic detection tasks, vehicles, as critical components of the traffic environment, inherently serve as primary objects for identification and detection. Machine vision was the earliest and most extensively utilized sensor technology for vehicle detection (Bertozzi et al., 2000). With advancements in computer hardware and the emergence of large-scale datasets, deep learning (DL) has achieved unprecedented progress in object detection. The performance of image recognition based on convolutional neural networks (CNNs) has significantly improved, overcoming the limitations of traditional feature operators while demonstrating robust feature extraction capabilities. DL has emerged as a prominent research topic in object detection. The DL models listed in Table 1 are applicable to vehicle detection tasks. From an algorithmic perspective, the detection accuracies of two-stage detection methods (such as R-CNN (Girshick et al., 2014), Fast R-CNN (Girshick, 2015), and Faster R-CNN (Ren et al., 2015)) typically surpass those of single-stage methods (such as YOLO V5 (Jiang et al., 2022), SSD (Liu et al., 2016), YOLO V7 (Li et al., 2023), and YOLO V8 (Varghese & Sambath, 2024)).
Comparison of Detection Performance of Each Model.
Comparison of Detection Performance of Each Model.
However, numerous challenges persist during deployment. First, hardware resource limitations constitute the primary bottleneck. The high computational complexity of DL models conflicts with the constrained computing power, storage capacity, and energy consumption requirements of edge devices, particularly when operating in low-power embedded systems. Second, real-time performance demands impose stricter standards on system capabilities. Detection algorithms must maintain stable frame rates under low-latency conditions to ensure real-time decision-making in high-traffic scenarios, such as highways and smart intersections. In addition, adaptability to complex environments significantly affects deployment effectiveness. Extreme weather conditions (e.g., fog and heavy rain), lighting variations (e.g., tunnel entrances and nighttime conditions), and complex backgrounds (e.g., pedestrian and bicycle interference) may compromise detection accuracy, leading to false positives or missed detections. Consequently, an urgent need exists for lightweight vehicle detection solutions capable of efficient operation in resource-constrained environments while meeting real-time performance requirements and adapting to complex environmental variations.
A previous study (Han et al., 2015) proposed applying model compression techniques such as pruning, weight sharing, training quantization, and Huffman coding to address the challenge of the network storage scale, achieving notable success.
Currently, network compression techniques can be broadly categorized into two approaches: compression based on existing model architectures and compression based on novel network structure designs. The former includes methods, such as model parameter pruning, convolution kernel sparsity, weight quantization, and tensor decomposition. The latter involves a low-redundancy network design and knowledge distillation. Yong (He et al., 2017) proposed a channel pruning method for CNNs, wherein convolutional channels were selectively pruned using Lasso regression, followed by weight adjustment and learning. The network output before pruning was reconstructed using the least squares method, reducing both the model parameters and computational load while preserving model performance. Although this approach compresses the model at the channel level, it may lead to the loss of important connection weights. The low-redundancy model design aims to reduce the number of parameters by efficiently utilizing feature maps to minimize model redundancy, thereby enabling high performance with fewer parameters. For instance, FN (Iandola et al., 2016) replaced 3 × 3 filters with 1 × 1 filters to reduce the number of feature maps in each layer, thereby achieving a significant reduction in the number of model parameters. Building on this concept, the authors proposed a fire module structure that combines network design with downsampling to reduce information loss. This method achieves a 50-fold compression of the model compared with AlexNet without sacrificing accuracy. Howard (Howard et al., 2017) introduced a lightweight neural network suitable for embedded devices, such as mobile phones by employing depthwise separable convolutions. The core idea is to decompose the standard convolution into depthwise and pointwise convolutions, thereby reducing the number of intermediate feature maps and, in turn, the parameter count of the network.
The frontier progress in lightweight object detection technology has mainly focused on architecture optimization, attention mechanism innovation, and edge deployment technology to effectively reconcile the relationship between vehicle detection accuracy and speed and achieve a delicate balance between the two. Initial efforts were predominantly focused on structural pruning. For instance, Wang et al. (2024) introduced IPA and MSCCR modules into the YOLOv5 model architecture, successfully reducing 9% of parameters and significantly improving the model accuracy by 3.1%, which strongly proved that structural pruning may not cause performance degradation but may bring gains. Cheng et al. (2024) also achieved satisfactory results by combining the CF2-MC network architecture with the MG fusion module. The advantage of this type of method is that it can significantly reduce the complexity of the model, making it more suitable for resource-constrained devices. However, the disadvantage is that architectural adjustments may introduce compatibility issues, and excessive focus on parameter reduction can easily ignore the integrity of feature extraction. Another burgeoning trend is dynamic expansion. The YOLO-Dynamic algorithm by Zhang et al. (2024) enhances small object recognition and feature extraction by integrating StarNet and convolutional gated linear unit operations. It also optimizes feature fusion and accelerates detection using a lightweight multiscale architecture. Compared with YOLOv8s, it improves mAP@0.5 by 7%, mAP@0.5:0.95 by 10.3%, reduces parameters by 1.48 M, and cuts floating-point operations by 3.8 G. However, its implementation demands high hardware complexity and specialized accelerator support.
Attention mechanisms capable of meticulously carving multiscale features have garnered significant interest. For instance, Ma et al. (2024) introduced an innovative frequency-decoupled attention mechanism. When addressing small target detection tasks, compared with the YOLOv8 baseline version, the mean average precision metric witnessed a remarkable 6.8% surge, whereas the requisite number of parameters plummeted by 40%. This endows the model with enhanced advantages for small target detection, enabling it to capture subtle and crucial feature information. However, the computational cost associated with this mechanism is relatively high, posing challenges for its deployment in devices with insufficient computing power. Large computational demands render computer vision unsuitable for resource-constrained mobile devices; thus, a discrete cosine transform (DCT) (Lee & Kim, 2024) is used to remove high-frequency components, thereby reducing the computational load without sacrificing accuracy. Compared with the DeiT-Small model on ImageNet, the DCT-enhanced ViT reduces computational cost by 25%, increases accuracy by 0.18%, reduces complexity by 44%, but slightly sacrifices high-frequency details. A balance between compression and granularity is required.
Structured pruning and distillation techniques have been investigated extensively. In the field of layer pruning, Wu et al. (2021) realized that different layers have different pruning requirements and proposed a differentially evolved layered weight pruning method that effectively compressed the parameters of LeNet-300-100, LeNet-5, AlexNet, and VGG16 24, 14, 29, and 12 times, respectively. Xu et al. (2022) adopted a different approach and expanded the layer pruning method by integrating sparsity into the training process. They transformed the original convolutional layer into a fusible residual convolutional block, which has the advantages of a short inference time and efficient pruning. Li et al. (2022) introduced a channel pruning compression method to enhance the filter elasticity and reduce the size of neural networks to address the problem of filter pruning. They proposed a composite channel pruning method that combined improved L1 regularization training with global filter importance. Zhang et al. (2022) designed a pruning algorithm to resolve the problem of an unbalanced filter distribution caused by the deletion of unimportant filters. It can not only identify and retain filters that match the original filter distribution but also remove redundant filters. Geng and Niu (2022) advocated strengthening the pruning direction and proposed a backward layer-by-layer filter pruning method starting from the last convolutional layer, which effectively reduced the accuracy loss caused by the premature deletion of shallow convolutional filters.
Hardware-algorithm co-design has emerged as a critical aspect. For instance, Wang et al. (2024) proposed a hybrid depth-separable convolution combined with channel reorganization technology, achieving 98.1% mAP on the car dataset at a frame rate of 62 FPS on Jetson Nano; Huang et al. (2024) cleverly integrated the MobileNetV3 architecture with the CA attention mechanism and embedded the YOLOv7 model system, using the SPPF-GSConv technology to achieve an excellent mAP of 98.2% in the BIT-Vehicle dataset test scenario; NVIDIA (2024) developed TensorRT-LiTE, which automatically fused kernels to boost the throughput of YOLOv8 by 40%; Vinoth and Sasikumar (2024) innovatively coupled the depth perception attention mechanism with the photometric uncertainty map, relying on the layer fusion technology and the INT8 quantization strategy, to achieve robust and reliable vehicle detection performance at a rate of 53 frames per second (FPS) under low light conditions on the NVIDIA Orin hardware platform, However, such methods exhibit a strong dependance on hardware and encounter difficulties in cross-hardware platform transplantation owing to adaptation challenges.
Overall, although remarkable progress has been made, challenges related to compatibility, computational cost, and hardware adaptation persist and must be overcome to further propel the development of object detection technology.
Theoretical Contribution
This study selected YOLOv5 as the basic method to reduce the model size while ensuring detection accuracy to adapt to resource-constrained environments. To this end, fine optimization has been performed on several aspects. First, MobileNetV3 was introduced to optimize the YOLOv5 backbone network, which contains advanced technologies such as the h-swish activation function and SE block, focusing on mobile and edge device applications, and has excellent performance. After integration, combined with deep separable convolution technology, it effectively reduces the computational burden and parameters, accurately captures key features, reduces computational complexity, and improves overall efficiency. Second, the GhostBottleneck module was used to reconstruct the C3 module. The module is designed exquisitely, can generate feature maps with cheap operations, balanced parameters, and feature richness, and ensures feature extraction capabilities. After replacement, the number of parameters and calculations were further reduced to maintain a stable accuracy rate. Finally, a dual-stream attention (DSA) fusion module is proposed to overcome the limitations of traditional attention, integrate the channel and spatial attention mechanisms in parallel, and simultaneously capture key features. Channel attention calibrates channel feature responses and focuses on vehicle detection features, whereas spatial attention captures the object distribution. The two work together to enhance the detection capability for complex scenes.
Methodological Models
YOLOv5 Network Framework
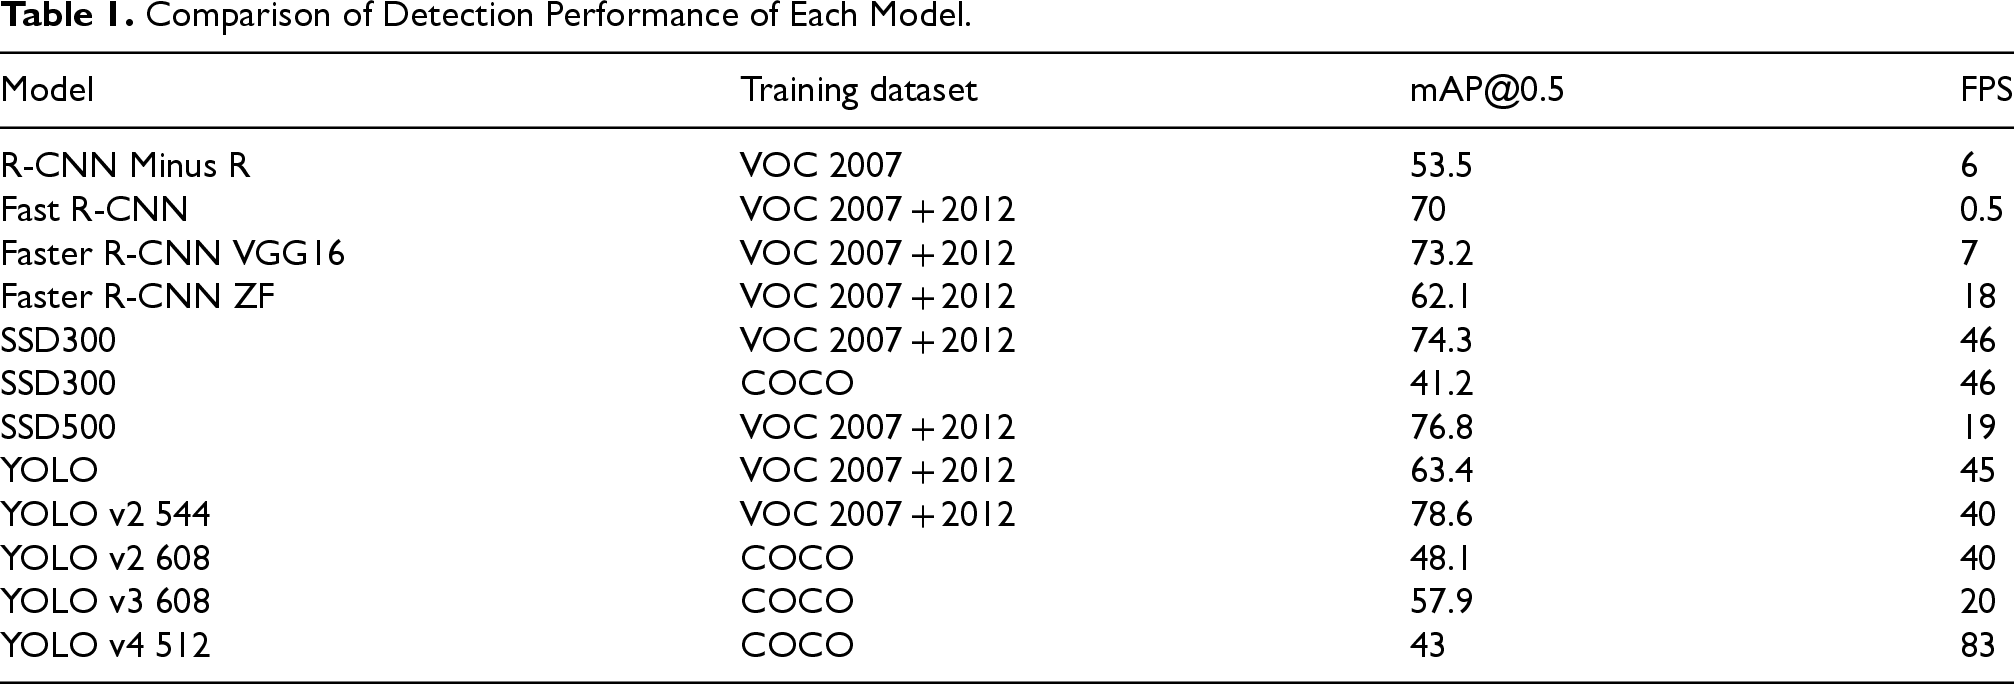
The precise structure of the YOLOv5 model is shown in Figure 1. The input layer, backbone network, neck network, and output layer are the four primary components of the model. The backbone network majorly comprises modules such as convolution (Conv), C3, and spatial pyramid pooling (SPPF). The input layer includes picture preparation, which includes mosaic data enhancement, adaptive image scaling, and adaptive anchor frame adjustment. The neck network optimizes the detection capabilities of the model for targets of different scales by combining the feature pyramid network with the path aggregation network structure to further process the features extracted at different stages. The output layer oversees the detection of the category and position of the target object and primarily comprises a loss function and non-maximum suppression. The feature pyramid network uses upsampling to transfer strong semantic information from deeper feature maps to shallower feature maps, whereas the path aggregation network uses downsampling to transfer position information from shallower feature maps to deeper feature maps.
Architectural Diagram of the YOLOv5 Network.
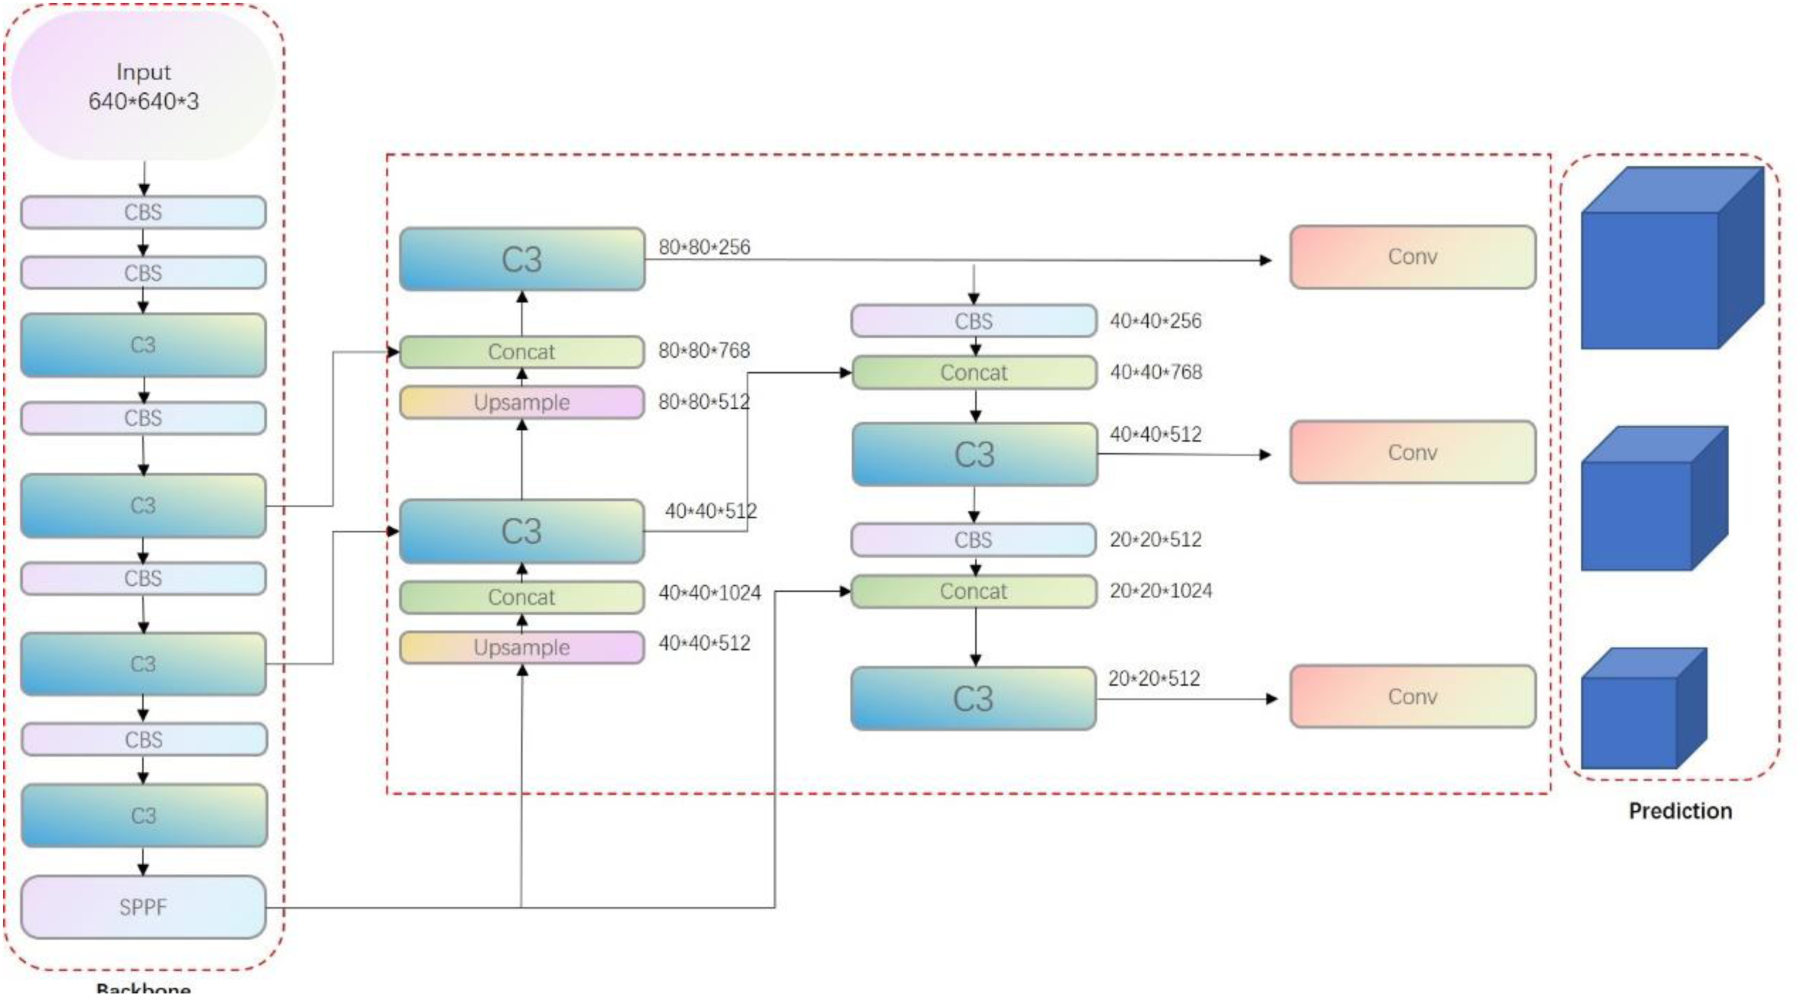
MobileNetV3 (Howard et al., 2019) was selected as the cornerstone for this study. The focus was on the following key factors. First, the model architecture was highly optimized and polished, accurately positioned for mobile and edge device application scenarios, and exhibited excellent adaptability. From the perspective of model complexity, MobileNetV3 has significant advantages in terms of streamlining the number of parameters and low computational complexity. Simultaneously, it does not lose its feature extraction performance owing to the pursuit of lightweighting and can maintain a good performance steadily. Feature extraction capability. Its structure is shown in Figure 2.

Inverted Residual.
This study utilizes the MobileNetV3 network to reconstruct the YOLO backbone feature extraction network to replace the primitive backbone to reduce the computational burden of the YOLOv5 target detection model. The improved structure is displayed in Figure 3.
Pre-Improvement Scenario (a) and Post-Improvement Scenario (b).
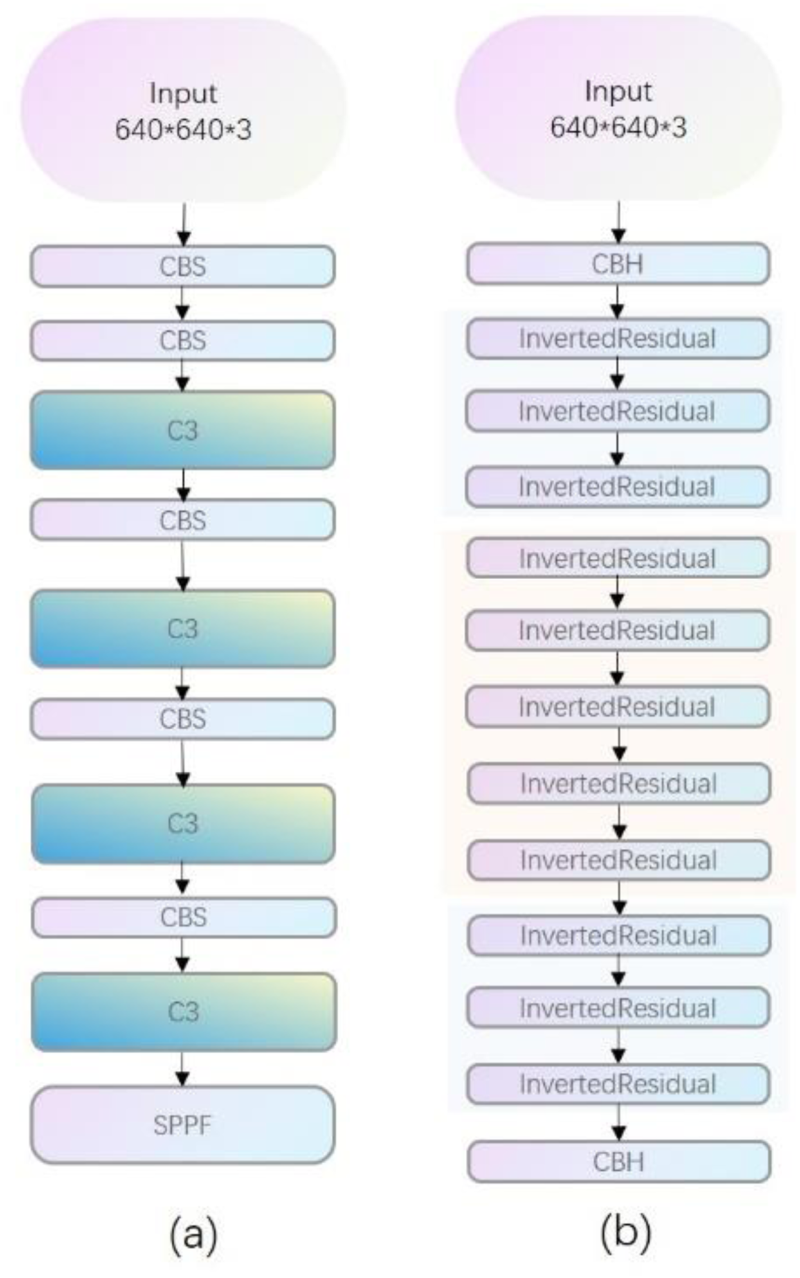
The function of the standard convolutional layer is to extract key features from the input data. When performing the convolution operation, the convolution kernel slides on the input data with a step size S, such that the convolutional layer can effectively extract features from the input data and provide more refined information for the subsequent neural network layers. This process is illustrated in Figure 4.
Diagram of Convolution Operation with P = 1 and S = 2.
Figure 5 shows the contrast between the original image and the image following convolution, and Figure 6 illustrates the convolution effect of a single filter when P = 0 and S = 0. Each filter captures and extracts unique visual information from the initial image, resulting in output images that are unique to each filter. These differentiated output images are fused to produce a comprehensive output of the convolution layer that fully displays the rich features of the image.

Effect of Convolution.

Effect of a Single Filter.
Figure 7 depicts the feature extraction process within the framework of a standard convolution. In this process, the input data undergo simultaneous filtering and integration operations, thereby generating new combined output features. Nevertheless, when confronted with high-resolution and multichannel data, this particular approach invariably leads to a substantial increase in both the parameter count and computational load. Such an outcome can potentially impede the efficiency and scalability of the overall system, warranting further investigation and optimization strategies to mitigate these challenges.
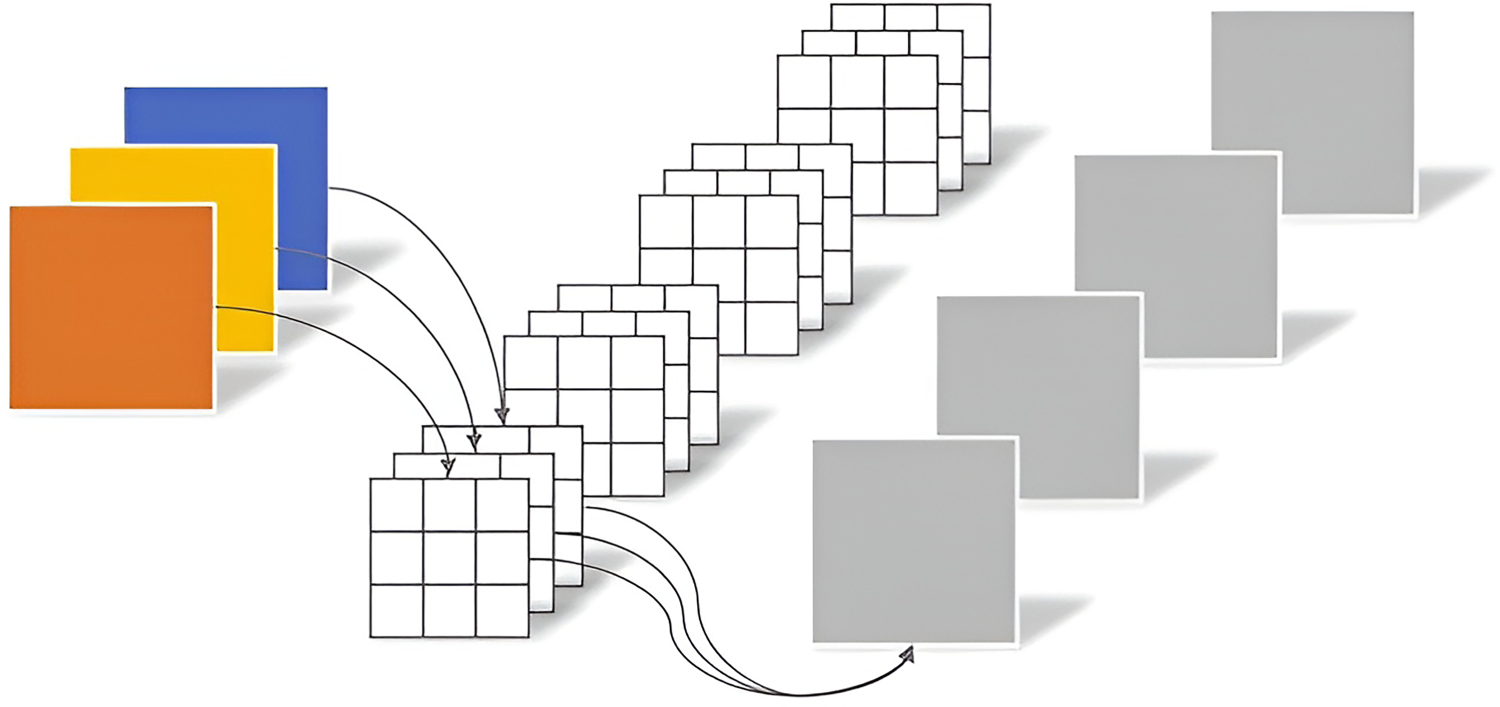
Standard Convolution Process.
A depthwise separable convolution comprises two independent layer structures: a depthwise convolution layer (DWConv) and a pointwise convolution layer (PWConv). As shown in Figure 8, DWConv separately performs spatial filtering on each input channel, whereas PWConv merges multiple DWConv output channels through a 1 × 1 convolution to generate new features.

Schematic of Depthwise Separable Convolution.
This architecture has the advantage of allowing the preceding layer to concentrate on processing information in the spatial dimension, whereas the following layer is responsible for efficiently integrating this information. Depthwise separable convolution increases computational efficiency and flexibility while enabling the model to concentrate more on spatial information and improve feature extraction capabilities through stepwise processing.
Theoretical investigations revealed that depthwise separable convolution can lower computational costs and parameters compared with regular convolution. The theoretical calculation is as follows, where
For an input feature map with 


In summary, taking the number of output channels Cout=32 as an example, the computational costs of depthwise separable convolution and standard convolution are shown in Equation (0.4):
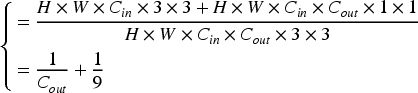
The output channel count of the convolutional layer in the YOLOv5 architecture essentially satisfied the requirement of 32 or more layers. Thus, one can achieve effective dimensionality reduction for the standard convolution by replacing it with a depth-separable convolution of size 3 × 3, which can drastically reduce the calculation amount by approximately 1/8.
The GhostBottleneck (Han et al., 2020) module exhibits a good balance between parameter reduction and feature richness. The GhostBottleneck module uses a series of inexpensive operations to generate additional feature maps that capture sufficient discriminative information. As shown in Figure 9, the GhostBottleneck comprises two stacked GhostConv modules. The latter is responsible for matching them through shortcut branches and lowering the number of channels, whereas the former increases the number of channels. This design preserved the capacity of the model to extract features while lowering the computational cost.

GhostBottleneck Module.
Implementation of the GhostConv module comprises three sequential steps. Initially, a 1 × 1 convolution kernel is employed to reduce the number of channels, thereby generating a compressed feature map. Subsequently, additional feature maps are produced using cost-effective linear operations. Finally, the generated feature maps are concatenated to formulate a comprehensive and rich feature representation that endows the module with enhanced feature extraction and utilization capabilities.
In Figure 10, The C3 module is an efficient component that integrates the cross-stage hierarchical structure (CSP) and the residual idea. It splits the input features: one path is processed by CBS (Conv + BatchNorm + SiLU) and BottleNeck with residual, and the other path is directly retained by CBS. The features of the two paths are thereafter fused through Concat and finally output through CBS.
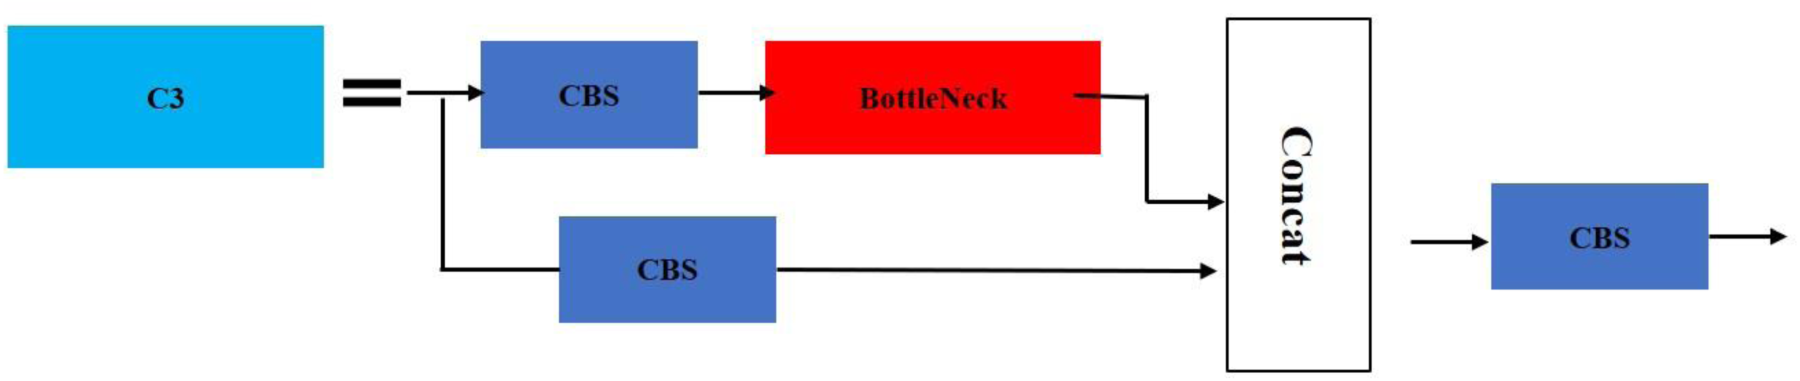
C3 Module.
The C3Ghost module is designed to enhance processing performance while reducing model complexity. By replacing the BottleNeck module in the original C3 module with a GhostBottleneck module, it leverages the latter's ability to generate feature maps with fewer parameters, reducing computational costs. In essence, it optimizes the model structure, reducing the amount of calculation and complexity of the model. Simultaneously, it optimizes gradient propagation with the help of the residual structure, enhances feature diversity and expression ability, improves detection accuracy while being lightweight, and effectively balances computational cost and performance. For a detailed visualization of the specific network structure, refer to Figures 11 and 12 display the enhanced neck structure of the YOLO network.
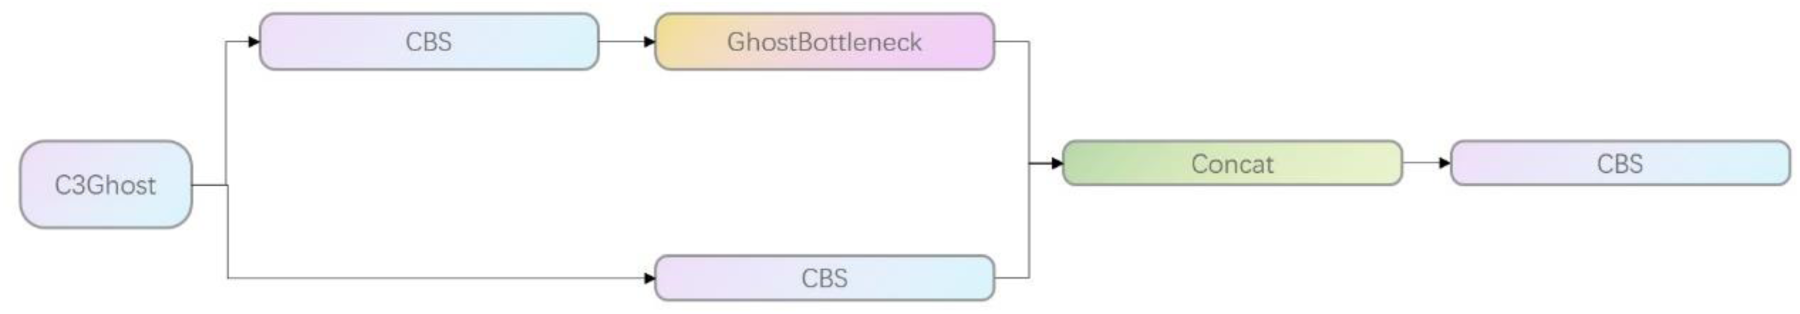
C3Ghost.

Diagram of the Improved YOLO Neck Network Structure.
The attention mechanism imitates human vision, enabling computer vision models to focus on key information and improve the processing efficiency and accuracy. The currently popular hybrid attention mechanism, CBAM (Woo et al., 2018), combines channel attention and spatial attention and enhances the analytical ability of the model by connecting these two sub-modules in series.
As shown in Figure 13, the input features are first processed by the channel attention module, which extracts the channel description by compressing the spatial features. Subsequently, it enters the spatial attention module where spatial features are obtained by compressing the channel features. This process ensures the effective extraction and compression of features and provides an optimized input for subsequent network processing.
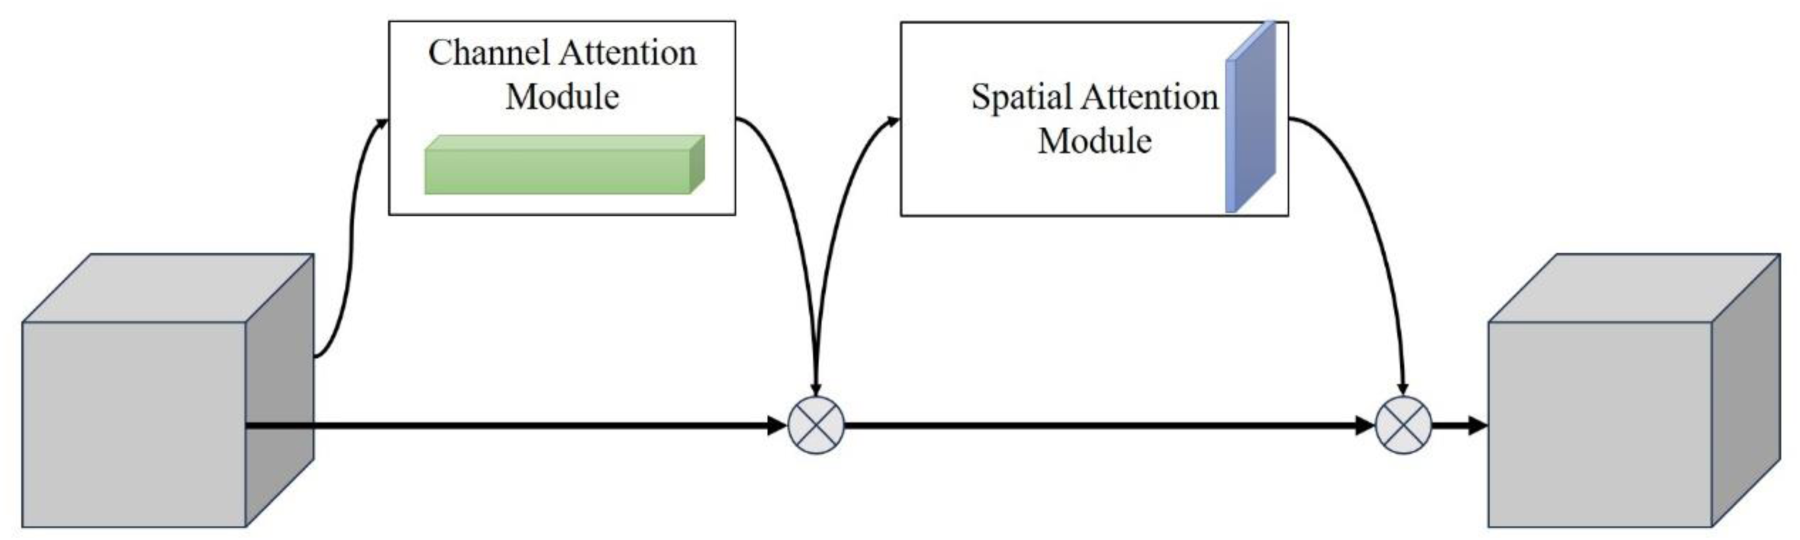
Structural Diagram of the CBAM Module.
CBAM can capture the dependencies between features from the two dimensions of channel and space, and enhance the feature expression ability by sequentially connecting the channel and spatial attention modules; however, this series connection may lead to conflicts between the two attention mechanisms. When one mechanism emphasizes certain features, the other may suppress them, thereby introducing bias in feature extraction and affecting the accurate recognition and analysis of key information by the model. This study proposes a DSA fusion module to circumvent this issue. The goal is to preserve the stability of the training process while preserving the richness of the feature expression. DSA successfully circumvents the limitations that could result from using a single attention mechanism by processing the channel and spatial attention in parallel, enhancing the overall performance and generation capability of the model. Its structure is illustrated in Figure 14.
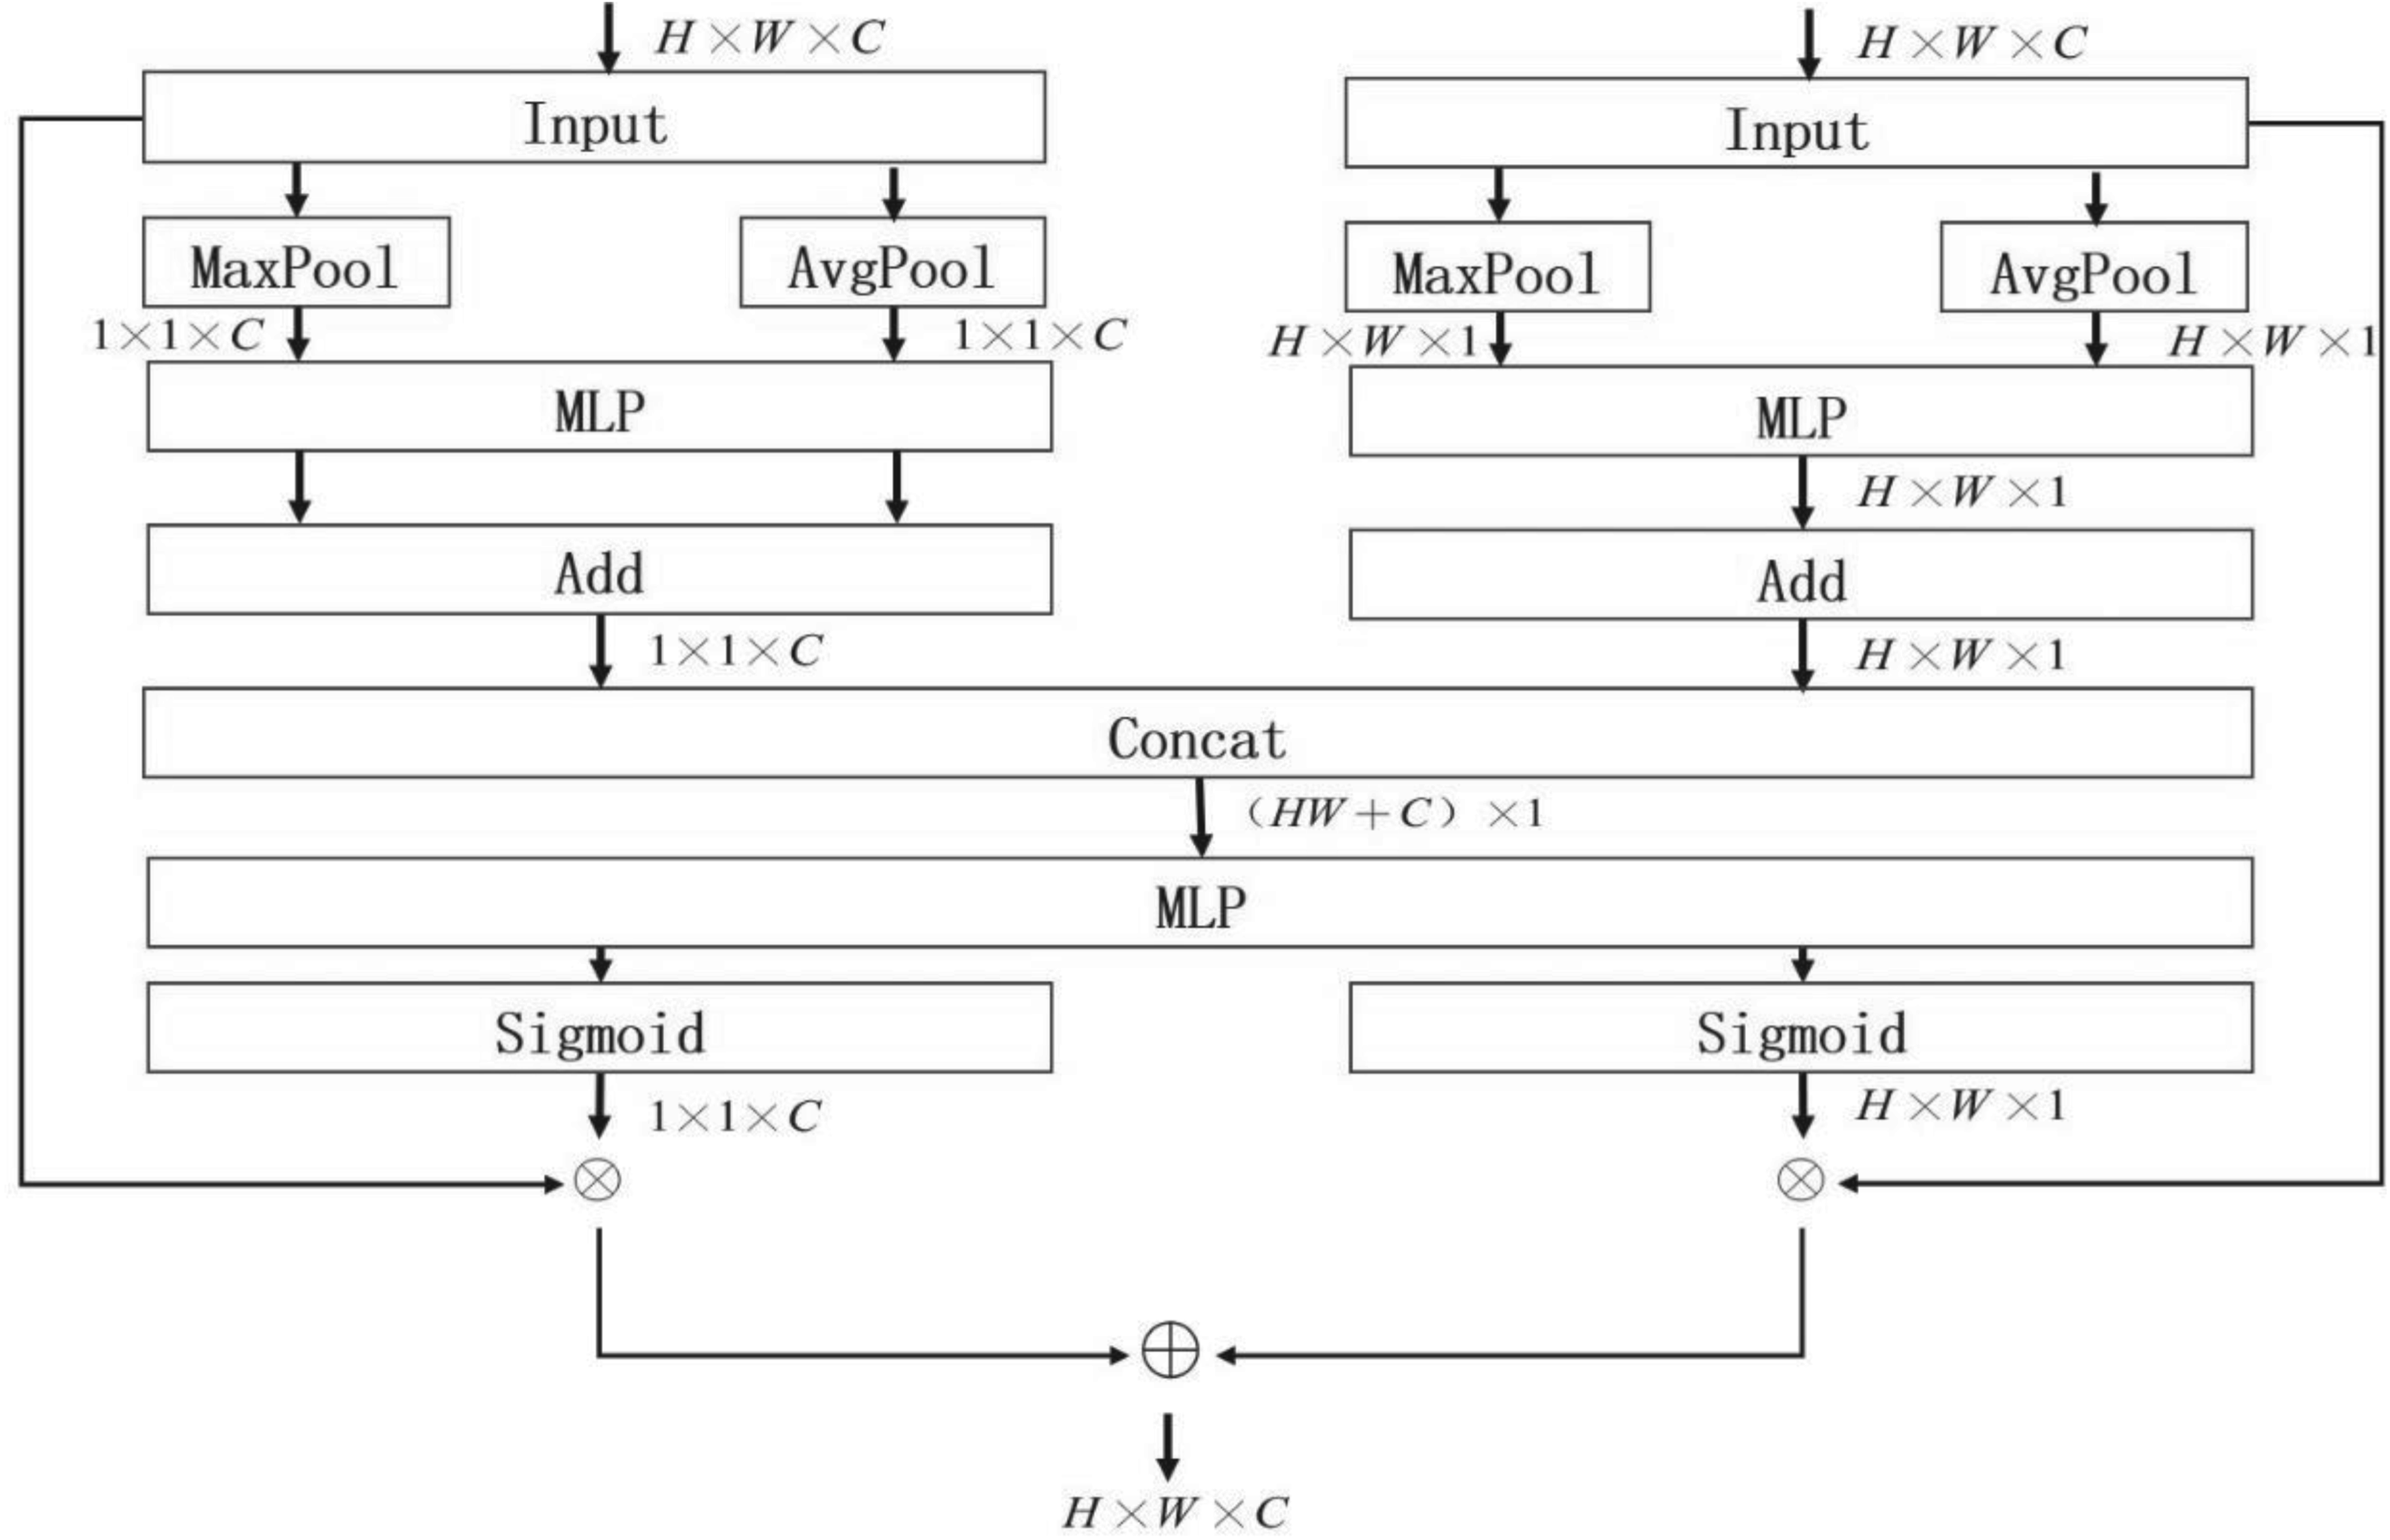
DSA Fusion Module.
First, the channel and spatial descriptions were obtained separately through a pooling operation and subsequently processed by the shared fully connected layer. The processed channel and spatial descriptions were spliced into a unified (HW + C) × 1 vector, which was thereafter input into the shared fully connected layer to develop the correlation between the spatial and channel features. The processed vector was separated into two parts, restored to the original size of the input feature map, and thereafter activated using the activation function. Finally, these activated weights are multiplied by the original input feature map and summed to obtain the final output feature map.
The last layer of the network has the largest number of channels during feature extraction and is, therefore, more susceptible to interference to mitigate this interference and improve the detection performance. This study embedded the DSA attention module at the connection between the backbone network and neck network to study its potential improvement in detection performance.
Speed and accuracy of vehicle detection are crucial in smart cars. Therefore, it is not advisable to simply improve the speed or accuracy while sacrificing others. This study aims to balance the two. The YOLO model was selected as the basic architecture, and the MobileNetV3 network was used to optimize its feature extraction network, replacing the original backbone structure. To further reduce the number of model parameters, depthwise separable convolution was introduced to replace the traditional convolution operation, and the bottleneck module in the C3 module was upgraded to the GhostBottleneck module, thereby designing the C3Ghost module. In addition, to enhance the feature extraction capability, a two-stream attention fusion module was developed to enhance the expressiveness of features by strengthening the focus on key feature channels. This module was integrated at the junction of the backbone and neck networks to enhance the feature capture of the key areas of the target. Finally, an improved MDE-YOLO network model was proposed to achieve high accuracy and fast response for vehicle detection. The detailed structure is shown in Figure 15.
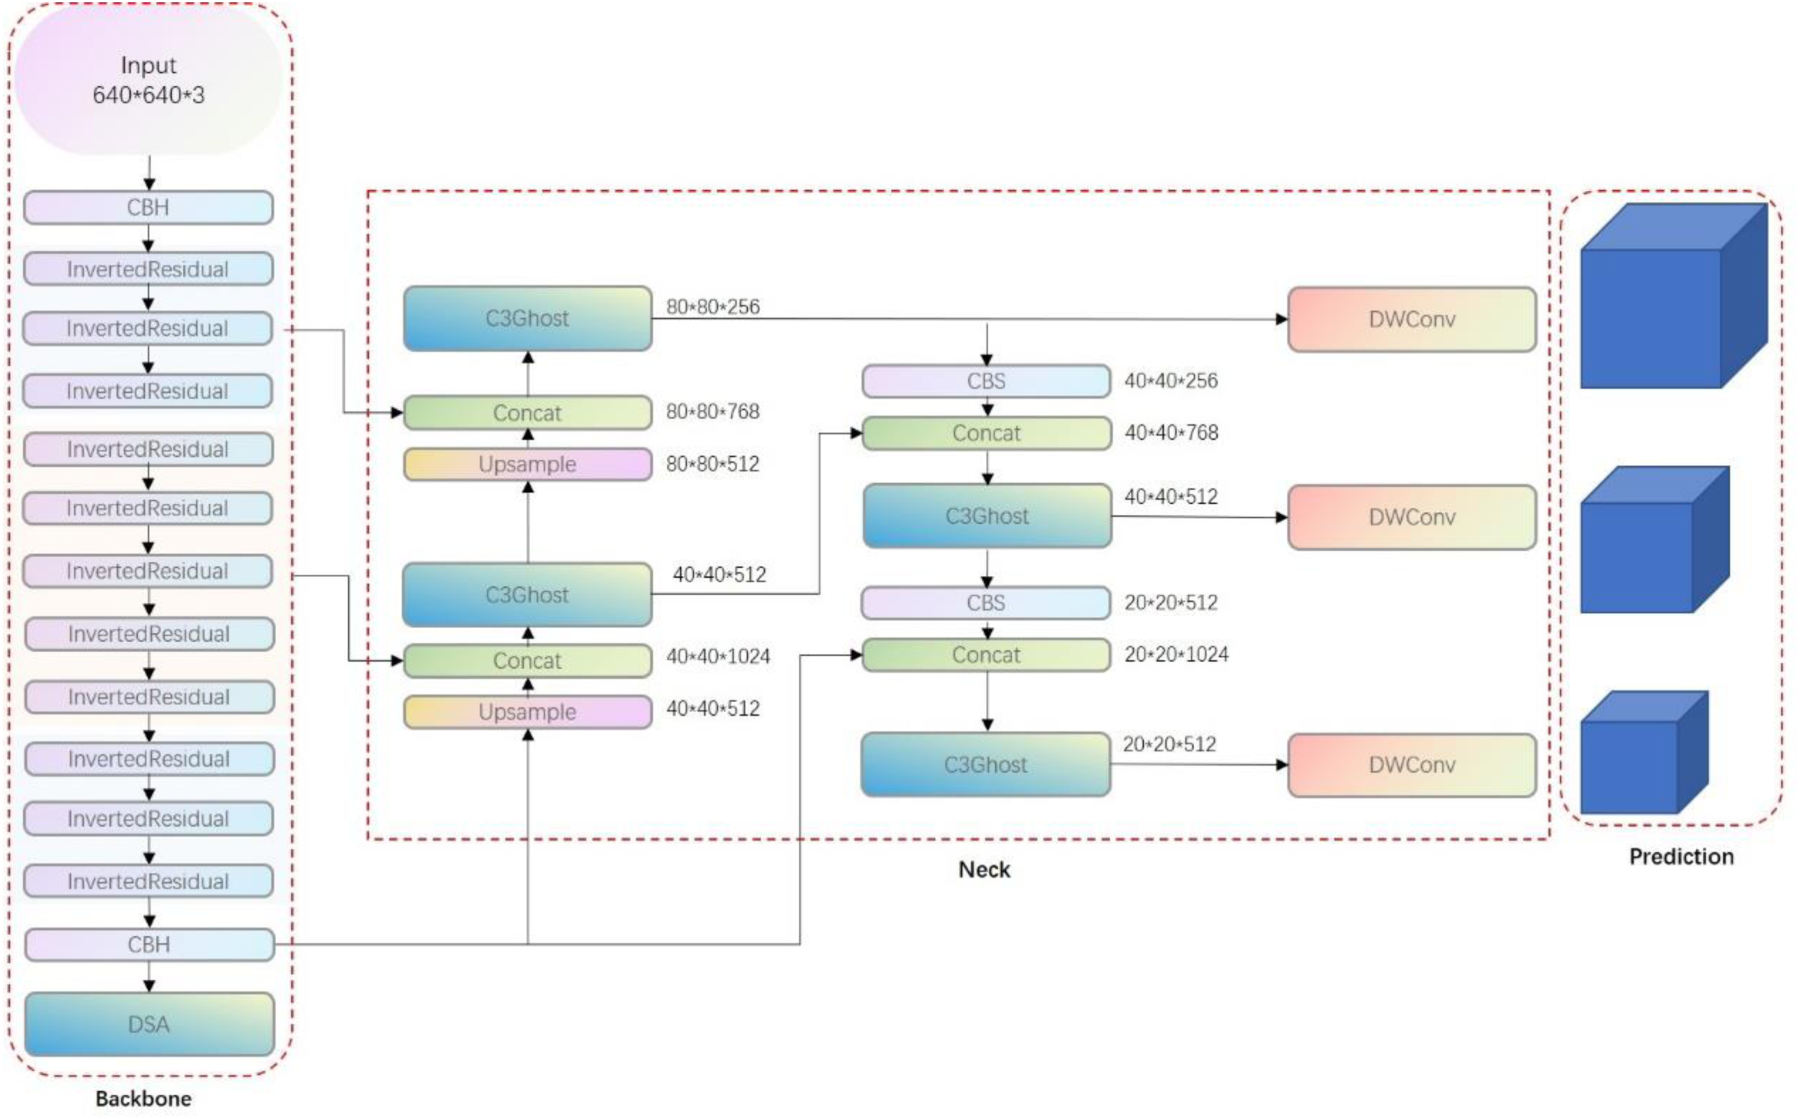
MDE-YOLO.
Experimental Environment and Dataset Selection
All experiments presented in this paper were conducted on a unified platform. The corresponding configuration details are listed in Table 2. The model was tested using an NVIDIA Jetson Xavier NX.
Experimental Platform Configuration Table.
Experimental Platform Configuration Table.
The training cycle of the model was initially set to 100 iterations to observe convergence prior to the experiment. The number of iterations was changed to 50 after testing, which revealed that the model converged after 50 training sessions. To satisfy the input criteria of the MDE-YOLO model, the original image data were pre-processed during the experiment, including sample screening and resolution correction. Finally, each image was uniformly resized to 640 × 640 pixels. The processed dataset was approximately 802 MB in size and contained 12,035 pictures of four different vehicle types. To ensure that the model could be fully trained and verified on the data at different stages, the dataset was divided into training, validation, and test sets in an 8:1:1 ratio, thereby improving the accuracy and reliability of the model evaluation.
This study selected the UA-DETRAC dataset (Wen et al., 2020), which was captured using a Canon camera with a 960 × 540 pixel image resolution and gathered from 24 distinct locations in Beijing and Tianjin, China. Of the almost 140,000 image frames in UA-DETRAC, 8,250 vehicles have been manually annotated, yielding a total of 1.21 million object bounding boxes identified. A total of 12,035 high-definition photos were selected for this study to create our research dataset. A portion of the data is shown in Figure 16.
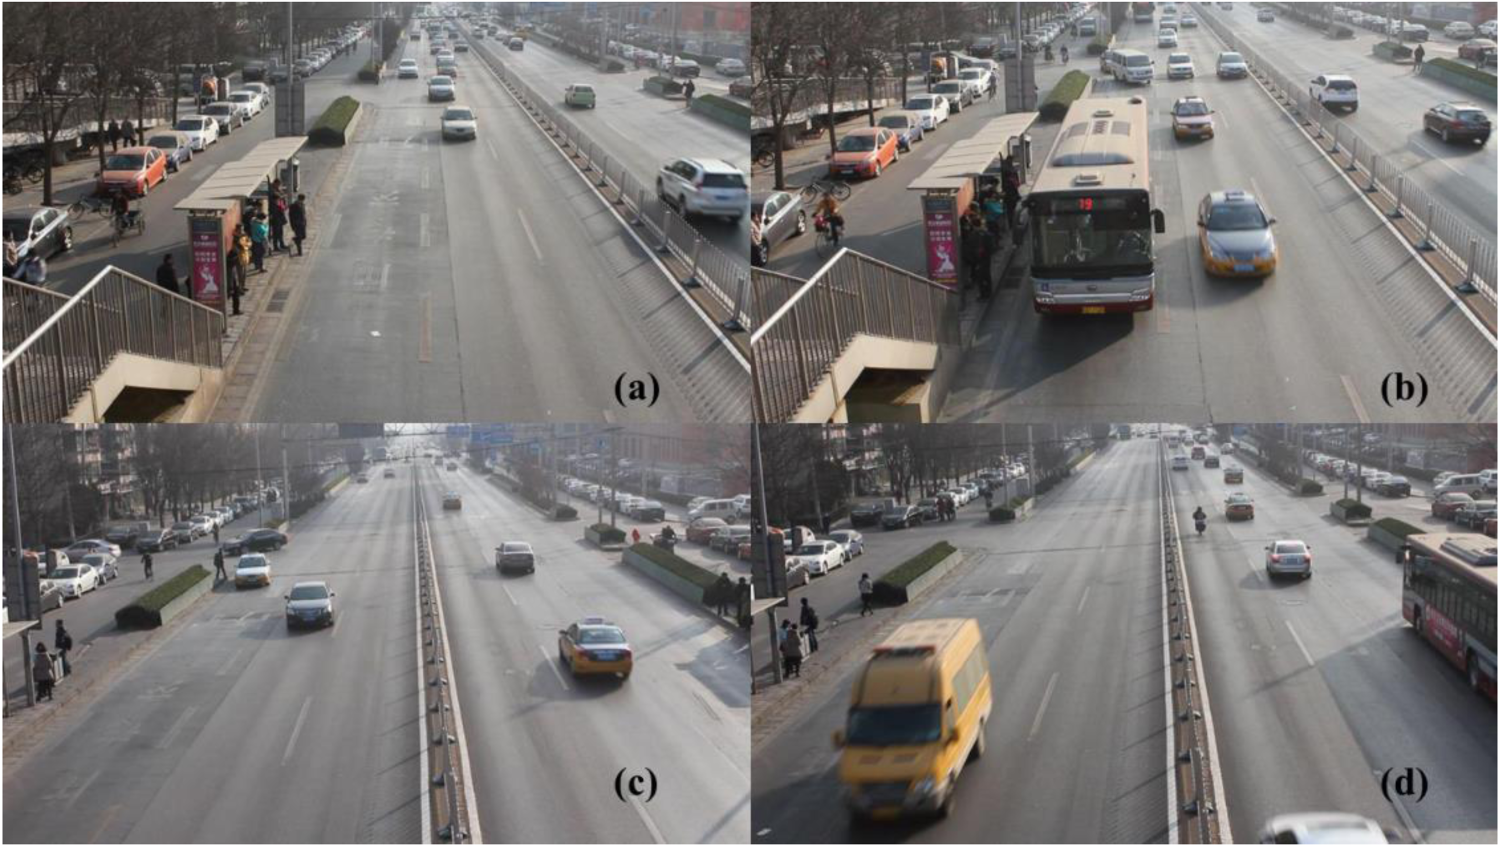
UA-DETRAC (Partial) Dataset.


The mAP is the value obtained by averaging the average accuracy of each category. In the Equation (0.5), C denotes the different types of objects, N (classes) denotes the number of categories, and AP is the average detection accuracy of the target object; the number of parameters indicates the size of the model and establishes how much memory it uses. The space requirements of the model increased with the number of parameters. The number of parameters for the convolutional layer was determined using Equation (0.6), where
The FPS represents the maximum number of images that the algorithm can process per second when the hardware conditions of the peripherals are the same. This evaluation index directly reflected the detection speed of the algorithm. The faster the speed, the higher is the real-time performance, which is more suitable for practical applications.
Table 3 summarizes a performance comparison of the three convolution operations: standard convolution (Conv), depthwise separable convolution (DWConv), and GhostConv.
Convolution Performance Comparison Table.

Convolution Performance Comparison Table.
In the performance testing phase, a comprehensive analysis of the experimental data revealed that the standard convolution (Conv) exhibited suboptimal performance in terms of both time efficiency and computing resource utilization. Specifically, it recorded an average time consumption of 0.13564 s, an FPS value of 7.37, a computational workload of 77.578G FLOPs, and a parameter burden of 147.840 K. In contrast, depthwise separable convolution (DWConv) demonstrates more remarkable efficacy in curtailing the computation volume and parameter count. From a temporal perspective, the total time expenditure was substantially reduced to 18.14557 s, with the average time consumption concomitantly dropping to 0.09073 s. In terms of performance metrics, the FPS climbs robustly to 11.02, the computational load diminishes to 9.731G FLOPs, and the parameter load is likewise pared down to 18.304 K. Notably, the GhostConv outperforms its counterparts across all comprehensive evaluation indicator systems encompassing time, frame rate, computational complexity, and parameter quantity, thereby achieving the most superior performance. The detailed data indicate that it attains the shortest total time consumption of 11.82605 s, lowest average time consumption of 0.05913 s, and highest FPS value of 16.91. It further optimizes the computational load to 4.865 G FLOPs and features the least number of parameters at only 9.472 K.
By eliminating or modifying certain model components, ablation studies can assess the effect of these elements on the overall performance of the model. The contribution of these elements to the model performance was ascertained by comparing the performance changes before and after the experiment. Five sets of ablation tests were performed to confirm the efficacy of each module. All experiments were conducted in the settings outlined in Section 3.1. Each set of experiments selected the best weights to be used as the model's weight file during training and focused on assessing the influence of a particular module in the model. The validation set was assessed to confirm the effect of each set of ablation experiments.
Comparison of the Impact of Improved Strategies on Network Layer Calculations and Parameters
In Table 4, √ is used to indicate the modification that has been completed while × indicates that the item remains unchanged. Improvement 0 used YOLOv5 s as the baseline model for the performance comparison, and Improvement 1 optimized the backbone by introducing the MobilenetV3 architecture. Based on Improvement 1, Improvement 2 replaces the quasi-convolution with a depthwise separable convolution. Next, Improvement 3 reconstructs the C3 module using GhostBottleneck. Finally, Improvement 4 incorporates the DSA fusion module based on Improvement 3.
MDE-YOLO Improvement Overview Table.
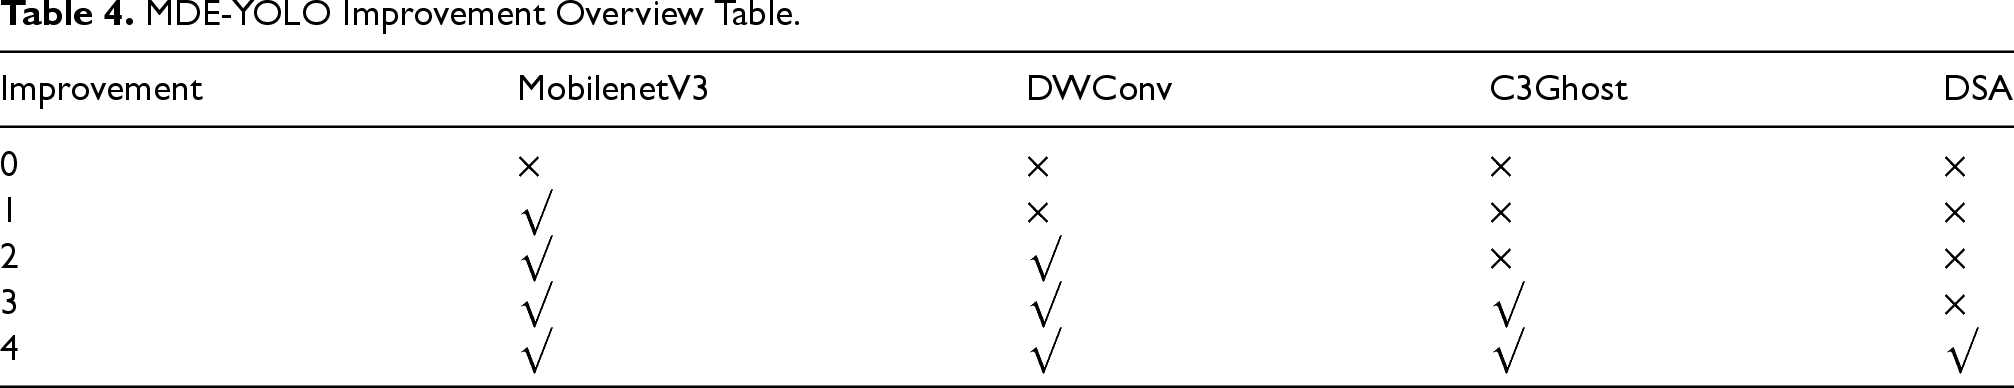
MDE-YOLO Improvement Overview Table.
In Table 5, upon optimization, the number of parameters was significantly decreased by substituting the depthwise separable convolution layer (DWConv) for the standard convolution layer (Conv): the parameters of the first layer Conv dropped sharply from 147,968 to 2,816, a drop of up to 98.08%; in the second layer, the parameters of Conv dropped from 33,024 to 512, a reduction of 98.45%; the parameters of the third layer Conv also dropped from 147,712 to 2,816, a reduction of 98.09%. After further upgrading the C3 module to the C3Ghost module, the parameter reduction effect was also significant; the parameters of the first-layer C3 module were reduced from 308,736 to 155,360, a decrease of 49.71%; the parameters of the second-layer C3 module were reduced from 77,568 to 39,792, a decrease of 49.05%; the parameters of the third-layer C3 module decreased from 296,448 to 143,072, a decrease of 51.71%.
Model Performance Parameter Optimization Comparison Table.

From Table 6, we can observe that after using MobilenetV3 to reconstruct the backbone part, the model achieved a 60.6% reduction in computational complexity, approximately 50% reduction in parameters, 47.5% reduction in weight file size, and 5.1 ms reduction in detection time with only a 5.6% performance loss. On this basis, after replacing the standard convolution with depthwise separable convolution, the mAP only decreased by 1.1% while the number of parameters was reduced by 23.2%, computational complexity was reduced by 17.3%, and weight file size was slightly increased, but the detection time remained unchanged. After using GhostBottleneck to reconstruct the C3 module, the mAP increased by 1.2% while the number of parameters was further reduced by 26.6%, computational complexity was reduced by 30.8%, weight file size was reduced by 40%, and inspection time increased by 0.1 ms. After introducing the DSA fusion module, the model further improved the mAP@0.5 performance while keeping the computational complexity and detection time unchanged. Compared with YOLOv5 s, MDE-YOLO only dropped 0.5% in mAP@0.5, but the number of parameters was reduced by 69.9%, amount of computation was reduced by 77.5%, weight file size was reduced by 67.8%, and detection time was shortened by 5.0 ms.
Ablation Experiment Performance Comparison Chart.
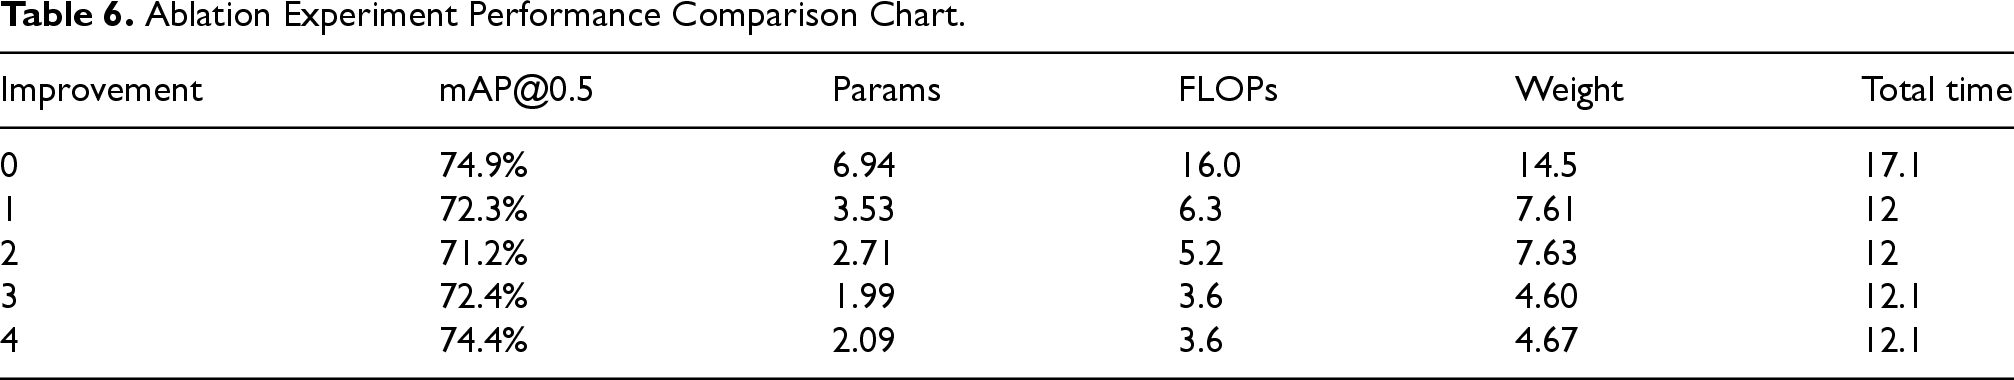
Ablation Experiment Performance Comparison Chart.
The detection effect of some test set images on MDE-YOLO is shown in Figure 17. The type of detection and recognition is marked directly above the box, along with the numerical value after it represents the confidence of the model in the prediction, which range from 0 to 1.0. The larger the value, the higher is the accuracy. The objects identified as “car” and “bus” are accurately located, and their confidence levels are both over 0.8. Taking the picture in the second row and first column of the figure as an example, although the background is relatively complex and the proportion of the object in the image is not large, the recognition accuracy of the model reaches 0.90, which demonstrates the good detection effect of the model.
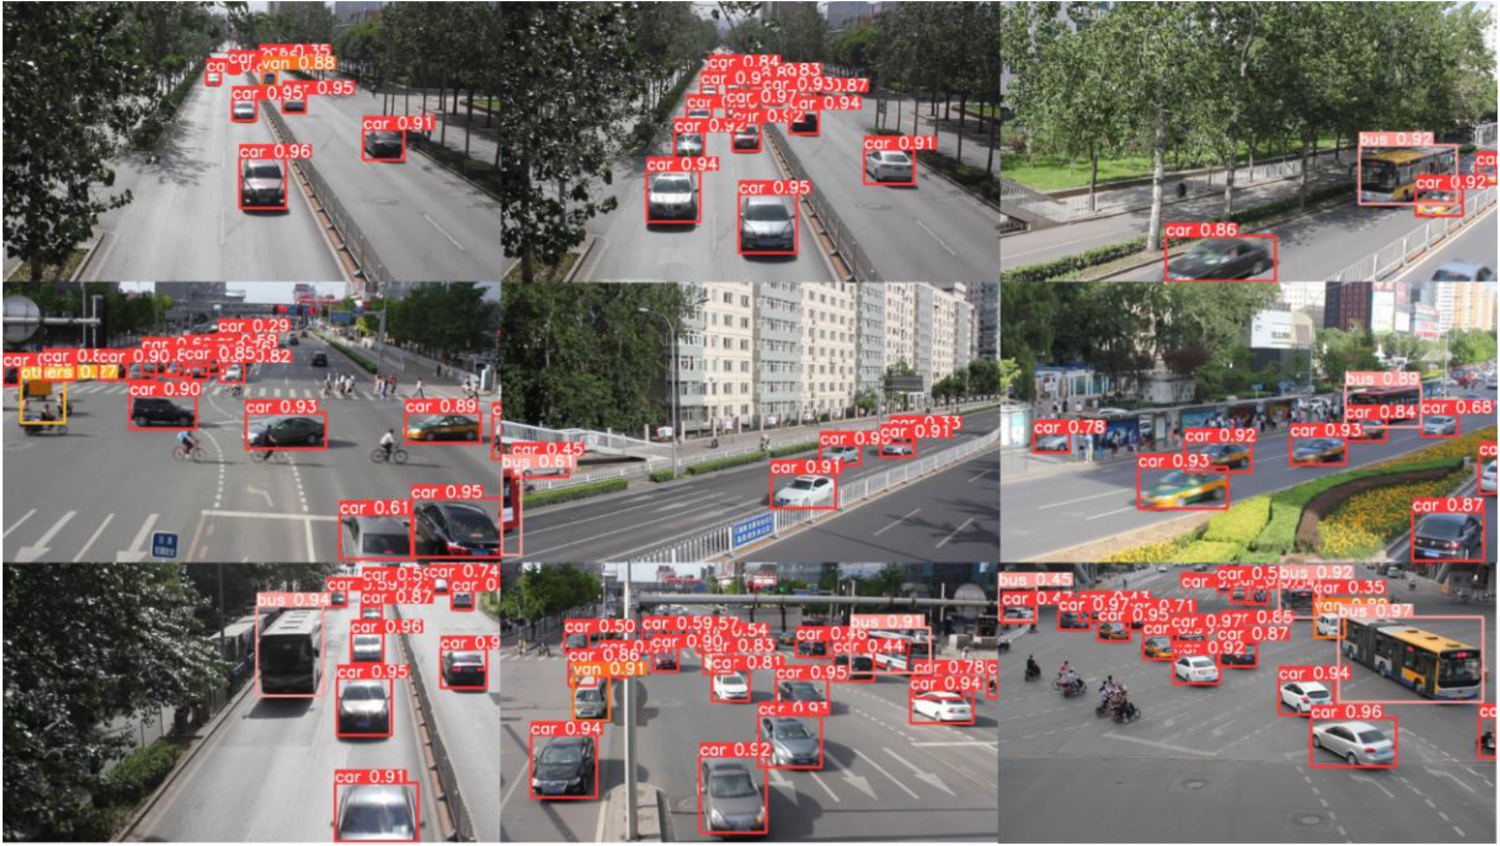
MDE-YOLO Test Result.
The paired samples t-test is suitable for comparing the difference in the means of two related sample groups. MDE-YOLO and YOLOv5 s were trained on the same dataset and under the same experimental conditions. Therefore, their test results can be regarded as related samples. Through the paired sample t-test, we controlled for external variables that may affect the results of the experiment and compared whether a significant difference existed to determine whether the improvement had a significant impact on the original model.
Principles of the Paired Samples t-Test
Suppose that the measurements of two related samples are 
Resulting in n paired differences 

MDE-YOLO and YOLOv5 s were tested on the same dataset under identical experimental conditions and 50 paired test results were obtained (n = 50). As the paired sample t-test assumes that the differences follow a normal distribution, we first examined the normality of the difference data. Through visual inspection using a Q–Q plot and statistical verification via the Shapiro-Wilk test, the difference data were found to be approximately normally distributed, meeting the assumption required for the t-test.
After confirming the normality assumption, we computed the difference in values for each pair and performed a paired sample t-test. Table 8 summarizes the results of the study.
According to the results of the t-test in Table 7, the P-value for the precision index, recall index, and mAP was 0.000, which is far less than the predetermined significance level threshold of 0.05. Consequently, there is ample justification to reject the null hypothesis and conclude that the two model groups exhibit notable variations in the three crucial performance metrics of precision, recall, and mAP, demonstrating that the performance of the model in this investigation was significantly improved by several enhancement measures.
Paired Samples t-Test Results.
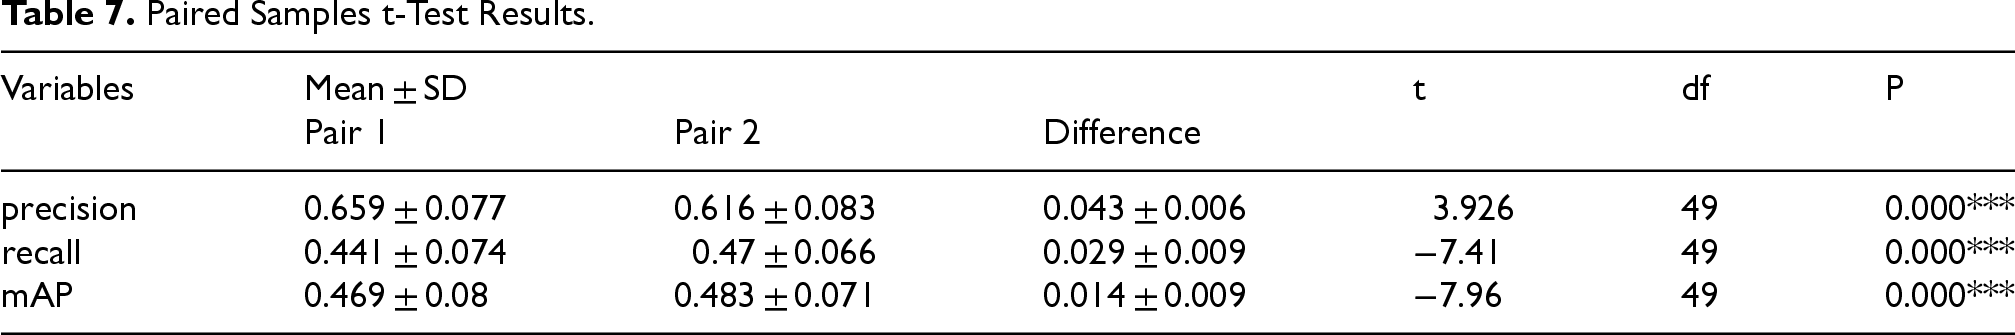
Paired Samples t-Test Results.
Comparison of MDE-YOLO with YOLOv7 and YOLOv8 on UA-DETRAC Dataset.

The improved model was compared with YOLOv5s, YOLOv7, and YOLOv8s to prove the rationality of the improvement of the YOLOv5 model in this study. The experimental results were compared, as summarized in Table 8.
From the perspective of computing complexity, the parameter quantity of YOLOv7 is as high as 34.80, floating-point operation quantity reaches 103.2, and the corresponding weight file size is 71.30; the parameter quantity of YOLOv8s is 10.60, FLOPs is 28.6, and weight is 22.50. Compared with the improved MDE - YOLO, the two exhibit extremely high computing requirements. In practical application scenarios, particularly when deploying devices involving edge computing or resource-constrained resources, excessive calculation and parameter amounts will not only put huge pressure on the device's storage capacity but will also lead to low operational efficiency and difficulty in meeting the real-time detection demand.
Focusing on the key performance indicator of average accuracy (mAP@0.5), although YOLOv7 reached 80.2% and YOLOv8 s was 80.1%, which has certain advantages compared with MDE - YOLO's 74.4%, but combined with a comprehensive analysis of computing resource consumption, the improvement in accuracy is not cost-effective. MDE - YOLO has achieved feasibility in resource-constrained environments while significantly reducing the number of calculations and parameters and improving practicality.
By contrast, the improved MDE - YOLO exhibited significant performance in multiple dimensions. Excellent in lightweight design, with only 2.09 parameters, as low as 3.6 FLOPs and 4.67 weight file size, which achieves orders of magnitude reduction compared with the original YOLOv5s and the more complex YOLOv7 and YOLOv8s, which enables it easily to adapt to various resource-deprived edge devices, such as microprocessors equipped with intelligent traffic cameras and drones, to ensure stable operation under limited computing power.
In terms of detection accuracy, although the mAP@0.5 index reaches 74.4%, slightly lower than YOLOv7 and YOLOv8s, in actual complex traffic scenarios, combined with its lightweight advantages, it can still provide relatively reliable vehicle detection results. For instance, in complex situations such as rapid shuttling and frequent occlusion of a large number of vehicles, MDE - YOLO can capture vehicle information promptly with its efficient computing speed. Although the accuracy was slightly inferior, it was sufficient to satisfy the traffic flow. Basic application requirements, such as the monitoring and preliminary screening of illegal vehicles, have achieved an effective balance between efficiency and accuracy.
Comparison of Model Performance on Different Datasets
We compared MDE-YOLO with YOLOv5s on a traffic camera object detection (TC) dataset to better illustrate its generalization ability. The TC dataset (Snyder & Do, 2019) is a collection of enhanced random screenshots from traffic cameras in Chicago, Illinois, USA. The dataset contained 5248 training, 291 test, and 582 validation images. The comparison results are summarized in Table 9.
Performance Comparison Between MDE-YOLO and YOLOv5s on TC Dataset.
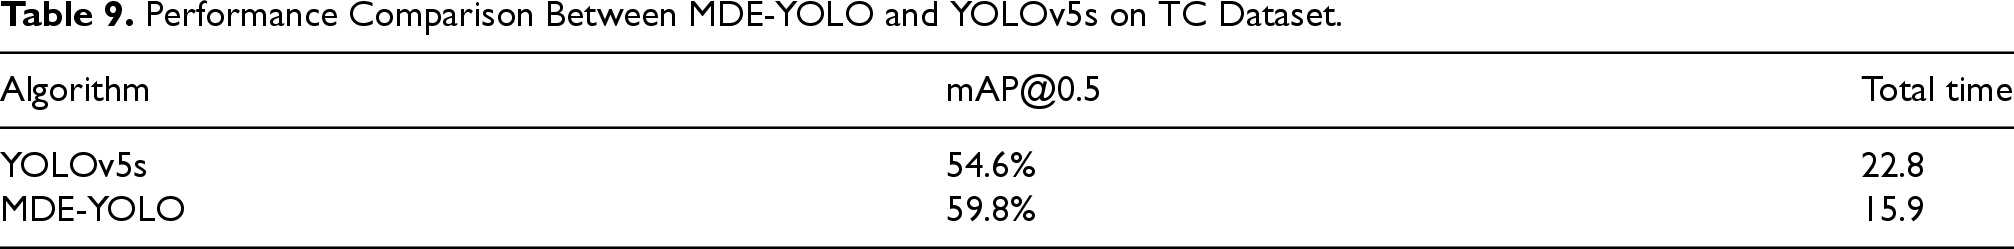
Performance Comparison Between MDE-YOLO and YOLOv5s on TC Dataset.
MDE-YOLO outperforms YOLOv5s in both accuracy and processing speed. The mAP increased by approximately 5.2 percentage points to 59.8%, and the running time was reduced by approximately 7 s. Therefore, the MDE-YOLO model is more suitable for resource-constrained environments, significantly reducing the processing time while maintaining high accuracy in actual application scenarios. Some detection results are shown in Figure 18. It can be observed that MDE-YOLO can not only detect small-sized targets, but its detection accuracy is also higher.
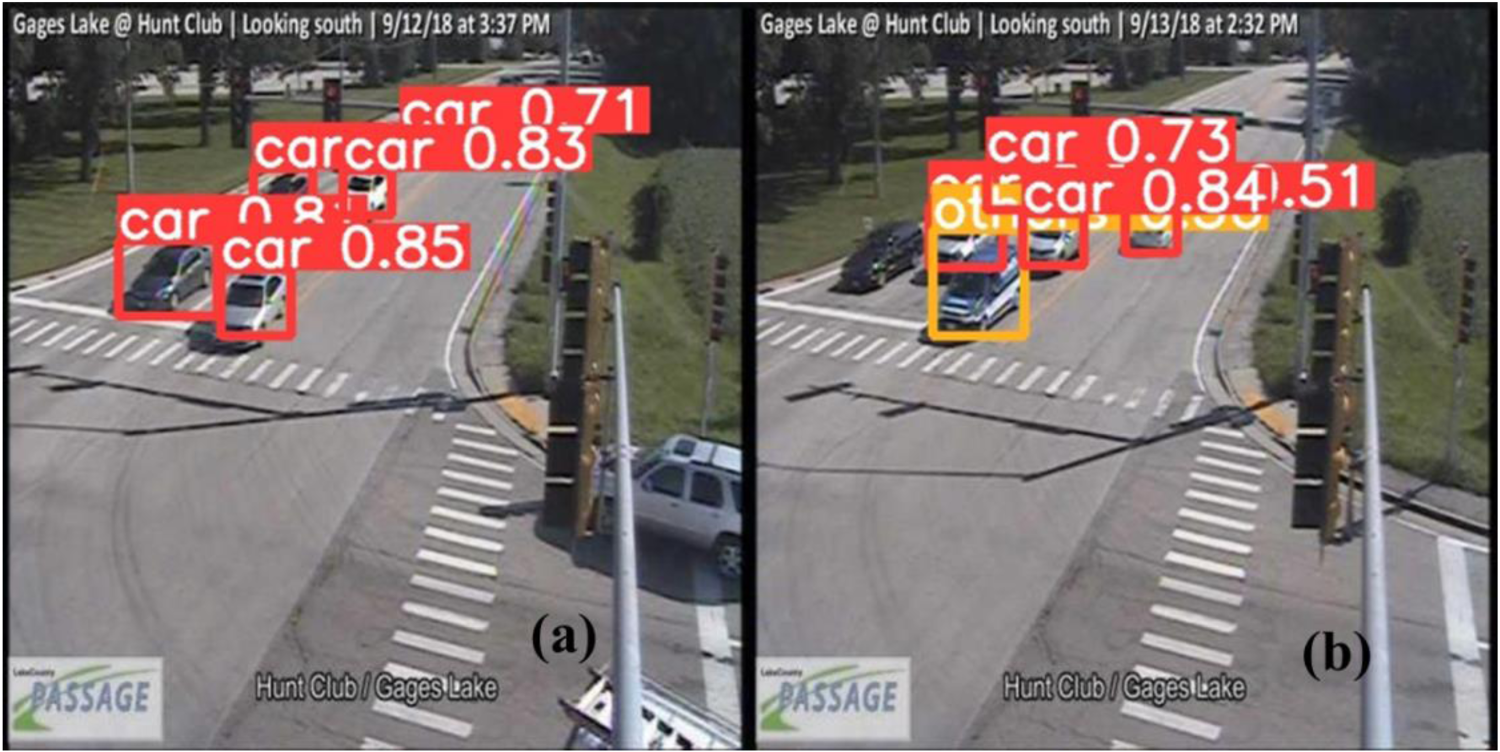
Visual comparison of MDE-YOLO (a) and YOLOv5s (b) results in the TC dataset.
To explore the role of the attention mechanism in improving model performance, this study replaced the backbone network with MobilenetV3, replaced the standard convolution operation with a depthwise separable convolution, and reconstructed the C3 module using GhostBottleneck. Further experiments were conducted on the effects of three different attention mechanisms on the network: SE (Hu et al., 2018), CBAM, and DSA fusion mechanisms.
The experimental results are summarized in Table 10, where “None” implies that after the above improvements, no attention mechanism is added to the end of the network, which is used as a comparison benchmark. From the table data, it can be observed that after integrating SE, CBAM, and DSA, the model did not result in a significant increase in the number of parameters, calculations, or weights. Notably, DSA is more effective in improving the performance, and the reduction in the number of calculations, parameters, and weight size is lower than that of the SE and CBAM mechanisms. Therefore, DSA was added to the end of the backbone network to improve channel attention, suppress unimportant features, and enhance the representation of important features, thereby further improving the detection accuracy of the model.
Comparison of Results of Different Attention Mechanisms.
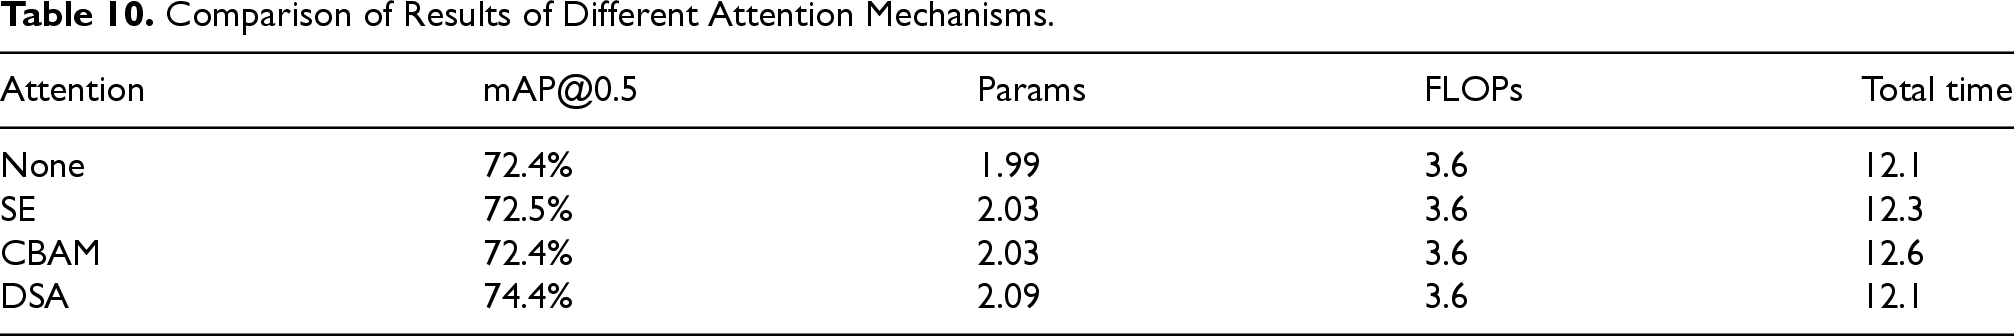
Comparison of Results of Different Attention Mechanisms.
This study proposed an optimized MDE-YOLO recognition algorithm, specifically tailored for resource-constrained edge computing devices, to address the issue of the vehicle recognition algorithm in monitoring scene network construction being unduly reliant on hardware computing power. The original YOLOv5 backbone was reconstructed using the MobilenetV3 backbone network. Simultaneously, the standard convolution operation was replaced by a deep separable convolution, and the C3 module was reconstructed using the GhostBottleneck module. A DSA mechanism module was added to the end of the backbone network to improve the prediction accuracy of the model. According to the testing results, the novel approach reduced the number of parameters, calculation amount, and model weight by 69.9%, 77.5%, and 67.8% in comparison to YOLOv5, respectively, whereas the average recognition rate only decreased by 0.5%.
In several real-world scenarios, a 0.5% decrease in recognition rate is generally considered acceptable, particularly when weighed against significant gains in efficiency and resource savings. For instance, a reduction in model parameters (by 69.9%), computational load (by 77.5%), and weight (by 67.8%) significantly enhanced the deployability of the model on resource-constrained edge devices. This makes it particularly advantageous in environments where the processing power, energy consumption, and memory are limited. In numerous practical applications, particularly intelligent transportation and surveillance systems, a slight decrease in accuracy is often overshadowed by the benefits of lower hardware costs and faster processing times. A marginal 0.5% decrease typically does not compromise the overall performance or reliability of the system. The acceptable accuracy range varies depending on the application used. In safety-critical systems, even a small reduction might warrant further evaluation; however, in several monitoring or non-critical applications, the tradeoff is well justified.
The approach employed in this study efficiently lowers the hardware cost for the development of intelligent transportation networks, simplifies the deployment of inexpensive processors, and significantly lowers the requirement for hardware computing power while preserving detection accuracy. This dramatic reduction in computing power requirements translates directly into three key real-world benefits for intelligent transportation networks.
Cost savings: The lightweight architecture enables deployment on low-cost embedded GPUs, such as the NVIDIA Jetson Nano (4GB RAM), instead of on high-end GPUs (e.g., RTX 3090). For a city-scale traffic monitoring network with 500 nodes, hardware procurement costs can decrease by $1.2 M compared to YOLOv5-based systems. This aligns with industry trends, where quantized models reduce total cost of ownership by 60–80% in edge artificial intelligence deployments. 2) Deployment flexibility: Reduced model complexity allows distributed edge nodes to handle real-time vehicle detection tasks locally, minimizing reliance on centralized cloud servers. This enhances system reliability in scenarios with limited network bandwidth, such as tunnels or remote highways. In bandwidth-constrained environments (≤5 Mbps), the system maintains 98.3% uptime versus 76.2% for cloud-based alternatives. Tunnel monitoring trials exhibited 41% faster incident response time through local processing. 3) The reduced computational footprint (77.5% FLOPs reduction) allows flexible deployment across heterogeneous hardware. As the number of computations is significantly reduced, the system can flexibly adapt to the deployment requirements of different hardware platforms. For instance, the model can be scheduled to NPUs during peak hours to achieve 28 FPS real-time detections and can run on ARM CPUs during off-peak hours to dynamically adjust hardware resources.
Considering the inherent limitations of single-sensor vehicle detection models in practical scenarios, the integration of multisensor fusion technology represents a significant future direction. The proposed MDE-YOLO architecture offers a promising foundation for such developments. A potential improvement for future work would be the incorporation of LIDAR and radar data. Specifically, LIDAR point cloud data can be preprocessed through voxelization and subsequently projected onto a two-dimensional image plane for effective fusion with the features extracted by MDE-YOLO. These projected features can be integrated at various network levels, particularly within the neck feature fusion module, to enhance the detection robustness, particularly in occluded or cluttered environments.
Similarly, radar data offer complementary temporal and spatial information such as object speed and distance. We plan to extract motion-related vectors and fuse them deeply with image features by generating radar-based feature maps (e.g., from distance Doppler data). This multimodal approach can significantly improve detection performance under adverse conditions, such as poor lighting or fog.
In future real-world testing, we aim to evaluate the enhanced MDE-YOLO model under diverse environmental conditions using public and proprietary multisensor datasets. These efforts will further validate the practicality, robustness, and scalability of the model.
Footnotes
Acknowledgement
This work was supported by the National Social Science Fund [Grant Numbers 24BTJ068]; Key Humanities and Social Science Fund of Hubei Provincial Department of Education [Grant Numbers 20D043]; Humanities and Social Science Fund of Hubei Provincial Department of Edu-cation [Grant Numbers 22Y059]; Hubei Innovation Training Program [Grant Numbers S202210500136].
Funding
The authors disclosed receipt of the following financial support for the research, authorship, and/or publication of this article: This work was supported by the the National Social Science Fund, Humanities and Social Science Fund of Hubei Provincial Department of Edu-cation, Key Humanities and Social Science Fund of Hubei Provincial Department of Education, Hubei Innovation Training Program, (grant number 24BTJ068, 22Y059, 20D043, S202210500136).
Declaration of Conflicting Interests
The authors declared no potential conflicts of interest with respect to the research, authorship, and/or publication of this article.