
Abstract
Estimating the effects of randomized experiments and, by extension, their mediating mechanisms, is often complicated by treatment noncompliance. Two estimation methods for causal mediation in the presence of noncompliance have recently been proposed, the instrumental variable method (IV-mediate) and maximum likelihood method (ML-mediate). However, little research has examined their performance when certain assumptions are violated and under varying data conditions. This article addresses that gap in the research and compares the performance of the two methods. The results show that the distributional assumption of the compliance behavior plays an important role in estimation. That is, regardless of the estimation method or whether the other assumptions hold, results are biased if the distributional assumption is not met. We also found that the IV-mediate method is more sensitive to exclusion restriction violations, while the ML-mediate method is more sensitive to monotonicity violations. Moreover, estimates depend in part on compliance rate, sample size, and the availability and impact of control covariates. These findings are used to provide guidance on estimator selection.
1. Introduction
Randomized experiments are commonly conducted to establish the causal effects of a treatment. In addition to identifying the main effect of the treatment, testing mediation mechanisms is often of great interest because they can provide a more complete explanation for how the treatment impacts the outcome. However, treatment noncompliance—when some participants do not adhere to the assigned treatment—often complicates the estimation of treatment main effects and mediation effects (Frangakis & Rubin, 2002; Keele et al., 2015; Yau & Little, 2001). Furthermore, both violations of structural assumptions that are necessary to causally identify the estimand and violations of the distributional assumptions of the model can impact estimates. In this study, we focus on the estimation of mediation effects in the context of randomized experiments when some participants do not comply with the treatment assignment. Two estimation methods have been proposed recently, but very little research has been done comparing the performance of those methods under common conditions. Hence, there is little guidance for practitioners on the optimal approach given the specifics of their study. We use simulated and real data to compare the performances of two common methods for estimating causal mediation under a range of common data conditions and model specifications. In particular, we investigate their relative performance in the presence of violations of structural and distributional assumptions and whether the role of distributional assumptions is heightened when a structural assumption required to causally identify the mediation effects is violated.
In the context of a randomized experiment, the main effects of an intervention can be estimated with or without regard to participant compliance with the initial treatment assignment. This minimizes biases in treatment effect estimates due to nonrandom attrition from treatment and control groups and crossover. The mediation effects of an intervention can also be estimated, which we refer to as the mediated portion of the intention-to-treat (ITT) effects, by estimating compliers average mediation effects (for details, see Yamamoto, 2014; Keele et al., 2015; Park & Kürüm, 2018). This represents a portion of ITT effect that goes through the change of mediator values. An ITT analysis provides an estimate of the average effect of the intervention for people who initially enroll to participate. However, it does not provide an estimate of the effect of the intervention for participants who actually receive it if there are participants who did not comply. Compared with the ITT effects, the average effect of the treatment assignment among compliers is an estimate of the effect of the intervention for those who receive it. This is of greater relevance to individuals deliberating on whether to undergo the treatment or to researchers who want to learn the efficacy of an intervention. In this article, we focus on estimating mediation effects for individuals who comply with the treatment rather than the mediated portion of the ITT effect.
Estimating the mediation effect among compliers is challenging for two reasons: (1) Compliance behavior is not fully observed, and (2) a mediator is not usually randomized even in a randomized experiment. Therefore, the estimation has to rely on untestable structural assumptions that are necessary to causally identify the estimand of interest. There are several methods for estimating the average treatment effect among compliers including instrumental variables-based (IV; Bloom, 1984), maximum likelihood (ML; Imbens & Rubin, 1997; Yau & Little, 2001), Bayesian (Imbens & Rubin, 1997), and propensity score methods (Ding & Lu, 2017; Jo & Stuart, 2009), which could potentially be applied to a mediation setting. Among these, the IV-based and ML methods were recently proposed, and the purpose of this article is to compare their performance for estimating the mediation effect among compliers. The IV-based method proposed by Yamamoto (2014) does not require any distributional assumption and has the advantage of flexibility to accommodate different distributions. In contrast, the ML method proposed by Park and Kurum (2020) requires an additional parametric distributional assumption with respect to the compliance, mediator, and outcome. The ML method is a result of extending the complier average causal effects (CACE) estimation method (see, e.g., Imbens & Rubin, 1997; Little & Yau, 1998; Yau & Little, 2001). In this article, we call the former an “IV-mediate” method and the latter an “ML-mediate” method.
In addition to the simulation study, we compare estimates generated from the two methods using actual experimental data from the Job Opportunities and Basic Skills II (JOBS II) project. JOBS II was designed to promote quality reemployment and prevent deterioration of mental health for unemployed workers (Price et al., 1992; Vinokur & Price, 2006). We test the effect of the intervention on depression and the hypothesis that sense of mastery mediates that effect. An identical mediator was used in Jo et al. (2011), and a similar mediator was used in Imai et al. (2010).
This study is limited to comparing the performances of the IV-mediate and ML-mediate methods. Comparability with CACE estimation methods is not the focus of this article because that was addressed in the previous research. For example, the performance of CACE and IV methods was compared by Yau (1997) and Yau and Little (2001). In addition, Angrist et al. (1996) provided a bias formula for CACE due to the violation of exclusion restriction (ER) and monotonicity that applies to both methods.
The outline of the article is as follows. Section 2 provides an overview of causal mediation concepts, terminology, and modeling assumptions related to treatment compliance. Section 3 reviews the research and theory related to the two methods for estimating mediation. Section 4 presents the findings of the simulation study, and Section 5 is the application using JOBS II data. Finally, Section 6 discusses the implications of the study for best practices and future research. In the Appendix, we provide the codes used for our case study.
2. Effects of Interest
To define the mediation effect among compliers precisely, consider a setting in which a treatment is randomized such that subjects are assigned to either the treatment (
In this setting, there are four compliance types, which are denoted as
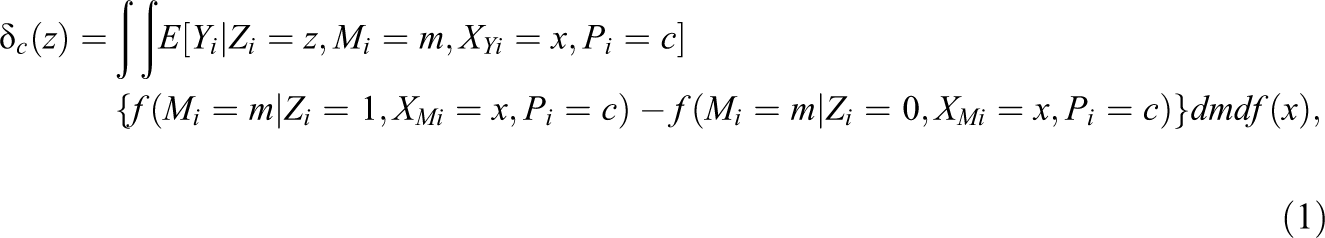
We define the average mediation effect among compliers using the notation above as

where
Consider the case where the compliance status of each individual is fully known although this is not generally true. The CACME is causally identified under the following two assumptions:
Treatment ignorability, also known as unconfounded treatment assignment, is a key tenet of the Rubin Causal Model (RCM; Rosenbaum & Rubin, 1983). Treatment ignorability means that the probability of being assigned to the treatment or control group can be assumed to be effectively random when conditioned on observable variables. The concept was extended to sequential ignorablity within the causal mediation framework, which assumes the ignorability of the mediator (Imai et al., 2010; VanderWeele, 2015). This is a critical aspect of causal mediation because even within a randomized experiment, the mediator is seldom randomized, and therefore ignorability of the mediator depends on conditioning on observed covariates and the treatment status. LSI is an extension of sequential ignorability that requires the ignorabilty of the mediator only for compliers instead of the entire population. Under these two assumptions (randomization and LSI) and given the known compliance status, the CACME is uniquely identified as
where
Unfortunately, however, the compliance status for each individual is unknown. Therefore, we need to invoke additional structural assumptions to uniquely identify the CACME, including the assumptions of monotonicity and ER:
Monotonicity enables the identification of some unknown compliance types such as always-takers for those who are assigned to the control condition and never-takers for those who are assigned to the treatment condition. After excluding the possibility of defiers, those who are assigned to the treatment condition but did not take the treatment (i.e.,
Even if the other structural assumptions hold, when monotonicity is violated, the CACME estimate is biased. For notational simplicity, assume that we are already within a stratum of covariates (i.e.,

where
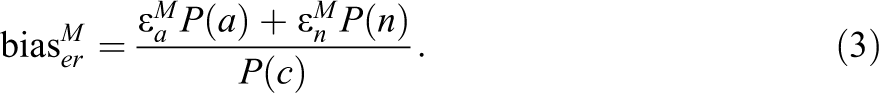
Second, the bias for the difference in conditional probability of

where
By combining these two sources of biases, the bias for

The first line indicates the bias due to the violation of monotonicity with respect to the conditional expectation of Y, the second line indicates the bias with respect to the difference in probability of
However, even under monotonicity, the compliance status is unknown for those who are assigned and took the treatment (i.e.,
Given other structural assumptions, but if ER does not hold, the CACME estimate will be biased. To calculate the bias for

where
Likewise, the bias in the difference in conditional probability of
This implies that the bias is larger (1) if the direct impact of the assigned treatment on the mediator among never-takers and always-takers (
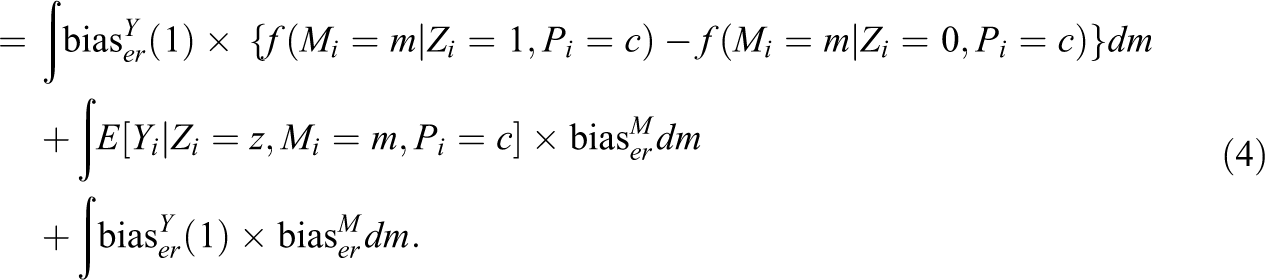
The first line indicates the bias due to the direct impact of the assigned treatment on the outcome, the second line indicates the bias due to the direct impact of the assigned treatment on the mediator, and the third line indicates the bias due to impact on both the mediator and outcome. The proof appears in Appendix B in the online version of the article. For a detailed procedure for identifying the CACME based on these assumptions, refer to Yamamoto (2014), and for its extension to multiple mediators, refer to Park and Kürüm (2018).
3. Estimation Methods Considered
3.1. IV-Mediate Method
Under Assumptions 1 through 4, the CACME can be consistently estimated using the IV-mediate method proposed by Yamamoto (2014), which is implemented in R mediation package (Tingley et al., 2014). The IV-mediate method is a result of extending the IV approach based on the RCM to a mediation setting.
The first step is to fit a regression model for the outcome given the assigned treatment (Z), received treatment (T), mediator (M), and covariates (X). From this regression, we can obtain conditional expectations of the outcome, given the values of
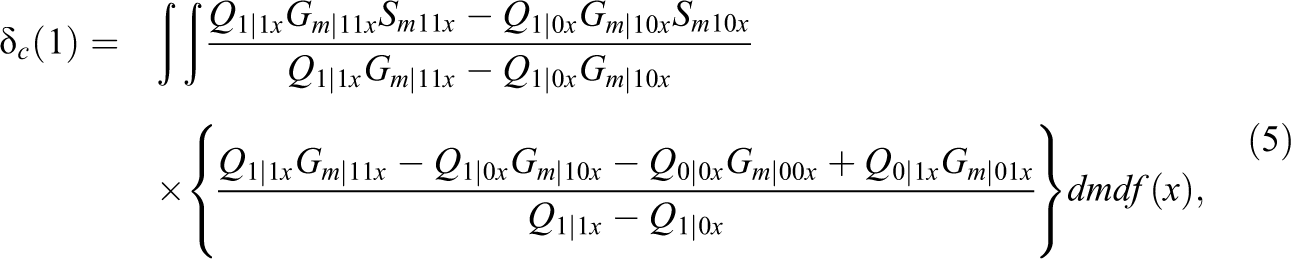
where
The standard errors are obtained using either nonparametric bootstrap or quasi-Bayesian approaches. Bootstrapping is a Monte Carlo resampling method for approximating the sampling distribution (i.e., standard errors). Nonparametric bootstrapping (Efron, 1992) has the advantage of not assuming a sampling distribution (e.g., normal). The quasi-Bayesian approach obtains standard errors by drawing model parameters from the large-sample, diffuse-prior approximation of the sampling distribution, which was originally proposed for broader applications by Tomz et al. (2001). Both options are available in the R mediation package.
As demonstrated in Yamamoto (2014), the estimator shown in Equation 5 will converge to its true value when there is a moderate-to-large sample size (1,000 or more) with a moderate-to-high compliance rate (50% or higher) when no covariate information is available. Our basic simulation setting crosses sample size to 200, 1,000, and 2,000, and compliance rate to 30%, 50%, and 80%, in line with the previous studies.
One advantage of using the IV-mediate method is that it is purely nonparametric. Therefore, the estimation procedure does not require any parametric assumption (such as binomial or multinomial distribution) regarding the compliance status because it does not attempt to impute missing compliance status as the ML-mediate method does. Instead, the method adjusts the mediation effect by considering the compliance rate. In addition, no distributional assumptions are required for the mediator and outcome. Although the specification of parametric models is not necessary, we employed them for the treatment, mediator, and outcome (i.e., a regression-based estimator) in order to maintain the comparability with the ML-mediate method. When parametric models are used, a correct functional form assumption for all specified models would apply. This method is flexible for accommodating parametric and nonparametric models for the mediator and outcome, and the models can be easily extended to accommodate other estimation methods such as quantile or Bayesian regressions.
3.2. ML-Mediate Method
Another method for estimating the CACME is the ML estimation approach, which was proposed by Little and Yau (1998) in the context of the CACE estimation. This approach considers an unobserved compliance status as missing data via expectation–maximization (EM) algorithm (Dempster et al., 1977; Little & Rubin, 1989). The E step computes the expected values of sufficient statistics given the data and current estimates and the M step maximizes the complete-data likelihood given the expected values of sufficient statistics from the E step (Stuart & Jo, 2015). This procedure is repeated until the likelihood is stabilized. Extending this ML-EM approach to accommodate a mediator is straightforward as it involves simply adding a mediator model to the complete-data likelihood calculation (see Appendix C in the online version of the article for the likelihood used for estimation). The ML-mediate method addresses unobserved compliance behavior by modeling compliance given the covariates and maximizing the likelihood shown in Online Appendix C.
Using the EM algorithm, we can obtain the probability of compliers. The compliance model predicts missing compliance status under the treatment and control conditions, based on the relationship between the observed compliance status and covariates. A multinomial logistic regression is fitted to obtain the probability of
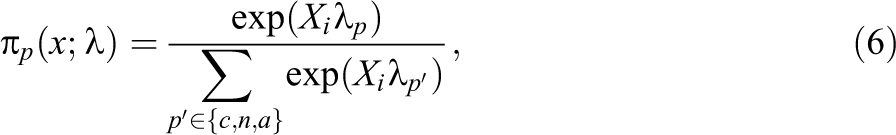
where
Again, using the EM algorithm, we can obtain parameters for the mediator and outcome models. The full mediator and outcome models can be expressed as the mixture of three different distributions, which are compliers, never-takers, and always-takers. In Equation 7, we use three dummy variables that represent three different compliance types (i.e., Ic, In, and Ia). For example,

where
In the next step, we estimate the CACME based on the mediator and outcome models using the parameter estimates obtained from the first step. The CACME estimate is obtained by applying mediator and outcome models to Equation 1. As a result, the CACME is estimated as
One advantage of this ML-mediate method is that the ER and monotonicity assumptions are not essential for identifying the CACME (Imbens & Rubin, 1997). However, if the ER and monotonicity assumptions are satisfied, there is a simple relationship between the CACME and the mediated portion of the ITT effect
In the simulation study, we employed a multinomial distribution for the compliance model and a bivariate normal distribution for the mediator and outcome, which are shown in Equations 6 and 7, respectively. While the impact of the distributional assumption for compliance is examined, the distributional assumption for the mediator and outcome is not. This is because previous research has shown that the CACE estimator is consistent even when the normal distributional assumption is violated if other structural assumptions (ER and monotonicity) hold (Stuart & Jo, 2015). However, if the identification only relies on normality, estimates are sensitive to the inclusion/exclusion of predictors used to model compliance (Copas & Li, 1997; Zhang et al., 2009) or other structural assumptions (Stuart & Jo, 2015). The same pattern was shown for the CACME estimator (Park & Kurum, 2020).
4. Monte Carlo Simulation Study
In this section, we conducted a Monte Carlo simulation study that compared the performance of two mediation effect estimation methods under a variety of realistic data conditions (the existence of covariate information, varying sample sizes, and compliance rates) and violations of structural or functional assumptions (distributional assumption of a compliance status, additional covariates, ER, monotonicity, and LSI).
4.1. Simulation Design
The simulation results are based on 1,000 replications. To be consistent with previous studies (Park & Kürüm, 2018; Yamamoto, 2014), we used the following design conditions: (1) different sample sizes (200, 1,000, and 2,000) and (2) varying compliance rates (30%, 50%, and 80%). These conditions cover small, medium, and large sample sizes as well as low, medium, and high compliance rates. We also compared the performance between two estimation methods under four other conditions: (1) when all structural assumptions are met, (2) when the ER is violated, (3) when the monotonicity is violated, and (4) when the LSI is violated.
We consider a setting in which the treatment variable (Z) is randomly assigned to Z = 0 or to Z = 1. Three compliance populations are generated: compliers, never-takers, and always-takers. We exclude defiers by making the monotonicity assumption. The treatment received (T) is determined according to the assigned treatment and the compliance status for each individual. The mediator (M) and outcome (Y) are generated based on Equation 7. Throughout the simulations, we set the true values of the CACME for those who are treated and not treated to Under all structural assumptions. We generated data in two different ways: (1) the compliance status is completely random and (2) the compliance status follows a multinomial distribution without any covariates, which we refer to as the parametric compliance status model. For a random compliance status model, we generated a compliance population at random according to the compliance rate ( Violation of ER. To create a setting that violates the ER, we specified an effect size for never-takers and always-takers that is half the size of the compliers effect. For example, we set the effect of the assigned treatment on the mediator and outcome at 1.0 for compliers and 0.5 for never-takers. We set the effect for never-takers and always-takers to half the size of the compliers effect because it is unlikely that the effects for never-takers and always-takers are as large as the compliers effect. The effect of never-takers or always-takers is mainly psychological due to the treatment assignment (Stuart & Jo, 2015). Other than this, the data generating mechanism is identical to the first condition (under all structural assumptions). In the analytical model, we specified the effect of never-takers and always-takers to zero to represent the case in which researchers make the ER without knowing that this assumption is violated. Violation of monotonicity (in the true model). In the random compliance status model, we randomly selected 5% of the population as defiers. In the parametric compliance status model, we first generated a standard normal predictor (X) for the compliance model. Then, we set the intercepts and coefficients for compliers, always-takers, never-takers, and defiers as Violation of LSI. For random and parametric compliance status models, we generated a standard normal predictor (X) for the mediator and outcome. The effects of the predictor on both the mediator and the outcome were set to 1 for each compliance group. We omitted this predictor in the analytical model to mimic the case in which researchers have an unmeasured covariate in the outcome model.
Data for the random and parametric compliance models were generated using R and Mplus, respectively. For each simulated data set, we estimated the CACME using the IV-mediate and ML-mediate methods under the assumptions described in Section 2, except the assumptions that are specified to be violated in each condition as described above. The bias, root-mean-squared error (RMSE), and coverage rate (the nominal level of 95%) were obtained from each simulation iteration. The bias was calculated as the difference between the average of the CACME estimates based on 1,000 iterations and the true value. The RMSE is the average difference between the estimate obtained from each iteration and the true value. The coverage rate is the proportion of 95% confidence intervals obtained from each iteration which cover the true value of interest.
4.2. Simulation Results
Figures 1
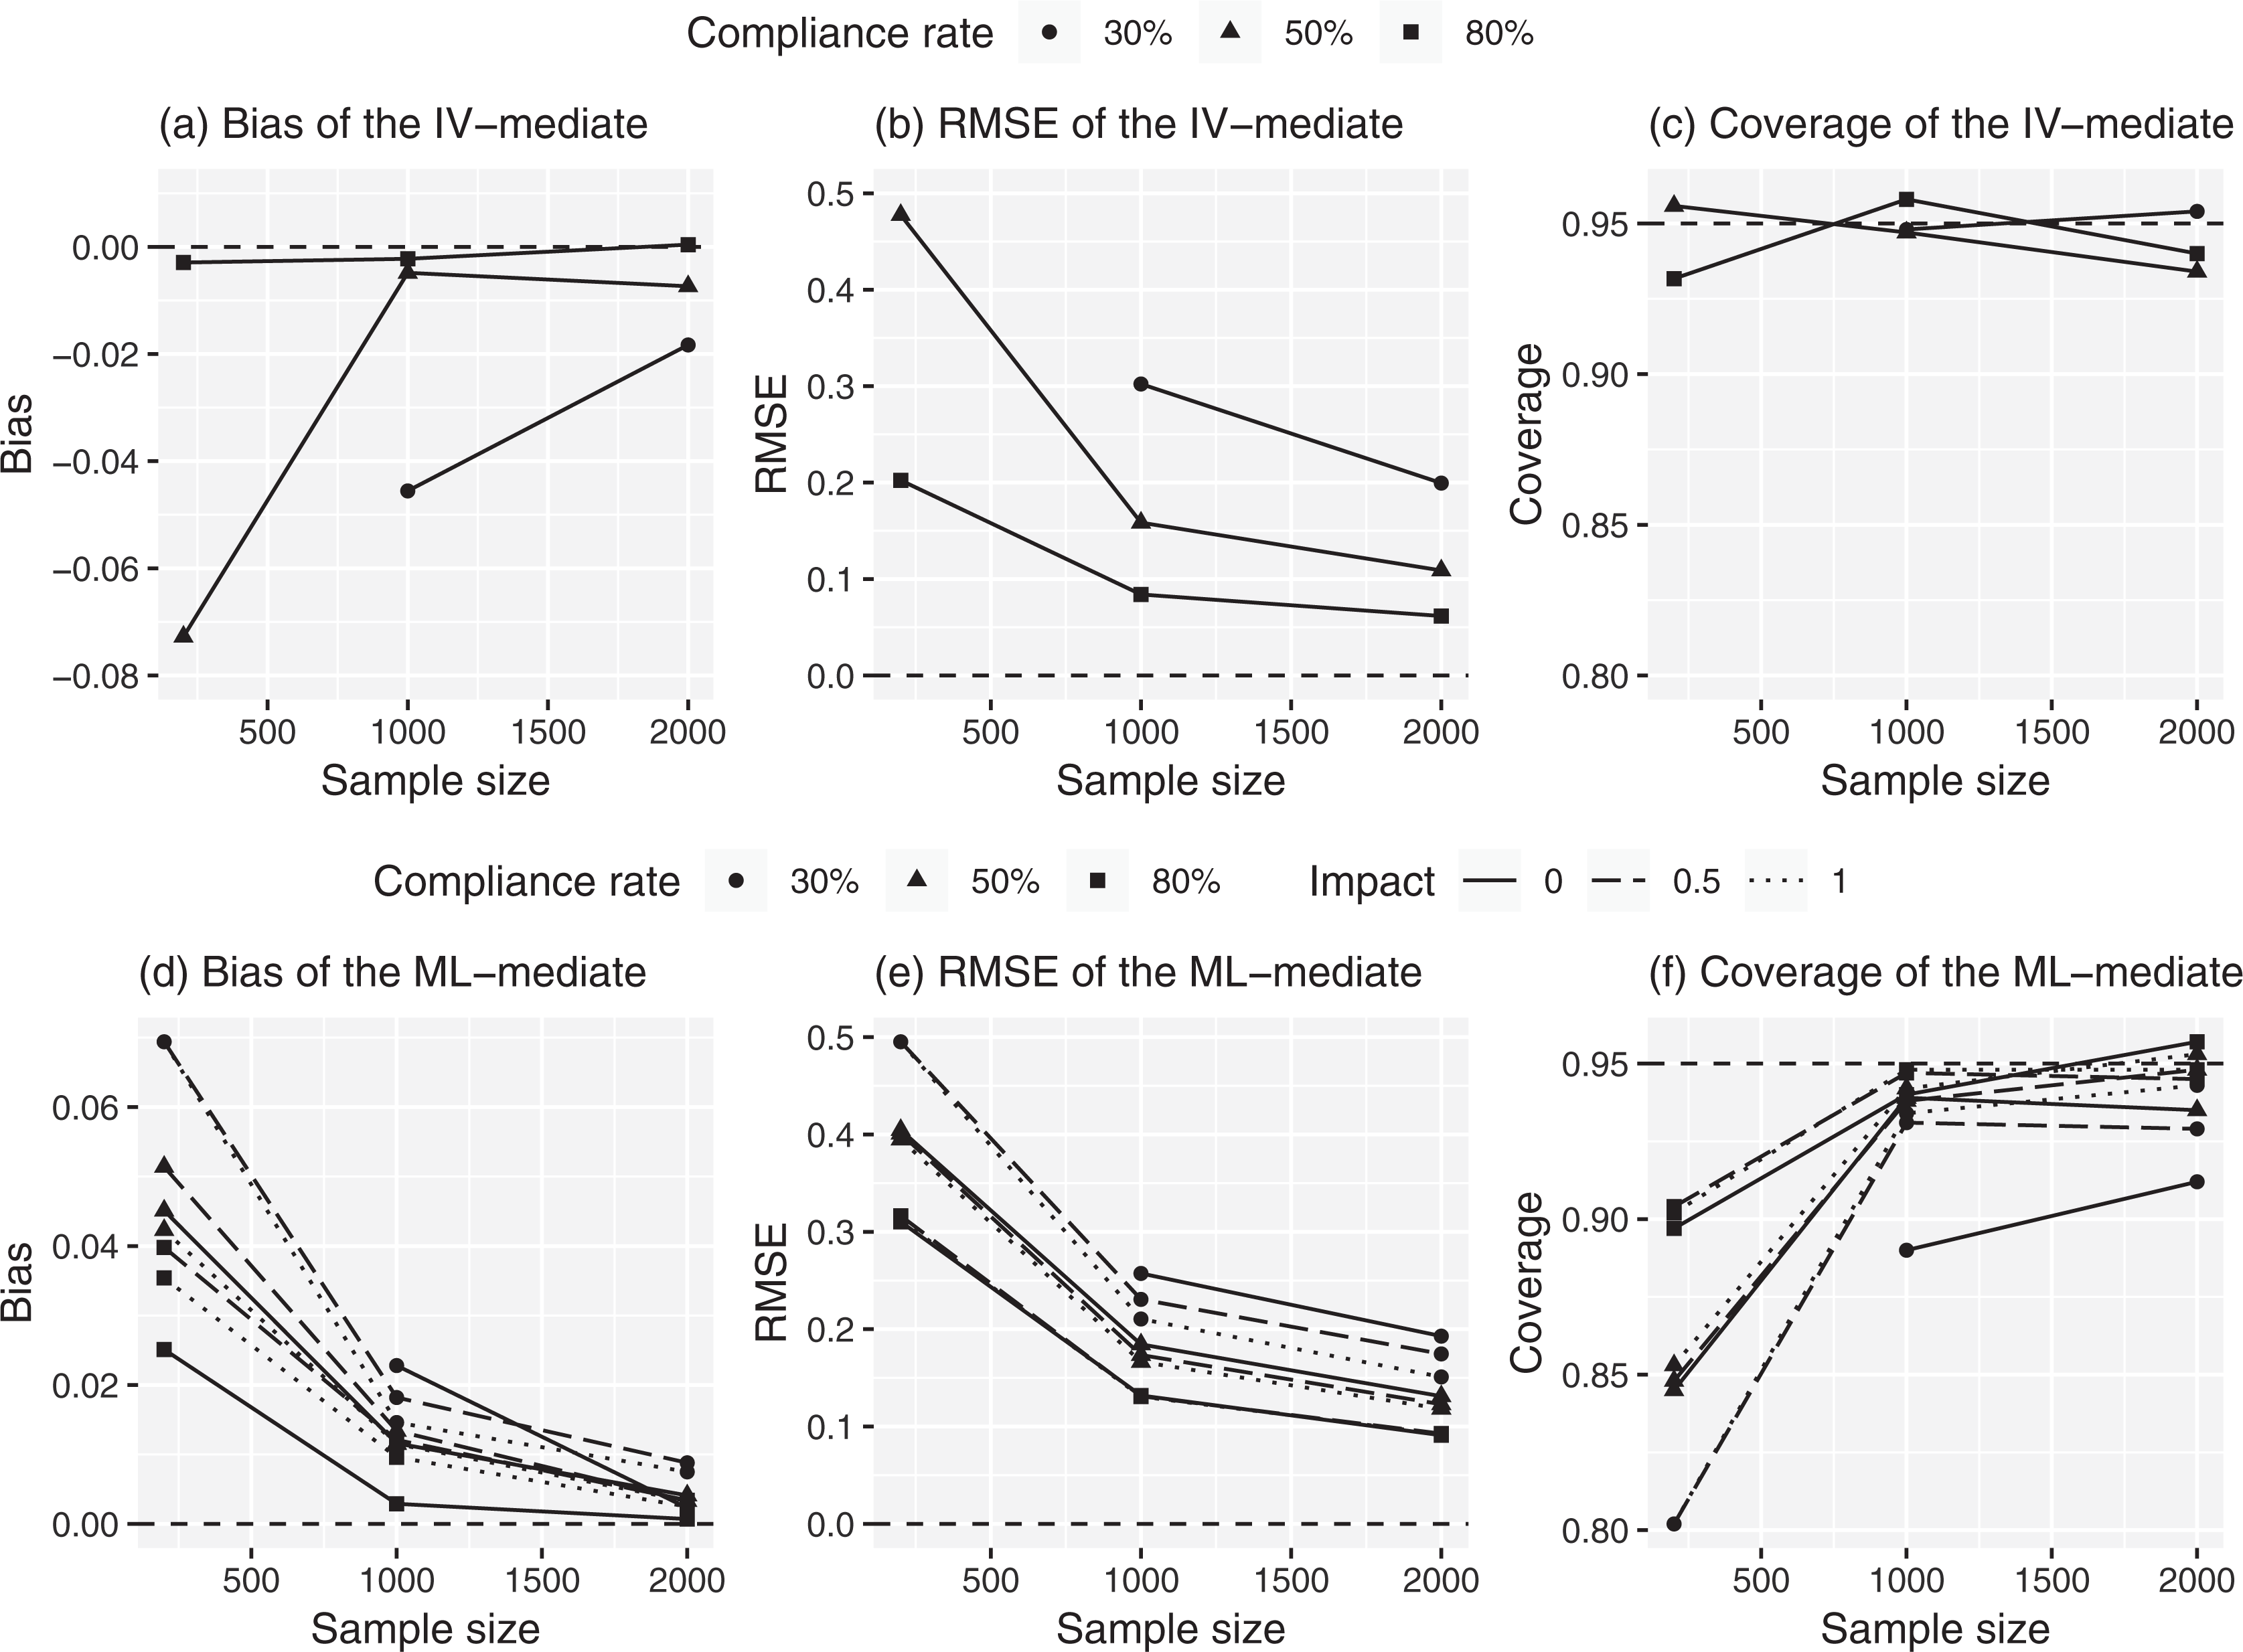
through 5 summarize the simulation results for each condition when one or two assumptions are violated. The upper half of the figures illustrates the bias, RMSE, and coverage rate for the IV-mediate method, and the bottom half illustrates the same quantities for the ML-mediate method. Shapes affixed to lines are used to represent the three compliance rates, whereas a circle corresponds to 30%, a triangle to 50%, and a square to 80% compliance. Line types are used to represent covariate effect sizes with a solid line corresponding to an effect of 0, a dashed line to an effect of 0.5, and a dotted line to an effect of 1.0. In the figures, we only present the case with
Complier average causal mediation effect estimation when the compliance distributional form is correct (true effect: −.462). Note. (1) Impact: impact of compliance predictors, (2) all structural assumptions and normality are met without covariates, (3) the compliance distributions used for the instrumental variable (IV-mediate) and maximum likelihood methods are random and multinomial, respectively, and (4) for the IV-mediate method, the case with the sample size of 200 and compliance rate of 30% is not available.

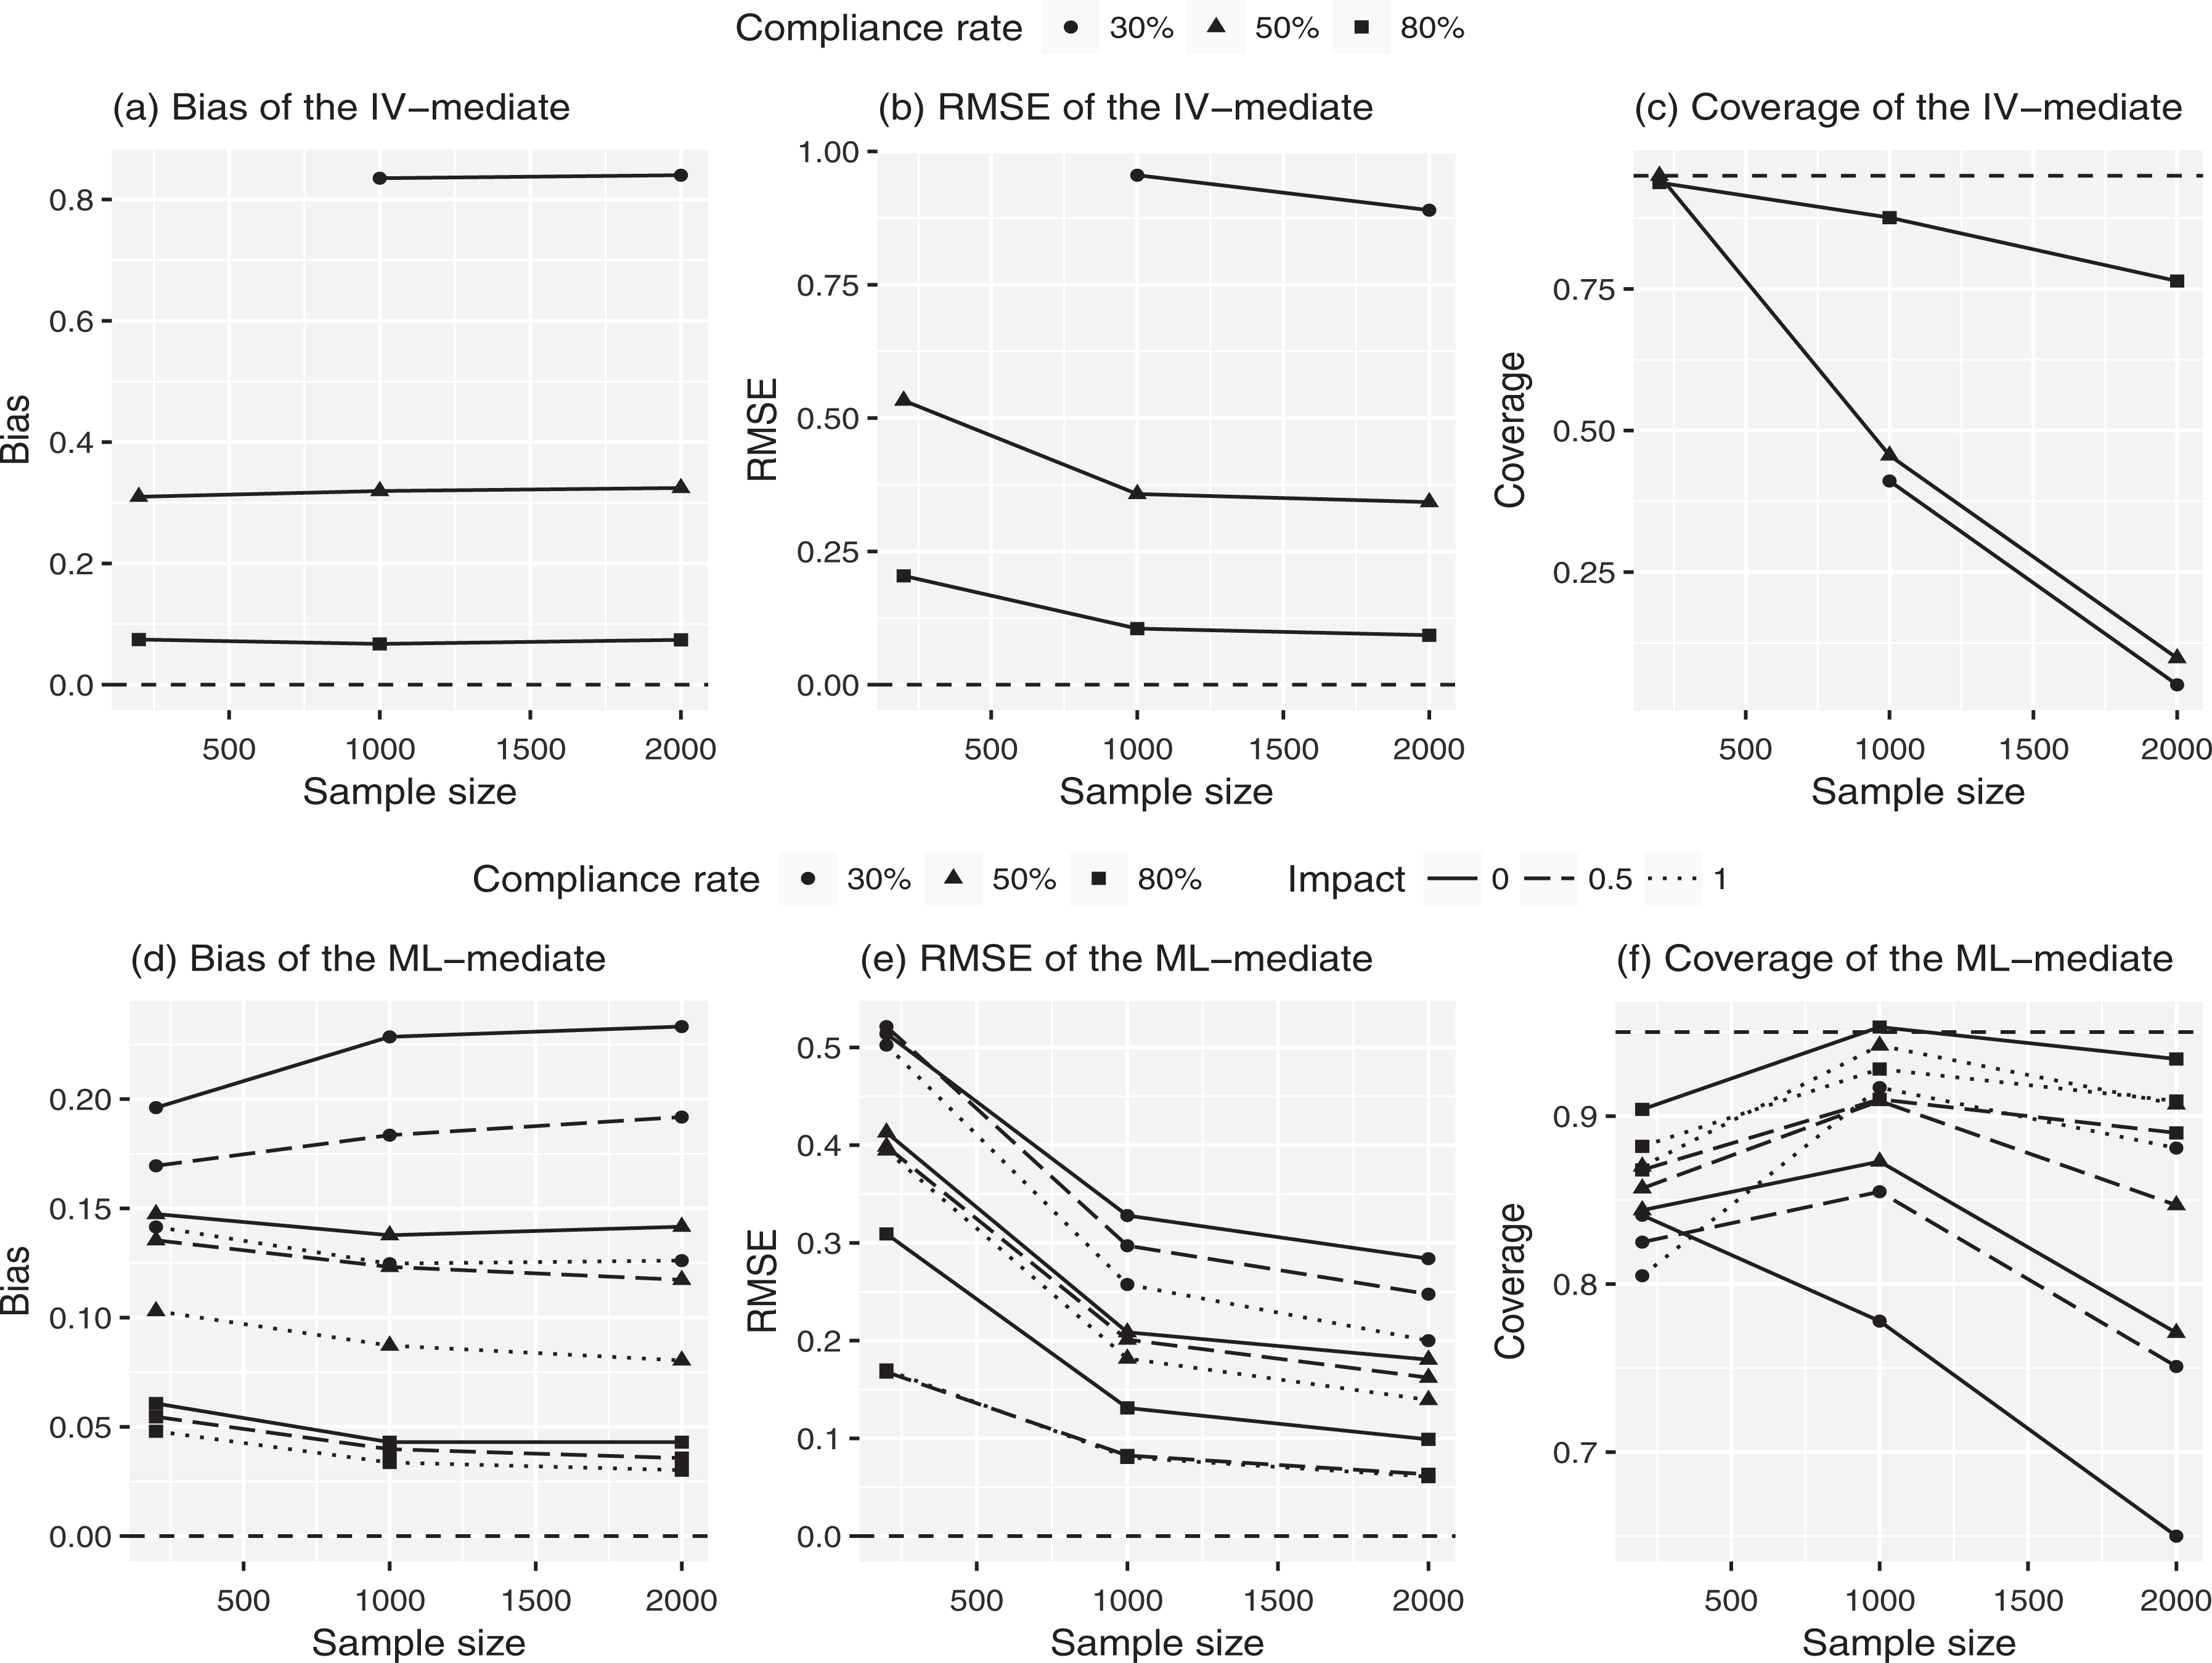
Complier average causal mediation effect estimation when the compliance distributional form is wrong (true effect: −.462). Note. (1) Impact: impact of compliance predictors, (2) all structural assumptions and normality are met without covariates, and (3) the compliance distributions used for the instrumental variable and maximum likelihood methods are multinomial and random, respectively.
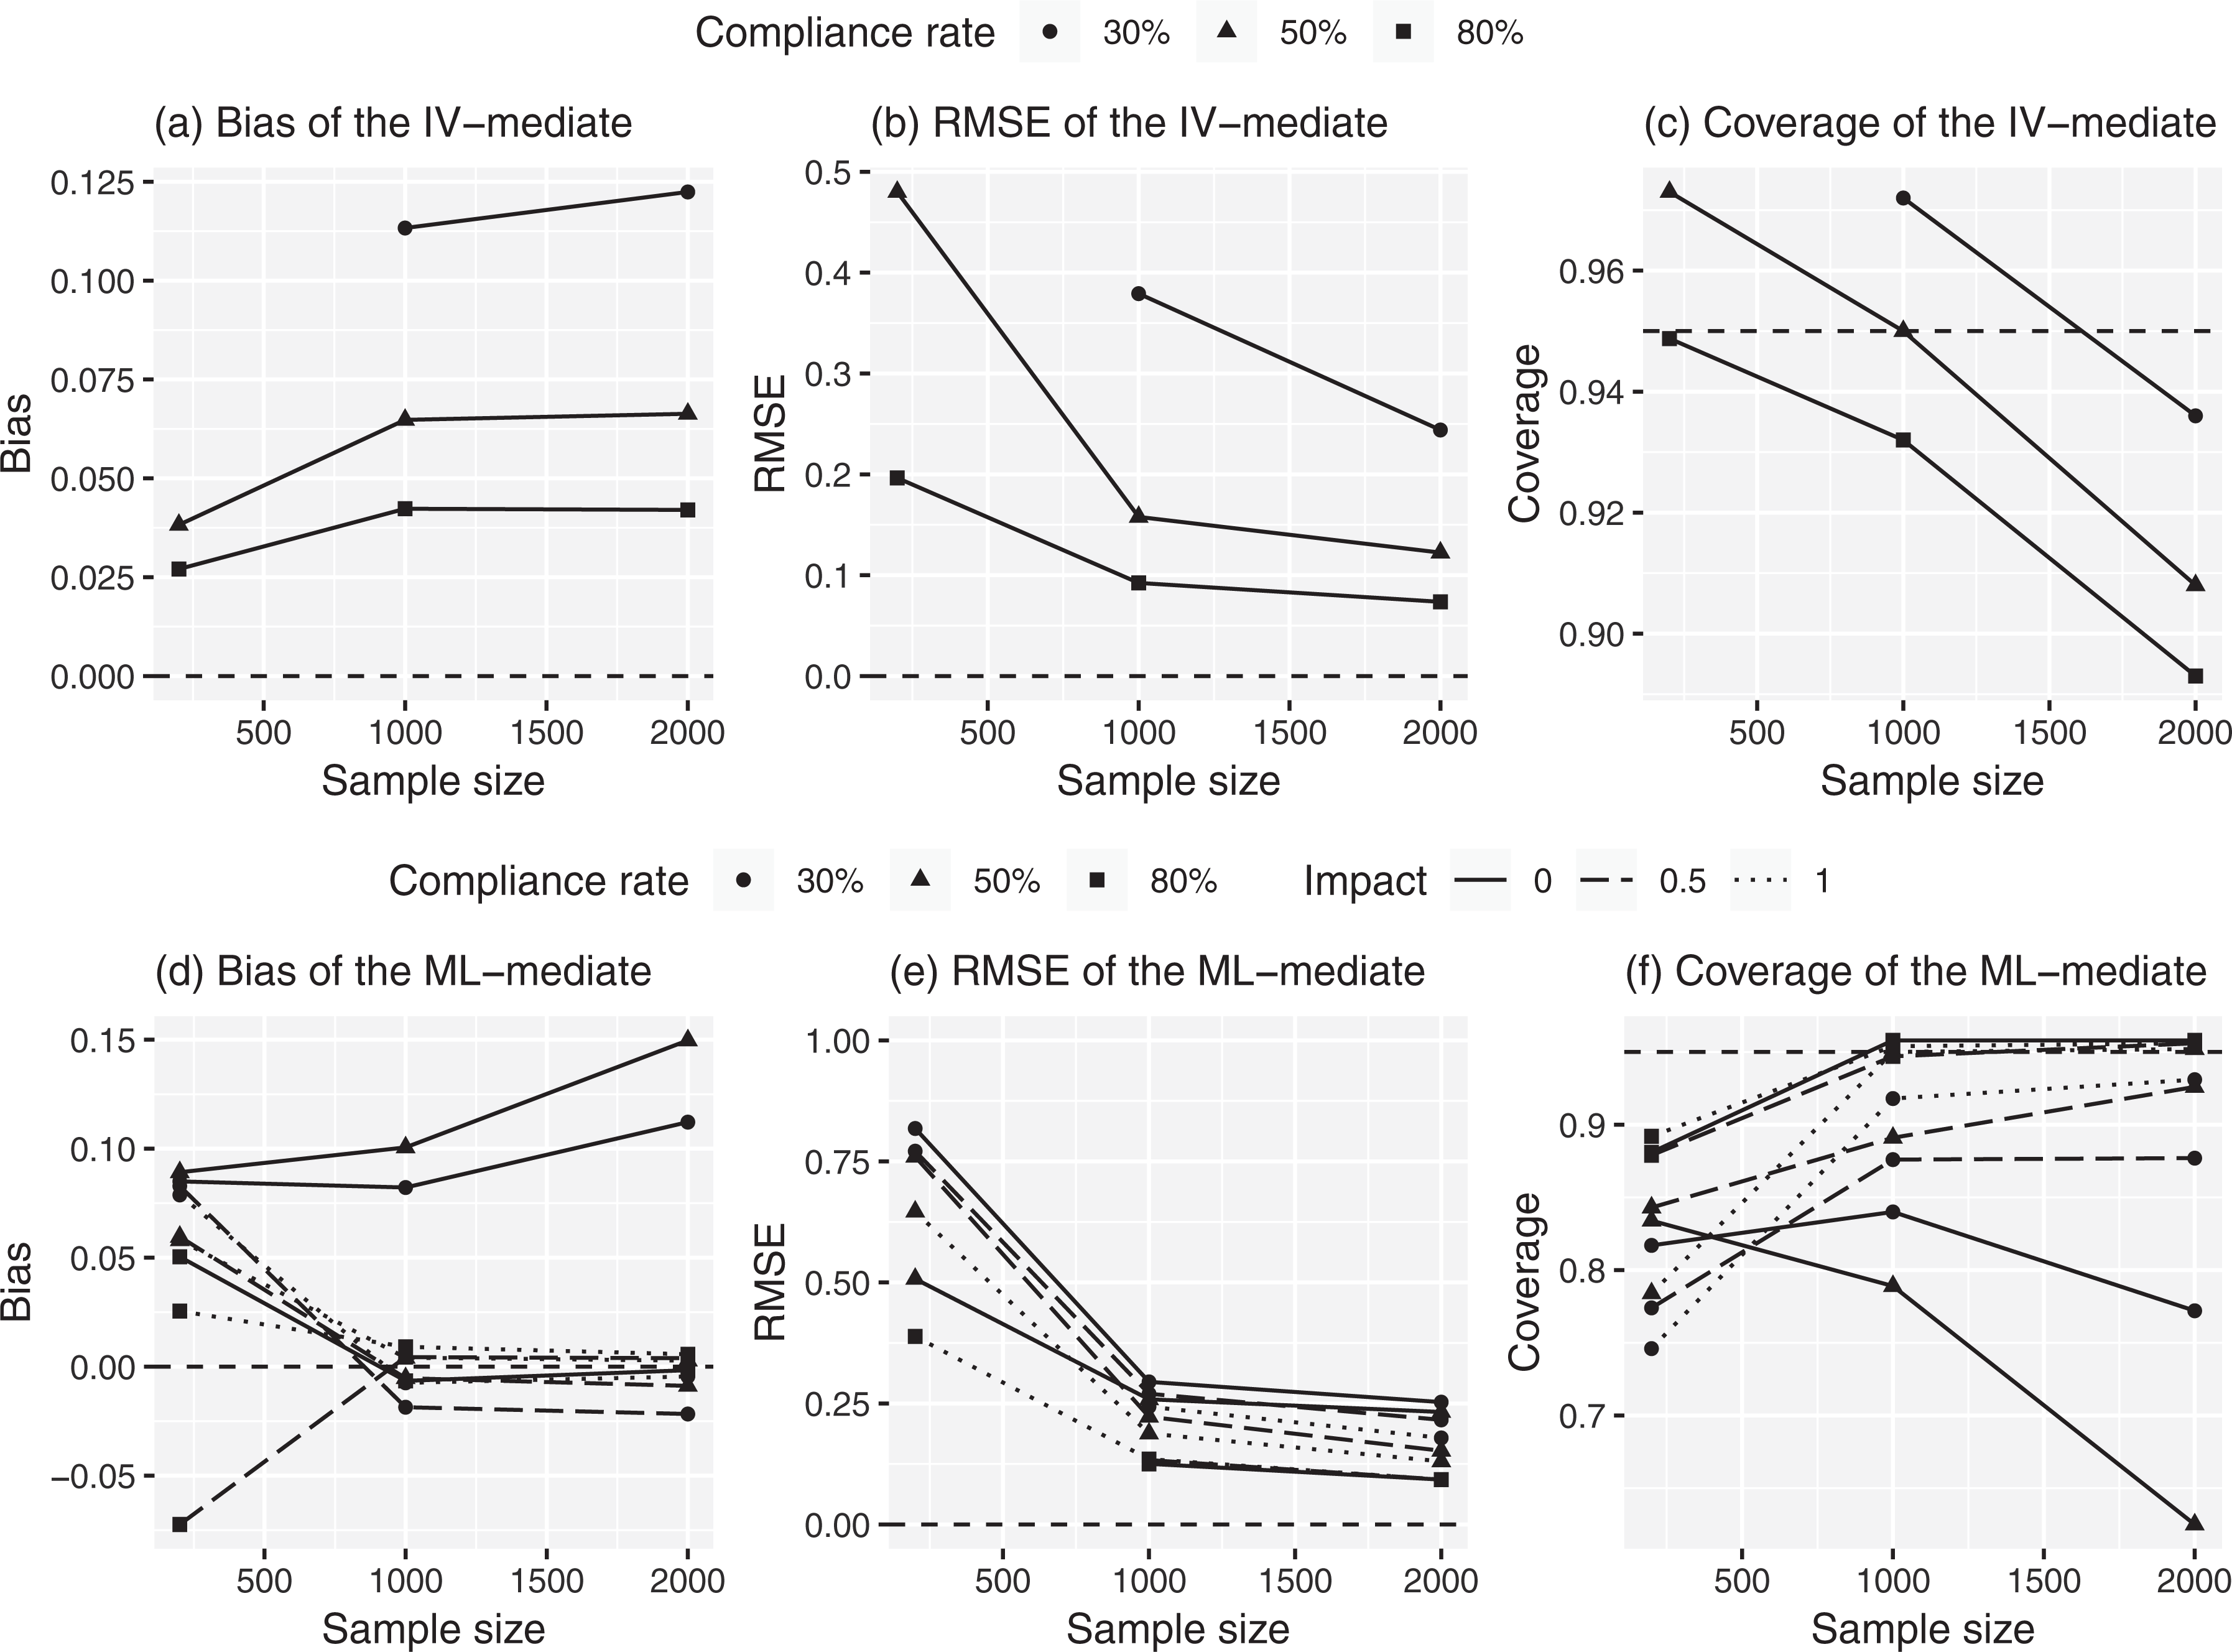
Complier average causal mediation effect estimation when the exclusion restriction is violated (true effect: −.462). Note. (1) Impact: impact of compliance predictors, (2) all distributional assumptions, monotonicity, and local sequential ignorability are met, and (3) for the instrumental variable method, the case with the sample size of 200 and compliance rate of 30% is not available.
Complier average causal mediation effect estimation when the monotonicity is violated (true effect: −.462). Note. (1) Impact: impact of compliance predictors, (2) all distributional assumptions, exclusion restriction, and local sequential ignorability are met, and (3) for the instrumental variable method, the case with the sample size of 200 and compliance rate of 30% is not available.

Complier average causal mediation effect estimation when the local sequential ignorability is violated (true effect: −.462). Note. (1) Impact: impact of compliance predictors, (2) all distributional assumptions, monotonicity, and exclusion restriction are met, and (3) for the instrumental variable method, the case with the sample size of 200 and compliance rate of 30% is not available.
Under all structural assumptions. Not surprisingly, both estimation methods perform well when both structural and distributional assumptions are met even with no covariate information available. Figure 1 shows that the bias obtained from both methods is close to zero and the coverage rate reaches to near 95% as the compliance rate and sample size max out. The IV-mediate method has a minor advantage for the 80% compliance rate in terms of bias and variance, while the ML-mediate method has a minor advantage for the 30% compliance rate. That is, for 80% compliance rate, the RMSE for the IV-mediate method is smaller than the ML-mediate method for sample sizes of 200 (0.20 vs. 0.31), 1,000 (0.09 vs. 0.14), and 2,000 (0.06 vs. 0.09). For the 30% compliance rate, the RMSE for the ML-mediate method is smaller for sample sizes of 200 (0.50 vs. infinity) and 1,000 ( 0.25 vs. 0.30). The IV-mediate method shows better coverage in general, but this is driven by large standard errors when the sample size is small and the compliance rate is low.
When all assumptions are met, the predictors of compliance have a limited impact on the ML-mediate estimates. For example, there is almost no difference in the RMSE for the 80% and 50% compliance rates for the models with and without covariates. One exception is the 30% compliance rate with the sample size of 200. For this condition, the RMSE was reduced from 0.6 to 0.5 when a moderate-to-strong predictor of compliance was added.
In contrast, but as expected, the performance of each method decline as the distributional assumption of the compliance model is violated even when all the structural assumptions are met. Figure 2 illustrates that the results are very sensitive to how the compliance status is determined. The ML-mediate method is biased when the compliance status is determined at random, while the IV-mediate method is biased when the compliance status is determined based on a multinomial distribution. As described above, the ML-mediate method assumes that the compliance status should follow a known parametric family, and the consequence of violating this assumption is not trivial. When the sample size is set at 2,000 and the compliance rate at 80%, the bias is approximately −0.17, which is more than one third of the true effect size. The consequence of not accounting for the compliance model distribution (and treating the compliance status as at random) is similarly severe; the bias is close to −0.20 in the same condition. It is also noteworthy that the variance of the IV-mediate method becomes much larger than the ML-mediate method as the sample size and the compliance rate decrease. This finding highlights the importance of assessing the goodness of fit of the compliance model as misspecification of its distribution biases results. In the literature on compliance modeling, the distributional assumption of compliance has not been explicitly discussed. It has been implicit in literature perhaps because structural assumptions are emphasized for a causal interpretation of results. Although assessing goodness of fit has not been practiced in compliance modeling, it is a popular approach to test a distributional assumption in general.
Violation of ER. If distributional assumptions hold in Equation 7, the ML-mediate method performs better than the IV-mediate method when the ER is violated, even when there are no predictors of compliance. When a covariate is added that predicts compliance status, the performance advantage of CACME increases for the ML-mediate method (Figure 3). For example, the biases are 0.31 and 0.13 for the IV-mediate and ML-mediate methods when the compliance rate is 50%, and there is no covariate information. The addition of a high-impact covariate reduced the ML-mediate method bias to 0.08. The advantage of incorporating a covariate that has a large impact is even greater when the compliance rate is 30%. This smaller bias for the ML-mediate method is because the bias due to the violation of the ER is partly decreased by enforcing the distributional assumptions and/or adding more covariates. In contrast, the IV-mediate method does not have other sources of information to improve its estimates when the ER is violated.
Figure 3 also shows that increases in compliance rates result in rather remarkable reductions in bias due to the violation of ER. This is true for both methods, and increasing the sample size does not result in additional reductions. This finding is consistent with the bias formula shown in Equations 3 and 4 that the bias due to violating ER is proportional to the ratio of noncompliers to compliers.
These results demonstrate that the impact of violating the ER can be reduced by (1) increasing the compliance rate and/or (2) using the ML-mediate method while incorporating a covariate that strongly predicts compliance status. While increasing the compliance rate is hard to manage especially for a large-scale intervention, collecting covariates that may predict the compliance status is feasible in many cases. However, it is important to remember that the advantage of the ML-mediate method in terms of reducing the bias due to the ER comes with a price: The ML-mediate method has additional distributional assumptions for the compliance, mediator, and outcome. Violation of monotonicity (in the true model). Figure 4 demonstrates that the bias between the two methods is comparable with no predictors of compliance. For the ML-mediate method, estimates recover from the bias after incorporating medium- or high-impact covariates in the compliance model. For example, the bias for the ML-mediate method is reduced from 0.10 (with no covariate) to −0.01 (with a high-impact covariate) with 50% compliance rate and with a sample size of 1,000.
However, the ML-mediate method is more sensitive to the violation of monotonicity than the IV-mediate method in terms of precision. That is, the RMSE obtained from the ML-mediate method tends to be larger than the IV-mediate method. For example, the RMSEs are, respectively, 0.15 and 0.25 for the IV-mediate and ML-mediate methods with 50% compliance rate and with a sample size of 1,000 when no covariates are included in the compliance model. Even after incorporating predictors of compliance, the RMSE for the ML-mediate method is larger than the IV-mediate method. For example, the RMSE obtained from the ML-mediate method is 0.19 after incorporating the high-impact predictor of compliance, which is still larger than the IV-mediate method (0.15). This is especially true for the small sample size condition where an extremely large variance is observed after incorporating a covariate.
In short, the two methods provide a comparable result in terms of bias, but the IV-mediate performs better than the ML-mediate method in terms of the RMSE with or without predictors of compliance. The comparable result between the two methods in terms of bias is consistent with the bias formula shown in Equation 2. The likely reason that the same pattern is not shown in terms of RMSE is because we specified the fourth group, defiers, for the ML-mediate method (see the analytical model assumption for the violation of monotonicity condition). We suspect that the ML-mediate method loses its precision due to the complexity of adding the defiers group and the fact that covariates and distributional assumptions are used to identify this defiers group without any structural assumption. In other words, the ML-mediate method relies on other assumptions such as strong predictors of compliance or normality instead of monotonicity. In contrast, the superior performance of the IV-mediate method in terms of precision is due to its simple approach of adjusting the mediation effect by considering the compliance rate. Violation of LSI. Figure 5 illustrates that violating the LSI has a similar impact on bias and RMSE for both methods. Although the difference is minimal, the bias due to the violation of LSI tends to be smaller in the ML-mediate method than the IV-mediate method. This is because the ML-mediate method uses the parametric distributional assumptions, which hold in the scenario shown in Figure 5. When the compliance rate and sample size max out, the ML-mediate and IV-mediate estimates become highly similar at 0.13 and 0.16, respectively. Moreover, the RMSE for those estimates converges to 0.19. The equal RMSE indicates that there is no difference in the performance of the two methods when LSI is violated as all the other assumptions are met. This is because the difference between the two methods comes from how the compliance status is determined, and the performance of two methods is similar once the compliance status is determined.
5. Application to JOBS II
In this section, we compare the two estimation approaches using data from a randomized intervention study titled JOBS II (Vinokur & Price, 2006). The JOBS II study was designed to assess the effects of participation in a job-search training program on depression and reemployment. Previous research found that the intervention reduced depression and increased reemployment rates and that sense of mastery mediated the effect of the treatment on depression (Vinokur & Schul, 1997). We use these findings to inform the model used in this application.
Participants were recruited from the Michigan Employment Security Commission. The project recruitment consisted of a short screening questionnaire (T0) to determine eligibility. The eligibility requirements to participate in the study were unemployed, job seeker, lost job within the past 13 weeks, not expecting to be recalled, not planning to retire in the next 2 years, and willingness to participate in the treatment. All eligible subjects were mailed an initial questionnaire (T1). The 1,801 participants who returned the questionnaire were enrolled in the study and randomly assigned to the treatment or control group. Among those who were assigned to the treatment, 46% did not attend the job training seminars. The treatment consisted of five half-day job-search seminars, and both the treatment and control groups received an instructional booklet on job-search strategies. Participants were mailed follow-up questionnaires periodically. This analysis is based on the initial questionnaire (T0–T1) and the first and second follow-ups (T2–T3), which were collected approximately 2 and 6 months after that treatment.
Depression is the outcome for this analysis. It was measured at T3 based on responses to 11 items from the Hopkins Symptom Checklist. The mean and variance of the outcome are 1.76 and 0.44. The mediator is sense of mastery, which is the mean score of job-search efficacy (based on a 6-item questionnaire), self-esteem (based on an 8-item questionnaire), and internal control orientation (based on a 10-item questionnaire). In addition, we used a set of covariates to predict compliance status, the mediator, and the outcome in order to estimate the CACME. The covariates include demographic measures (age, gender, race/ethnicity, marital status), personal traits (depression, motivation, and assertiveness), and economic hardship, which were measured at T0 or T1.
The two methods being examined in this study were tested on a high-risk sample from JOBS II. Risk was defined based on a composite score of financial strain, assertiveness, and depression scores. Participants with a risk score greater or equal to 1.38 were assigned to the high-risk group (Little & Yau, 1998; Vinokur & Schul, 1997). This represents the highest 40% of the 1,801 JOBS II study participants in terms of risk. Compared with the simulation study, the sample size after restricting our sample to a high-risk group is considered moderate (N = 715), and the compliance rate is medium (54.3%).
5.1. Sensitivity of Results
A relevant but often overlooked issue in statistical modeling is determining which estimation method is optimal given the data conditions and model assumptions. Addressing this issue can be challenging because the validity of a model’s structural assumptions cannot be assessed directly. However, some of the distributional assumptions and strength of covariates can be assessed. In this section, we compare the results for the two estimation approaches. ER and LSI are assumed to hold for both methods. 3 We begin by assessing the effects of adding covariates. To that end, we start with a base model that does not include any covariates. The second model includes the strongest predictor of compliance available (motivation to attend), which has an effect size similar to the moderate effect in the simulation study. The third setting includes the strongest predictor of the outcome model (premeasure of depression). Finally, the fourth setting includes six additional covariates. This setting is designed to correspond to our simulation conditions (no covariates, violation of ER and monotonicity with incorporating covariates in the compliance model, and violation of LSI with incorporating covariates in the outcome model). From the simulation study, we expect the results from the two methods differ from the baseline model if either monotonicity or ER is violated after incorporating covariates in the compliance model. Consistent with the simulation findings, we also expect the results for the two methods to be more or less equally affected by incorporating covariates in the outcome model (see Figure 5).
Table 1 summarizes the results of the analysis comparing the mediation effects for sense of mastery. There are three aspects of these findings that warrant discussion. First, for the baseline model that does not include any covariates, the difference in the estimates for the two methods is minimal. The largest difference is the CACE estimate (0.007 points), which translates to an effect of 0.01 SD. According to the simulation study results, this difference might originate from differences in the distributional assumption of the two methods. Second, there are hardly any differences in the CACME estimate between the baseline model and the model with the strongest predictor of compliance (motivation) for either the IV-mediate method or the ML-mediate method. Even the strongest covariate plays a limited role in terms of predicting compliance status. However, once all covariates are included, the CACME estimates for the ML-mediate method increase. This implies that ER is somewhat violated (see Figure 3). Finally, the CACME estimates change somewhat when the strongest predictor of the outcome is added, which is consistent with the results shown in Figure 5 of the simulation study. Recall that LSI assumes the association between the mediator and outcome is unconfounded among compliers. The reduction in the CACME estimate due to adding the measure of prior depression suggests that prior depression is a confounder of the mediator–outcome association, and therefore adding it helps address LSI.
Estimates From the Instrumental Variable (IV-Mediate) and Maximum Likelihood (ML-Mediate) Methods
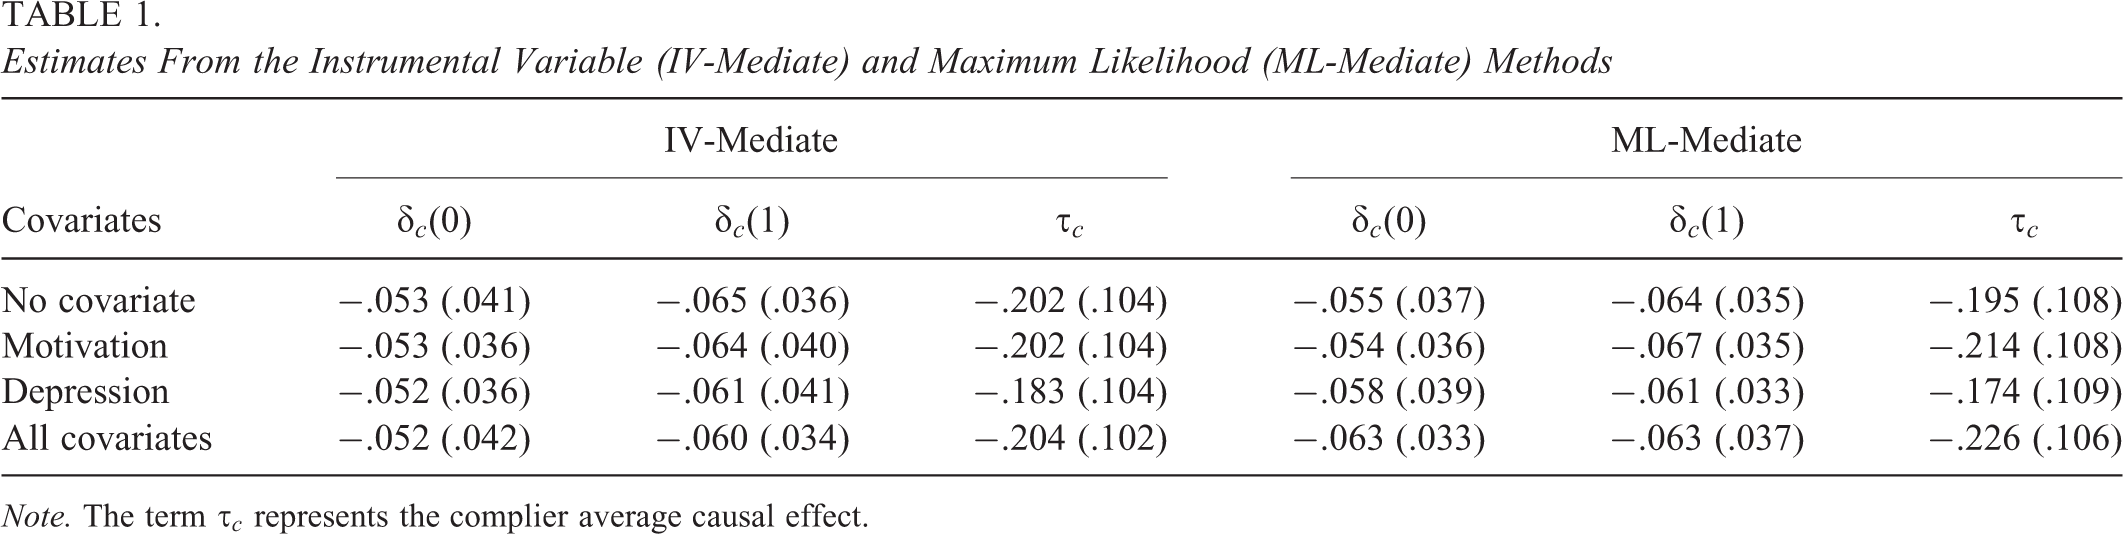
Note. The term
According to the simulation study findings, violations in the distributional assumption of the compliance model may result in differences in the two estimation approaches. Therefore, we begin by examining the distributional assumption of the baseline compliance model. Table 2 summarizes the goodness of fit and prediction accuracy for the compliance model. We considered model fit using the Lemeshow and Hosmer (1982) goodness-of-fit test, which is widely used for logistic regression models. The test indicates poor fit when the p value is less than .05. We used the recommended 10 groupings, which results in eight degrees of freedom. For the model with covariates, the χ2 values of 2.87 (p = .94) and 9.51 (p = .30) suggest the logistic models for predicting compliance status fit the data adequately or better. However, the Hosmer–Lemeshow χ2 does not test which distribution fits the data best. To examine that, we checked the predictive accuracy based on binomial and random distributions, which is presented in the right panel of Table 2. Prediction accuracy tests how well the model (e.g., logistic or random model) predicts data, by computing the difference between the fitted value and data for compliance status. Covariates are not associated with the completely random distribution, so adding them does not improve prediction. For the binomial distributions, the prediction accuracy improves as covariates are added. The prediction accuracy is more or less equal between the two distributions but substantially better for the binomial distributions with all the covariates included. It is important to note that the binomial distribution is favored by the ML-mediate method.
Goodness-of-Fit Statistics of the Compliance Model
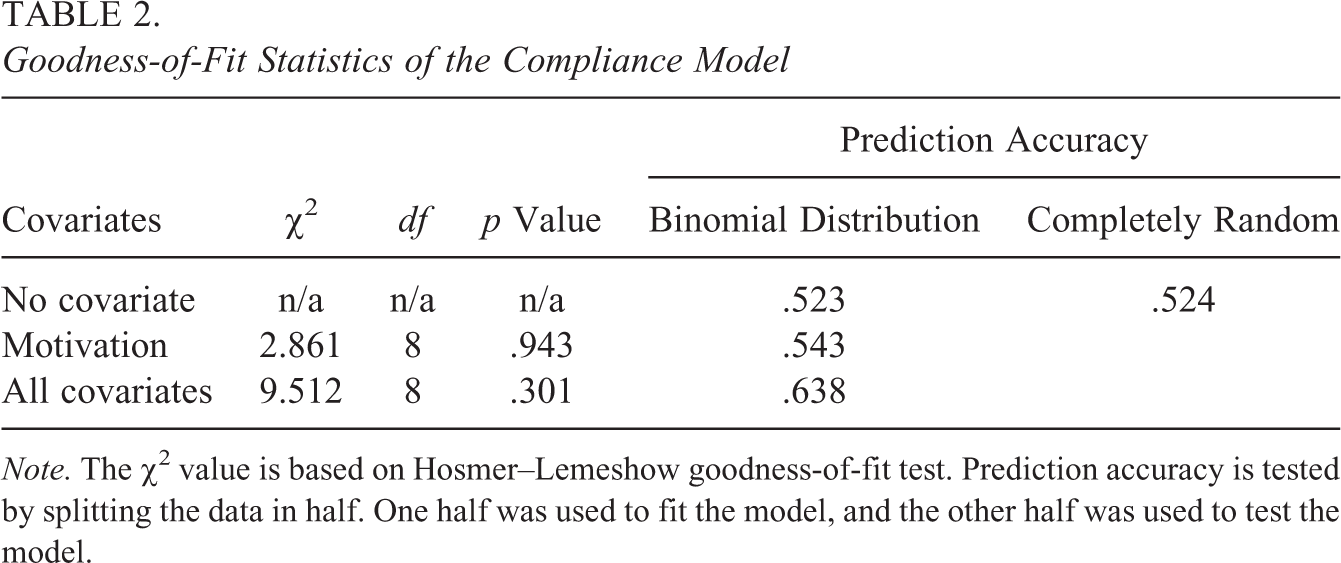
Note. The χ2 value is based on Hosmer–Lemeshow goodness-of-fit test. Prediction accuracy is tested by splitting the data in half. One half was used to fit the model, and the other half was used to test the model.
Unlike distributional assumptions, structural assumptions are not directly testable from the data at hand because they involve unobserved potential outcomes. However, we found evidence that the ER is not strongly violated in the JOBS II data, which makes it easier to choose between the two methods in this example. This is because, according to our simulation study, covariates are expected to improve the performance of the ML-mediate method when ER and monotonicity are violated as long as the effect size of the covariates is at least 0.5 on the logit scale (i.e., odds ratio = 1.64) for the compliance model. As discussed before, adding the strongest predictor to the compliance model had only a very small impact on the estimates compared to the baseline model for the JOBS II application. Moreover, monotonicity is almost surely met because access to the job training seminars is not available for those who are assigned to the control condition. However, there are scenarios in which the ER is likely violated, for example, if a noncomplier assigned to the treatment was demoralized by the failure to attend the training seminar but still learned job-searching skills by reading the booklet. In this scenario, we can expect a biased CACME estimate, and the bias will be more pronounced in the IV-mediate method according to our simulation study (see Figure 3). However, given that the difference between the two methods after incorporating all covariates is minimal, it is unlikely that the ER is severely violated.
In summary, the results suggest that the IV-mediate and ML-mediate methods provide highly similar estimates, which gives confidence in the results of our analysis. However, the compliance model distribution appears closer to binomial than random, which is favored by the ML-mediate method. According to the ML-mediate results, the
6. Discussion
This article investigates the relative performance of two methods for estimating the average causal mediation effect among compliers: the IV-mediate and ML-mediate methods. Some structural assumptions are required to uniquely identify the CACME (SUTVA, ER, monotonicity, and LSI). While the IV-mediate method does not require any parametric assumption, the ML-mediate method requires a distributional assumption with respect to the compliance, mediator, and outcome models and/or additional covariates. We were particularly interested in the performance of these two methods when one or two structural or distributional assumptions are violated.
Both methods are sensitive to the violation of structural or distributional assumptions. To be more specific, first, it appears that a distributional assumption of the compliance model plays an important role in obtaining the unbiased estimate of the CACME. The estimate obtained from the ML-mediate method is biased when a parametric assumption of the compliance model is violated, even when all structural assumptions are met. Conversely, the estimate obtained from the IV-mediate method is biased when a parametric distribution was not accounted for. This suggests that the distributional assumption (especially with respect to the compliance model) is as important as the structural assumptions to consider when choosing an estimation method. This finding provides important guidance to applied researchers regarding which estimation method to choose in the context of their particular studies. We did not assess the sensitivity with respect to the bivariate normal distributions of the mediator and outcomes, but according to Stuart and Jo (2015), this ML-based approach is sensitive to the violation of the normality assumption especially when the ER is violated. As an alternative, the propensity score weighting approach (see, e.g., Jo and Stuart, 2009) can be used, which is insensitive to the normality assumption.
Second, assuming that a distributional assumption is met, the IV-mediate method performs better when monotonicity is violated compared to the ML-mediate method. However, the ML-mediate method performs better when ER is violated compared to the ML-mediate method. We acknowledge the fact that this finding is confined to a particular setting (5% of defiers and effects of noncompliers are set to half of the compliers effect). The reason for this particular setting is that we wanted to focus on change in the performance of the two methods after incorporating covariates. After incorporating covariates, the bias due to the violation of ER obtained from the ML-mediate method is substantially reduced. This is in line with Stuart and Jo (2015) and Jo (2002). However, it is important to be aware that the advantage of using covariates comes with the price of meeting the distributional assumptions. Likewise, the bias due to the violation of monotonicity obtained from the ML-mediate method is substantially reduced when a covariate is added, but the variance increases, and as a result, the IV-mediate method provides a superior performance in terms of RMSE, especially when the sample size is small. An applied researcher can use this information when choosing the estimation method. For example, the ML-mediate method would be a better choice if the ER is suspected to be violated, but the parametric assumption of the compliance model is met with good predictors of the compliance status. Conversely, the IV-mediate method would be a better choice if the parametric assumption of the compliance model is violated or monotonicity is violated with a smaller sample.
The study highlights the importance of carefully choosing the estimation method when modeling causal mediation effects in the presence of treatment noncompliance. The best choice depends on the likelihood that structural or distributional assumptions are violated, the existence of additional covariates, and data characteristics (sample size and compliance rate). Unlike distributional assumptions, structural assumptions are not empirically testable. Therefore, it is important to consider scenarios under which each structural assumption may be violated. For example, in the application using JOBS II data, ER will be violated if some people assigned to the treatment group fail to participate in the training (i.e., never-takers) and, as a result of this failure, become depressed.
This study isolates the impact of violations of each assumption on the performance of the two estimators when the other assumptions are met. However, in practice, multiple assumptions may be violated simultaneously. Although the case of multiple simultaneous violations was not directly addressed, we provide some guidance for assessing that based on the results of our simulation study and empirical application. First, we recommend applied researchers to “begin by testing the distributional assumptions.” If the distributional assumption of compliance is violated, avoid using the ML-mediate method. Second, we “compare estimates obtained from both IV-mediate and ML-mediate methods.” As shown in the case study, the comparison will provide insight into whether some structural assumptions are violated. For example, if the estimates from the ML-mediate method do not change after incorporating good predictors of compliance (i.e., odds ratio
Supplemental Material
Supplemental Material, eAppendix - Sensitivity Evaluation of Methods for Estimating Complier Average Causal Mediation Effects to Assumptions
Supplemental Material, eAppendix for Sensitivity Evaluation of Methods for Estimating Complier Average Causal Mediation Effects to Assumptions by Soojin Park and Gregory J. Palardy in Journal of Educational and Behavioral Statistics
Footnotes
Appendix
Declaration of Conflicting Interests
The author(s) declared no potential conflicts of interest with respect to the research, authorship, and/or publication of this article.
Funding
The author(s) received no financial support for the research, authorship, and/or publication of this article.
Notes
References
Supplementary Material
Please find the following supplemental material available below.
For Open Access articles published under a Creative Commons License, all supplemental material carries the same license as the article it is associated with.
For non-Open Access articles published, all supplemental material carries a non-exclusive license, and permission requests for re-use of supplemental material or any part of supplemental material shall be sent directly to the copyright owner as specified in the copyright notice associated with the article.