
Abstract
Cognitive diagnosis models (CDMs) are the assessment tools that provide valuable formative feedback about skill mastery at both the individual and population level. Recent work has explored the performance of CDMs with small sample sizes but has focused solely on the estimates of individual profiles. The current research focuses on obtaining accurate estimates of skill mastery at the population level. We introduce a novel algorithm (bagging algorithm for deterministic inputs noisy “and” gate) that is inspired by ensemble learning methods in the machine learning literature and produces more stable and accurate estimates of the population skill mastery profile distribution for small sample sizes. Using both simulated data and real data from the Examination for the Certificate of Proficiency in English, we demonstrate that the proposed method outperforms other methods on several metrics in a wide variety of scenarios.
1. Introduction
Formative assessment is any form of assessment that seeks to obtain evidence about student learning and then use this evidence to provide both learners and educators with feedback that can guide future learning and instruction (Black & Wiliam, 2009). This type of assessment, when applied correctly, can greatly enhance student learning in a classroom setting. For example, a review by Black and Wiliam (1998) highlighted multiple studies that showed that formative assessment and feedback improved student learning and outcomes in classroom settings. One type of formative assessment tool that has proven to be useful is the cognitive diagnosis model (CDM; Leighton & Gierl, 2007; Rupp et al., 2010), which can be used to provide teachers and students with specific feedback regarding skill mastery. This is done by estimating a “skill mastery profile,” which is a binary vector where each element corresponds to a specific skill with 1 indicating mastery of that skill and 0 indicating lack of mastery.
Despite their utility, CDMs are often only used to analyze the results of large-scale assessments. In their review of applications of CDMs, Sessoms and Henson (2018) found that most studies used sample sizes exceeding 1,000. The smallest sample sizes used in these studies exceeded 50, which is still larger than the average classroom size in the United States (National Center for Education Statistics, 2018). In addition, some of the studies with small sample sizes used pooling to combine information from several small samples, which might not always be possible. To be useful to more educators, these models need to perform well in situations with less than 50 students in the classroom and should not rely on pooling of samples. Thus, a new challenge in educational statistics is developing methods that can be used to accurately describe skill mastery in everyday classroom settings using test responses from only a handful of students.
Some solutions to the problem of small sample sizes when performing cognitive diagnosis have been explored. One common CDM, the deterministic inputs noisy “and” gate (DINA) model (Junker & Sijtsma, 2001; Macready & Dayton, 1977), has been tested in simulation studies with smaller sample sizes. Shu et al. (2013) found that the DINA model performed well in terms of classifying students’ skill mastery profiles with samples as small as N = 20. The nonparametric diagnostic classification (NPCD) method, introduced by Chiu and Douglas (2013), also showed potential in performing well with small sample sizes. Finally, the possibility of using neural networks for cognitive diagnosis with small sample sizes has also been explored with some success (Cui et al., 2016; Shu et al., 2013). In a simulation study performed to compare all three methods, researchers found that each approach performed favorably with small sample sizes, with the DINA model and NPCD method outperforming the neural network model (Paulsen & Valdivia, 2022).
Each of these methods has been shown to perform reasonably well with small samples when it comes to estimating individual profiles. However, the accurate estimation of individual profiles is not the only important task that can be performed with CDMs. In some situations, it can be of equal if not greater importance for educators to obtain accurate estimates of skill mastery at the population level. This is often done with large sample assessments to study groups of students to better understand broader trends in learning such as with the Trends in International Mathematics and Science Study assessments (Choi et al., 2015; Lee et al., 2011). For many teachers, it would be equally valuable to have an accurate picture of skill mastery for the entire classroom. De La Torre and Minchen (2014) suggested that teachers can use group-level information provided by CDMs to “tailor subsequent instruction, providing the double benefit of serving students and maximizing the efficiency of classroom instructional time.” While individual profile estimates are useful for personalized learning, group-level estimates can help teachers plan learning activities and develop curriculum that will be most useful for the entire class.
While the benefits of accurate estimates of skill mastery for an entire classroom population are clear, obtaining such estimates can be difficult with small sample sizes. Current methods can guarantee accurate estimations of these quantities for large samples (Gu & Xu, 2019; Wang & Douglas, 2015), but their ability to do so might be hindered in every day classroom situations where the number of students is small. Furthermore, our research shows that other methods that have been used for obtaining individual profile estimates might not be the most accurate when it comes to estimating population-level parameters related to skill mastery. The goal of the current research is to explore the performance of previously proposed methods when it comes to estimating skill mastery for a small group of students as well as propose an alternative method that overcomes the weaknesses these methods exhibit in such situations.
In this article, we propose a method that can be used to estimate the true underlying population distribution of skill mastery profiles with higher accuracy than current methods when sample sizes are small. This method is based on the popular machine learning concept of bagging and random forests introduced by Breiman (1996, 2001). The idea behind these methods is to fit the data to a variety of different models, obtain estimates from each model, and then aggregate these estimates into a single estimate. This approach is especially useful to avoid overfitting, which can often occur when working with small samples to estimate a model with many parameters. We show how this concept can be used with the DINA model to produce more accurate and stable estimates of the skill mastery profile distribution in small samples.
The remainder of this article is structured as followed. In Section 2, we discuss common cognitive diagnosis methods used with small sample sizes and formally introduce the DINA model. Next, in Section 3, we describe the proposed algorithm and provide key details for its implementation as well as a discussion on how our methodology relates to and differs from the ideas behind bagging and random forests. In Section 4, we perform a simulation study that compares the proposed algorithm to the DINA model as well as the NPCD method. In Section 5, the proposed method is than applied to the ECPE data set to illustrate its performance of our model to other methods when working with real-life data. Finally, in Section 6, we provide a discussion on the advantages of the proposed method and possible direction for future research.
2. Cognitive Diagnosis With Small Sample Sizes
There are several common approaches for performing cognitive diagnosis with small sample sizes. The DINA model is one of the simplest and commonly used CDMs and has been shown to perform well with small sample sizes in certain simulations (Shu et al., 2013). Nonparametric alternatives have also been proposed. The most popular of these include the NPCD and general NPCD methods (G-NPCD; Chiu & Douglas, 2013; Chiu et al., 2018). Finally, neural networks have also been used (Cui et al., 2016; Shu et al., 2013). Since the G-NPCD and NPCD methods are similar and because recent simulation studies have shown that the G-NPCD method does not outperform the NPCD method in many cases (Chiu et al., 2018), for the current research, we choose to only include the NPCD method when making comparisons to our proposed method. For the sake of comparison and replication, we also choose to implement a simple artificial neural network (SANN) approach, despite some studies showing that it is often inferior to the DINA and NPCD methods (Paulsen & Valdivia, 2022). In what follows, we briefly describe each of these methods in turn.
2.1. DINA Model
Let

This represents the probability of a student responding correctly to an item given a certain skill mastery profile. Instead of treating the person-level skill mastery profiles as parameters to be estimated, we can introduce a population-level skill mastery probability vector

Maximum likelihood estimates (MLEs) of model parameters in Equation 2 can be obtained using the expectation–maximization algorithm (De La Torre, 2009). For model parameters to be identifiable, certain conditions on the Q-matrix must be met. These conditions have been outlined in detail by Gu and Xu (2019). Assuming that these conditions have been met, it can be shown that the MLEs will converge in probability to the true values of the model parameters. However, these results assume that the number of students, N, is sufficiently large. When the sample size is small, the estimates of
2.2. NPCD Method
The NPCD method is a nonparametric classification method that obtains an estimate of

Chiu and Douglas (2013) found that they could achieve slightly better performance by weighting each distance according to the inverse sample variance. Thus, the estimate of the skill mastery profile for student i would then be found by replacing Equation 3 with

where

Similarly, since estimates of


One drawback of this method is that it does not directly estimate the levels of skill mastery at the population level. While an estimate of skill mastery for the entire group can be obtained using individual estimates of skill mastery, such an estimate might not necessarily be as accurate as an estimator designed specifically for that purpose, especially when the sample size is small. Similar to the DINA model, the estimator used here for
2.3. SANN Method
The SANN method uses a simple feed-forward neural network with one input layer, one hidden layer, and an output layer. As with Cui et al. (2016) and Shu et al. (2013), the input layer takes an ideal response pattern under the DINA model and connects it to the corresponding attribute profile. Let A represents an

The goal of this approach is to find the values of W
1 and W
2 that minimize some error function for

Once this error function is minimized, the SANN is trained and is ready to be used to classify real response sequences into one of the attribute profiles. This would be done by providing the trained network, with estimated weight matrices

The final estimate

and the estimates for model parameters can again be produced using the same approach given for the NPCD method with Equations 5 through 7.
An advantage of this method is that it can be trained using simulated data, and thus, its accuracy is not as affected by the sample size N as other methods might be. As long as the number of training examples, M, is sufficiently large and the network has enough learning capacity, it will be able to find an accurate mapping from ideal response patterns to the true corresponding attribute profiles. A major drawback of this method is that it is trained using ideal response patterns instead of real response patterns. As such, it has difficulty accounting for deviations from the ideal patterns that can occur due to slipping or guessing. Thus, while it has the potential to work well with any sample size, its performance depends to a large extent on how much the observed data deviate from the patterns used to train the network.
3. Bagging Algorithm for DINA Model (DINA-BAG)
The motivation behind bagging is to use multiple estimates from a variety of models to improve upon estimates from any individual model. By aggregating results from different models, parameter estimates become more stable and are less influenced by noise in the dataset, which can be especially useful when the number of observations is small. We begin by introducing the DINA-BAG algorithm and then proceed to describe key details. After demonstrating how the algorithm works, we will provide some thoughts on how the proposed methodology relates to and differs from traditional bagging algorithms as they are used in the machine learning literature.
First, assume the Q-matrix for the assessment meets the requirements outlined by Gu and Xu (2019) for identifiability of model parameters. More specifically, we assume that the Q-matrix, Q, contains an identity submatrix, that each skill is measured by at least three items, and that no two columns in the Q-matrix are identical. This means that any subset of two or more columns of Q will also result in an identifiable Q-matrix. Now, we define four important sets required for the bagging algorithm:


Now, let 1. For each Compute Obtain Use 2. Compute the estimates of


With the general algorithm described, we now proceed to give key details required for performing each step in the algorithm, specifically steps (a) and (c).
3.1. Computing
and
For any

For each Q-matrix


This Q-matrix meets the conditions for identifiability described by Gu and Xu (2019). The number of skills is


Now, let

The corresponding item response matrix,

Similarly, we have that matrices

and the corresponding item response matrices

3.2. Estimating p , s , and g Using
,
, and
A key part of the bagging algorithm will involve fitting the DINA model using the newly created submatrices
First, we describe a simple approach that can be used to obtain an estimate of
To obtain an estimate of pc
from


Now, if we want to obtain an estimate of

Therefore, the estimate of

Because we assume that

Finally, this gives the estimates

Obtaining the estimates of

with estimates of s 2, s 4, and s 6 and g 2, g 4, and g 6 being treated as missing.
3.3. Connections Between DINA-BAG and Ensemble Methods
The algorithm described in the previous sections was inspired by ensemble methods used in the machine learning literature. However, there are some novel adaptations that deviate from the norm. As such, it is useful to understand how the proposed algorithm relates to current methods as well as where it departs from the current literature. Bagging, short for “bootstrap aggregating,” as originally introduced by Breiman (1996), was a method of training “weak learners” on different subsets of a dataset and then combining the individual predictions from each weak learner to form a better prediction. Later, Breiman (2001) introduced the idea of random forests which proposed using a different subset of predictors for each of the weak learners that was trained. This helped to reduce the correlation between predictions by weak learners, thus potentially improving the aggregated predictions.
These methods are inherently nonparametric and as such are typically concerned with prediction rather than parameter estimation. Training algorithms for these methods focus on minimizing some distance metric between the observed data and the model predictions. While some approaches, such as SHAP (Shapley additive explanations) values (Lundberg and Lee, 2017), have been developed to help explain how predictors influence outcomes, it is difficult to know if or how these would apply with specialized latent variable models such as CDMs. Our proposed method seeks to glean wisdom from the ideas behind these techniques while adapting them to be able to provide estimates of model parameters for a hypothesized model, such as the DINA CDM. Thus, while it is similar to these algorithms, it is also different in ways that allow it to better accomplish the task at hand.
The main relationship between our proposed algorithm and traditional bagging/random forest algorithms is that we fit the same model (i.e., the DINA model) using different subsets of “predictors” for each model. With random forests, the subsets of predictors are randomly sampled to train each weak learner (usually decision trees). With the DINA-BAG algorithm, we do not have traditional predictors, and instead, we select subsets of columns from the Q-matrix (see Equation 15). With the DINA model, the predictors are indicators as to whether someone has all the skills required to answer a question correctly, and since these quantities are the functions of latent variables and the Q-matrix, selecting different subsets of the Q-matrix redefines the latent space and can be thought of as forming a new predictor. Finally, again in contrast to random forests, this is not a random process, but rather a deterministic one, and is done by selecting all subsets of columns in the Q-matrix of size two or more.
With random forests, a decision tree is usually trained on each subset of the data using the randomly selected predictors. With the DINA-BAG algorithm, the DINA model is used. This provides a natural way to obtain the estimates of the model parameters we are interested in, instead of just predictions of observed data. Finally, as in bagging where the same model is fit several times to different subsets of data, the DINA-BAG algorithm also fits a model several times to different subsets of data. However, whereas in traditional bagging, these subsets are chosen randomly, with the DINA-BAG algorithm they are chosen in a specific way to allow for the estimation of specific parametric quantities (i.e.,
4. Simulation Study
A simulation study was conducted to evaluate the effectiveness of the proposed algorithm when it comes to estimating model parameters
True Underlying Distribution Equations
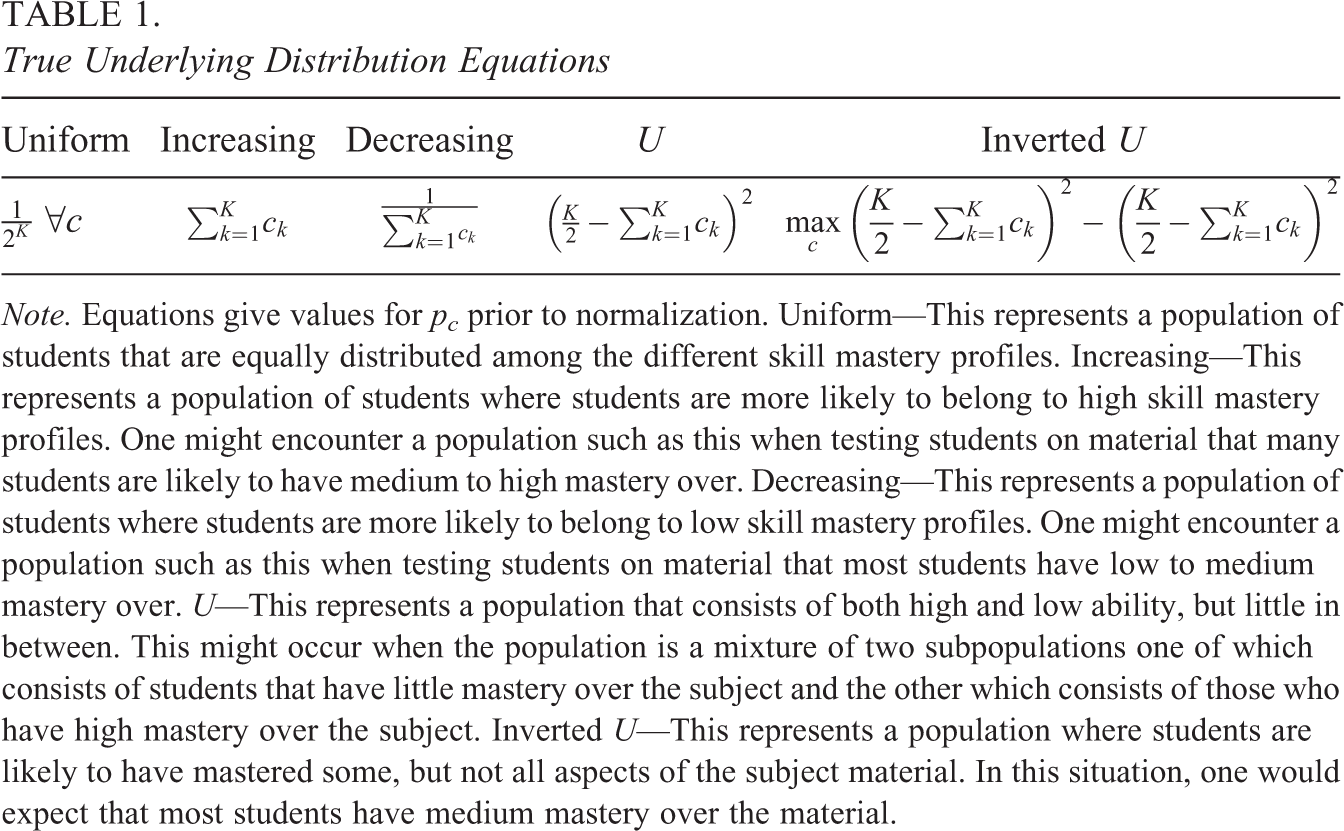
Note. Equations give values for pc prior to normalization. Uniform—This represents a population of students that are equally distributed among the different skill mastery profiles. Increasing—This represents a population of students where students are more likely to belong to high skill mastery profiles. One might encounter a population such as this when testing students on material that many students are likely to have medium to high mastery over. Decreasing—This represents a population of students where students are more likely to belong to low skill mastery profiles. One might encounter a population such as this when testing students on material that most students have low to medium mastery over. U—This represents a population that consists of both high and low ability, but little in between. This might occur when the population is a mixture of two subpopulations one of which consists of students that have little mastery over the subject and the other which consists of those who have high mastery over the subject. Inverted U—This represents a population where students are likely to have mastered some, but not all aspects of the subject material. In this situation, one would expect that most students have medium mastery over the material.
For each combination of sample size, test length, number of attributes, and true underlying skill mastery profile distribution, 30 different data sets were generated using the same Q-matrix. This resulted in a total of
4.1. Simulation Study Results
Figure 1 shows how sample size affects the performance of the four methods’ estimates of

Median values of the three metrics used to evaluate
Figure 2 shows the performance of methods’ estimates of slipping and guessing parameters. Differences in performance are less marked than in Figure 1 except for the SANN method, which is clearly outperformed by the other three methods in most scenarios. Again, this is likely due to the way the SANN is trained. The DINA-BAG method shows similar performance to the DINA and NPCD method for each sample size, although it should be noticed that the MSE is usually lowest for the NPCD method, except for when

Median values of mean-squared error for estimates of slipping and guessing parameters for different sample sizes along with bars for first and third quartiles. The bagging algorithm for deterministic inputs noisy “and” gate method performs similarly to other methods for each sample size with it slightly outperforming other methods for
Figure 3 is similar to Figure 1 but instead shows the influence of test length on the performance of each method’s performance. For each test length, the DINA-BAG method produces the most accurate estimates of
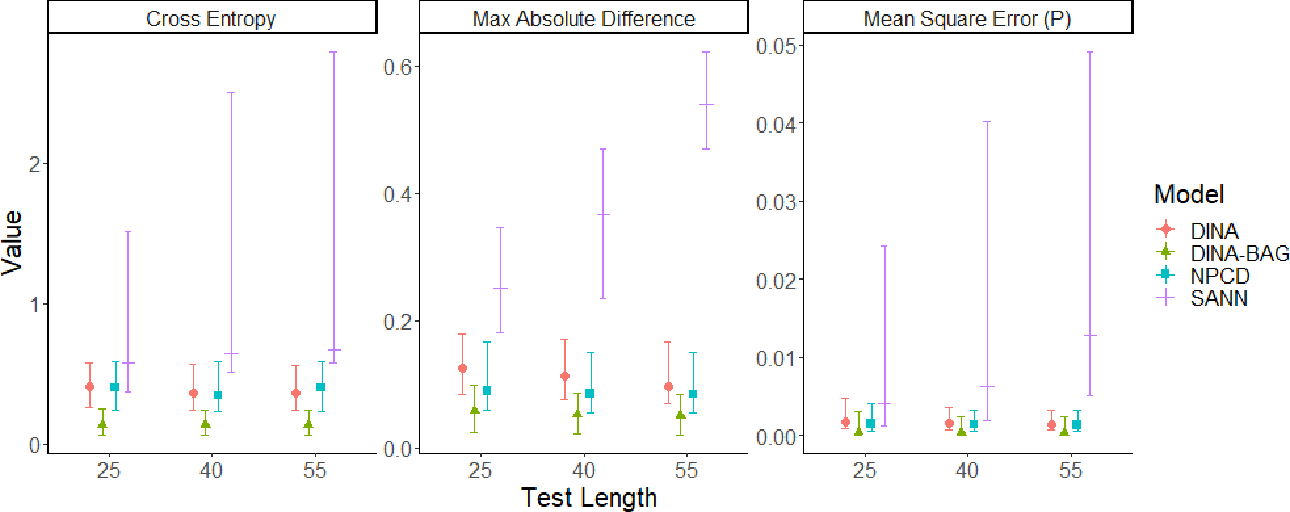
Median values of the three metrics used to evaluate
In Figure 4, we see the effect of test length on methods’ estimators of the slipping and guessing parameters. For guessing parameters, the DINA, DINA-BAG, and NPCD methods each perform similarly. The SANN method again performs the worst and its performance again degrades as the test length increases. For slipping parameters, each estimator appears to degrade as the test length increases. However, this decrease in performance is much more pronounced for the SANN method than for the other three methods. The DINA-BAG method’s performance once again tends to be better than that of the DINA method, but not as good as the performance of the NPCD method.

Median values of mean-squared error for estimates of slipping and guessing parameters for different test lengths along with bars for first and third quartiles. With the exception of the simple artificial neural network method, the performance of each method is comparable for each test length with the nonparametric diagnostic classification method producing the most accurate estimates of slipping and guessing parameters.
In Figures 5 and 6, we see the effects of increasing the number of attributes on estimator accuracy. When estimating

Median values of the three metrics used to evaluate

Median values of mean-squared error for the estimates of slipping and guessing parameters for different test lengths along with bars for first and third quartiles. Each method performs similarly when estimating slipping and guessing parameters for both
Finally, Figures 7
through 9 show how well each method is able to estimate

Median values of the three metrics used to evaluate

Median values of the three metrics used to evaluate

Median values of the three metrics used to evaluate
5. Simulation Study With ECPE Dataset
The DINA-BAG model was also used with the Examination for the Certificate of Proficiency in English (ECPE) data set to demonstrate its utility in real-world settings. This data set has been used by Templin and Bradshaw (2013, 2014) to demonstrate how to fit CDMs to item response data. It contains responses from 2,922 students to 28 questions designed to measure proficiency in the English language. This assessment measures knowledge of three parts of English grammar: (1) morphosyntactic rules, (2) cohesive rules, and (3) lexical rules.
Since in real-life settings it is not possible to know the true underlying distribution of skill mastery profiles, we will treat the DINA model’s estimate of
Since the Q-matrix is fixed for this assessment, we only study the effect of sample size on each model’s performance. For each sample size
5.1. Real Data Study Results
Figure 10 shows the effect of sample size on each method’s ability to estimate the value for

Effect of sample size on the performance of each method’s estimator of
In Figure 11, we can see how the different methods compare to one another in terms of their estimation of slipping and guessing parameters. In contrast to their performance when estimating the DINA model estimate of

Effect of sample size on each method’s estimators of slipping and guessing parameters. For guessing parameters, the nonparametric diagnostic classification method produces estimates closest to the those obtained with the full Examination for the Certificate of Proficiency in English data set, except when
Assuming the DINA model is a good fit for these data, these results indicate that when sample sizes are small, the DINA-BAG method is still able to produce the estimates of the true underlying distribution of skill mastery profiles that are both more stable and accurate than the estimates produced by the other three methods. In practice, when sample sizes are 30 or smaller, then we can expect the proposed method to outperform other methods in terms of providing a more accurate picture of skill mastery in the population. When the sample size is larger than 30, either the DINA or the NPCD method would be preferable, at least when the number of attributes is small. As the number of attributes being measured increases, we would expect the proposed method to outperform other methods for sample sizes larger than 30.
6. Discussion
Effective instruction and curriculum development depends on an educator’s ability to obtain accurate knowledge about levels of skill mastery in their classroom with respect to a variety of different skills. CDMs are useful tools that can provide this information but often are unable to accurately estimate the true distribution of skill mastery profiles when the sample size is small. This algorithm, which is inspired by ensemble machine learning methods, takes advantages of many different aspects of the data and combines estimates from different models to achieve impressive results when compared to other popular methods. It produces more stable and accurate estimates of the distribution of skill mastery profiles with very small sample sizes in a variety of different settings. It does this while still producing reasonably accurate estimates of other DINA model parameters when compared to other popular methods.
The method proposed in this article offers a better solution for educators that want to use test responses from a very small sample of students to obtain more accurate information about the larger population of students. This information could then be used to make better decisions regarding curriculum design or instructional practices that would more readily generalize to other groups of students in the same population. Through simulation studies we have shown that, for sample sizes of 100 or smaller, our proposed algorithm produces estimates of skill mastery that are closer to the true levels of skill mastery in the population with respect to a variety of different metrics designed to measure “closeness.” This is true for a variety of different distributions for skill mastery that might arise in practice.
In most situations, when the sample size is small, it would be preferable to use the DINA-BAG algorithm over other popular methods. Simulation studies showed that, with the exception of when the true underlying structure of skill mastery is U-shaped, the DINA-BAG method will outperform other methods on every metric when estimating
As the DINA-BAG method is designed to perform well for small sample sizes, it is important to recognize what factors should be considered when determining what “small” means. An important factor that influences whether the DINA-BAG method will be a better choice when compared to other methods is the number of attributes being measured. When only three attributes are being measured, a sample size of 100 will likely be more than enough for the DINA model to perform well, especially if the true underlying structure is U-shaped. However, as the number of attributes being measured increases, you will need increasingly larger sample sizes to outperform the DINA-BAG method. Current simulation studies suggest that when the sample size is 30 or smaller and the number of attributes is 6, the DINA-BAG method will outperform all other methods, regardless of the true underlying structure for
Many of the benefits seen in studies with simulated data were also realized in studies with real-life data. The simulation study with the ECPE data set suggested that the DINA-BAG method will still outperform other methods in terms of its ability to obtain more accurate information about population skill mastery from just a fraction of the data. In other words, assuming that the DINA model is an appropriate model for the data, then the DINA-BAG model will be able to use a very small sample size to obtain estimates of population skill mastery that are closer to those that would have been obtained had a larger sample size been available. In the case with the ECPE data set, this proved to be true when measuring only three attributes. As the number of attributes increases, we expect the advantages of our proposed method to become even more apparent.
The results presented here are novel and promising, but there is much work that could still be done to explore the strengths and weaknesses of the proposed algorithm. One area of future research could explore how the algorithm might improve performance when used with a variety of CDMs. Furthermore, while the current research assumed that the Q-matrix was complete and identifiable, it might be possible to adapt the algorithm, so that it can be used in cases where the Q-matrix is not identifiable. Also, as it is often the case that we do not know the true Q-matrix, it would be useful to understand how the algorithm performs when the Q-matrix is misspecified or when combined with methods developed to estimate the Q-matrix (Chen et al., 2018; Chung, 2019; Xu & Shang, 2018; Liu et al., 2020; Liu et al., 2012). Finally, while the methods applied here rely on frequentist estimates of model parameters, Bayesian approaches also exist (Culpepper, 2015). The ideas presented here could potentially be applied within a Bayesian framework to benefit from the strengths inherent in Bayesian methods.
Finally, since the focus of this research was to develop a method that could produce more accurate estimates of the true underlying distribution of skill mastery profiles for the population, we did not study classification accuracy at the level of the individual. However, this is an important aspect of assessment and future research should explore how the proposed algorithm performs in terms of classification accuracy for individual skill mastery profiles. It could be the case that the approach given here produces more accurate estimates of skill mastery for the population, but not for individuals. Future research should explore whether the proposed method should be used for individual classification or if it can be adapted for such situations. Last of all, since simulation studies suggested that the performance gain of the DINA-BAG algorithm over other methods is influenced by an interaction between sample size and the number of attributes being measured, this is something that future research should explore.
Footnotes
Declaration of Conflicting Interests
The author(s) declared no potential conflicts of interest with respect to the research, authorship, and/or publication of this article.
Funding
The author(s) received no financial support for the research, authorship, and/or publication of this article.