
Abstract
BACKGROUND:
VueBoxtrademark has been used for contrast analysis in DCE-US-based quantitative research.
OBJECTIVE:
Aim of this study was to use the enhancement-mode and VueBoxtrademark parameters to further evaluate the differential diagnostic value of DCE-US for renal tumors.
METHODS:
24 patients with renal tumors, including 7 benign and 17 malignant, were retrospectively analyzed.The DCE-US enhancement-mode and VueBoxtrademark parameters correlated with the histological analyses of tumors were obtained and analyzed.
RESULTS:
The benign and malignant renal tumors showed significant differences in enhancement degree (P = 0.017) and presence of a pseudocapsule (P = 0.009) and in the VueBoxtrademark parameters FT (P = 0.045) and RT (P = 0.039). Receiver operating characteristic analysis for differential diagnosis of benign and malignant renal tumors showed that AUC for a combination of enhancement degree and presence of a pseudocapsule was greater (AUC = 0.815) than the values for either parameter of enhancement mode alone. Similarly, the AUC for a combination of RT and FT was greater (AUC = 0.798) than the values for RT or FT alone. A comprehensive index obtaining by combining the enhancement-mode and VueBoxtrademark parameters showed the largest AUC (AUC = 0.916) with relatively high accuracy (87.50%), sensitivity (76.50%), and specificity (85.70%).
CONCLUSIONS:
DCE-US with enhancement mode and quantitative analysis can facilitate preoperative differential diagnosis of benign and malignant renal tumors.
Keywords
Introduction
Renal tumors are common space-occupying lesions in the urinary system, and the incidence of renal carcinoma ranks second in the urinary system tumors [1, 2]. Clinicians usually diagnose renal carcinoma on the basis of the typical triad: hematuria, abdominal pain, and abdominal masses. However, these typical clinical manifestations are not common and only present in approximately 5% to 10% of the cases of renal carcinoma, so routine imaging examinations are extremely important. The prognosis of renal carcinoma differs according to the clinical stage; thus, while the 5-year overall survival rate in patients with early-stage clear cell renal cell carcinoma (ccRCC) could be as high as 96%, it is no more than 10% for advanced-stage tumors [3]. Therefore, early detection and timely treatment for renal carcinoma are extremely important in improving the curative effect.
The commonly used methods for detecting renal tumors include computed tomography (CT), magnetic resonance imaging (MRI), and ultrasound (US). Although contrast-enhanced CT and MRI show high sensitivity and specificity for evaluation of renal tumors, their limitations include the use of ionizing radiation in CT, high cost of examination, as well as the nephrotoxicity caused by iodinated contrast agents and the nephrogenic systemic fibrosis caused by gadolinium-based contrast agents, which limit the usage of these agents in patients with renal impairment [4]. As a safe, nonradioactive, non-nephrotoxic and real-time imaging technique, dynamic contrast-enhanced US (DCE-US) has been widely used in clinical settings to differentiate between benign and malignant tumors in various organs, such as the liver, breast, spleen and kidney [5–9].
DCE-US is an advanced technique performed using microbubble-based contrast agents that can help improve the recognition of blood flow in target lesions. It has been reported to play an important role in the identification and differential diagnosis of benign and malignant renal tumors in recent years [10–12]. However, its primary limitation is the subjectivity of researchers in interpreting cancerous lesions, since the images of some benign and malignant tumors may appear similar, and accurate evaluations may not be possible with purely qualitative analysis. Thus, there is an urgent need to combine qualitative and quantitative analyses in the evaluation of DCE-US images. For quantitative analysis, Bracco developed the software program VueBoxtrademark [13], which has been used for contrast analysis with different instruments to facilitate quantitative research of DCE-US and can avoid the measurement errors generated by the instruments themselves.
Although VueBoxtrademark parameters for the diagnosis of different diseases have been already proposed, including prostate cancer [14], carotid body tumors [15], Crohn,s disease [16], thyroid nodules [17], liver tumors [18], and pancreatic lesions [19]. research on the role of VueBoxtrademark parameters in quantitative evaluation of renal tumors is limited. Therefore, in this study, we aimed to explore the potential value of the enhancement-mode and VueBoxtrademark parameters for preoperative diagnosis and differential diagnosis of benign and malignant renal tumors.
Materials and methods
Patients
We retrospectively analyzed the findings for 39 patients with renal tumors who presented to North China University of Science and Technology Affiliated Hospital between February 2018 and October 2021. The inclusion criteria were as follows: 1) no invasive treatments before DCE-US; 2) DCE-US at our hospital one week before surgery; and 3) confirmation by pathology, CT, enhanced CT, or MRI, with a follow-up time of more than 1 year,4) renal function of patients were normal. The exclusion criteria were as follows: 1) patients with simple renal cysts; 2) patients with severe mental disorders that hindered co-operation during DCE-US examinations; 3) patients with contraindications to surgery and allergy to contrast agents; and 4) patients with excessive respiratory fluctuations that affected the results of DCE-US. Prior to each DCE-US examination oral and written consent of the patient was obtained. All patients or their authorized immediate family members signed the informed consent form for DCE-US examinations (Fig. 1).
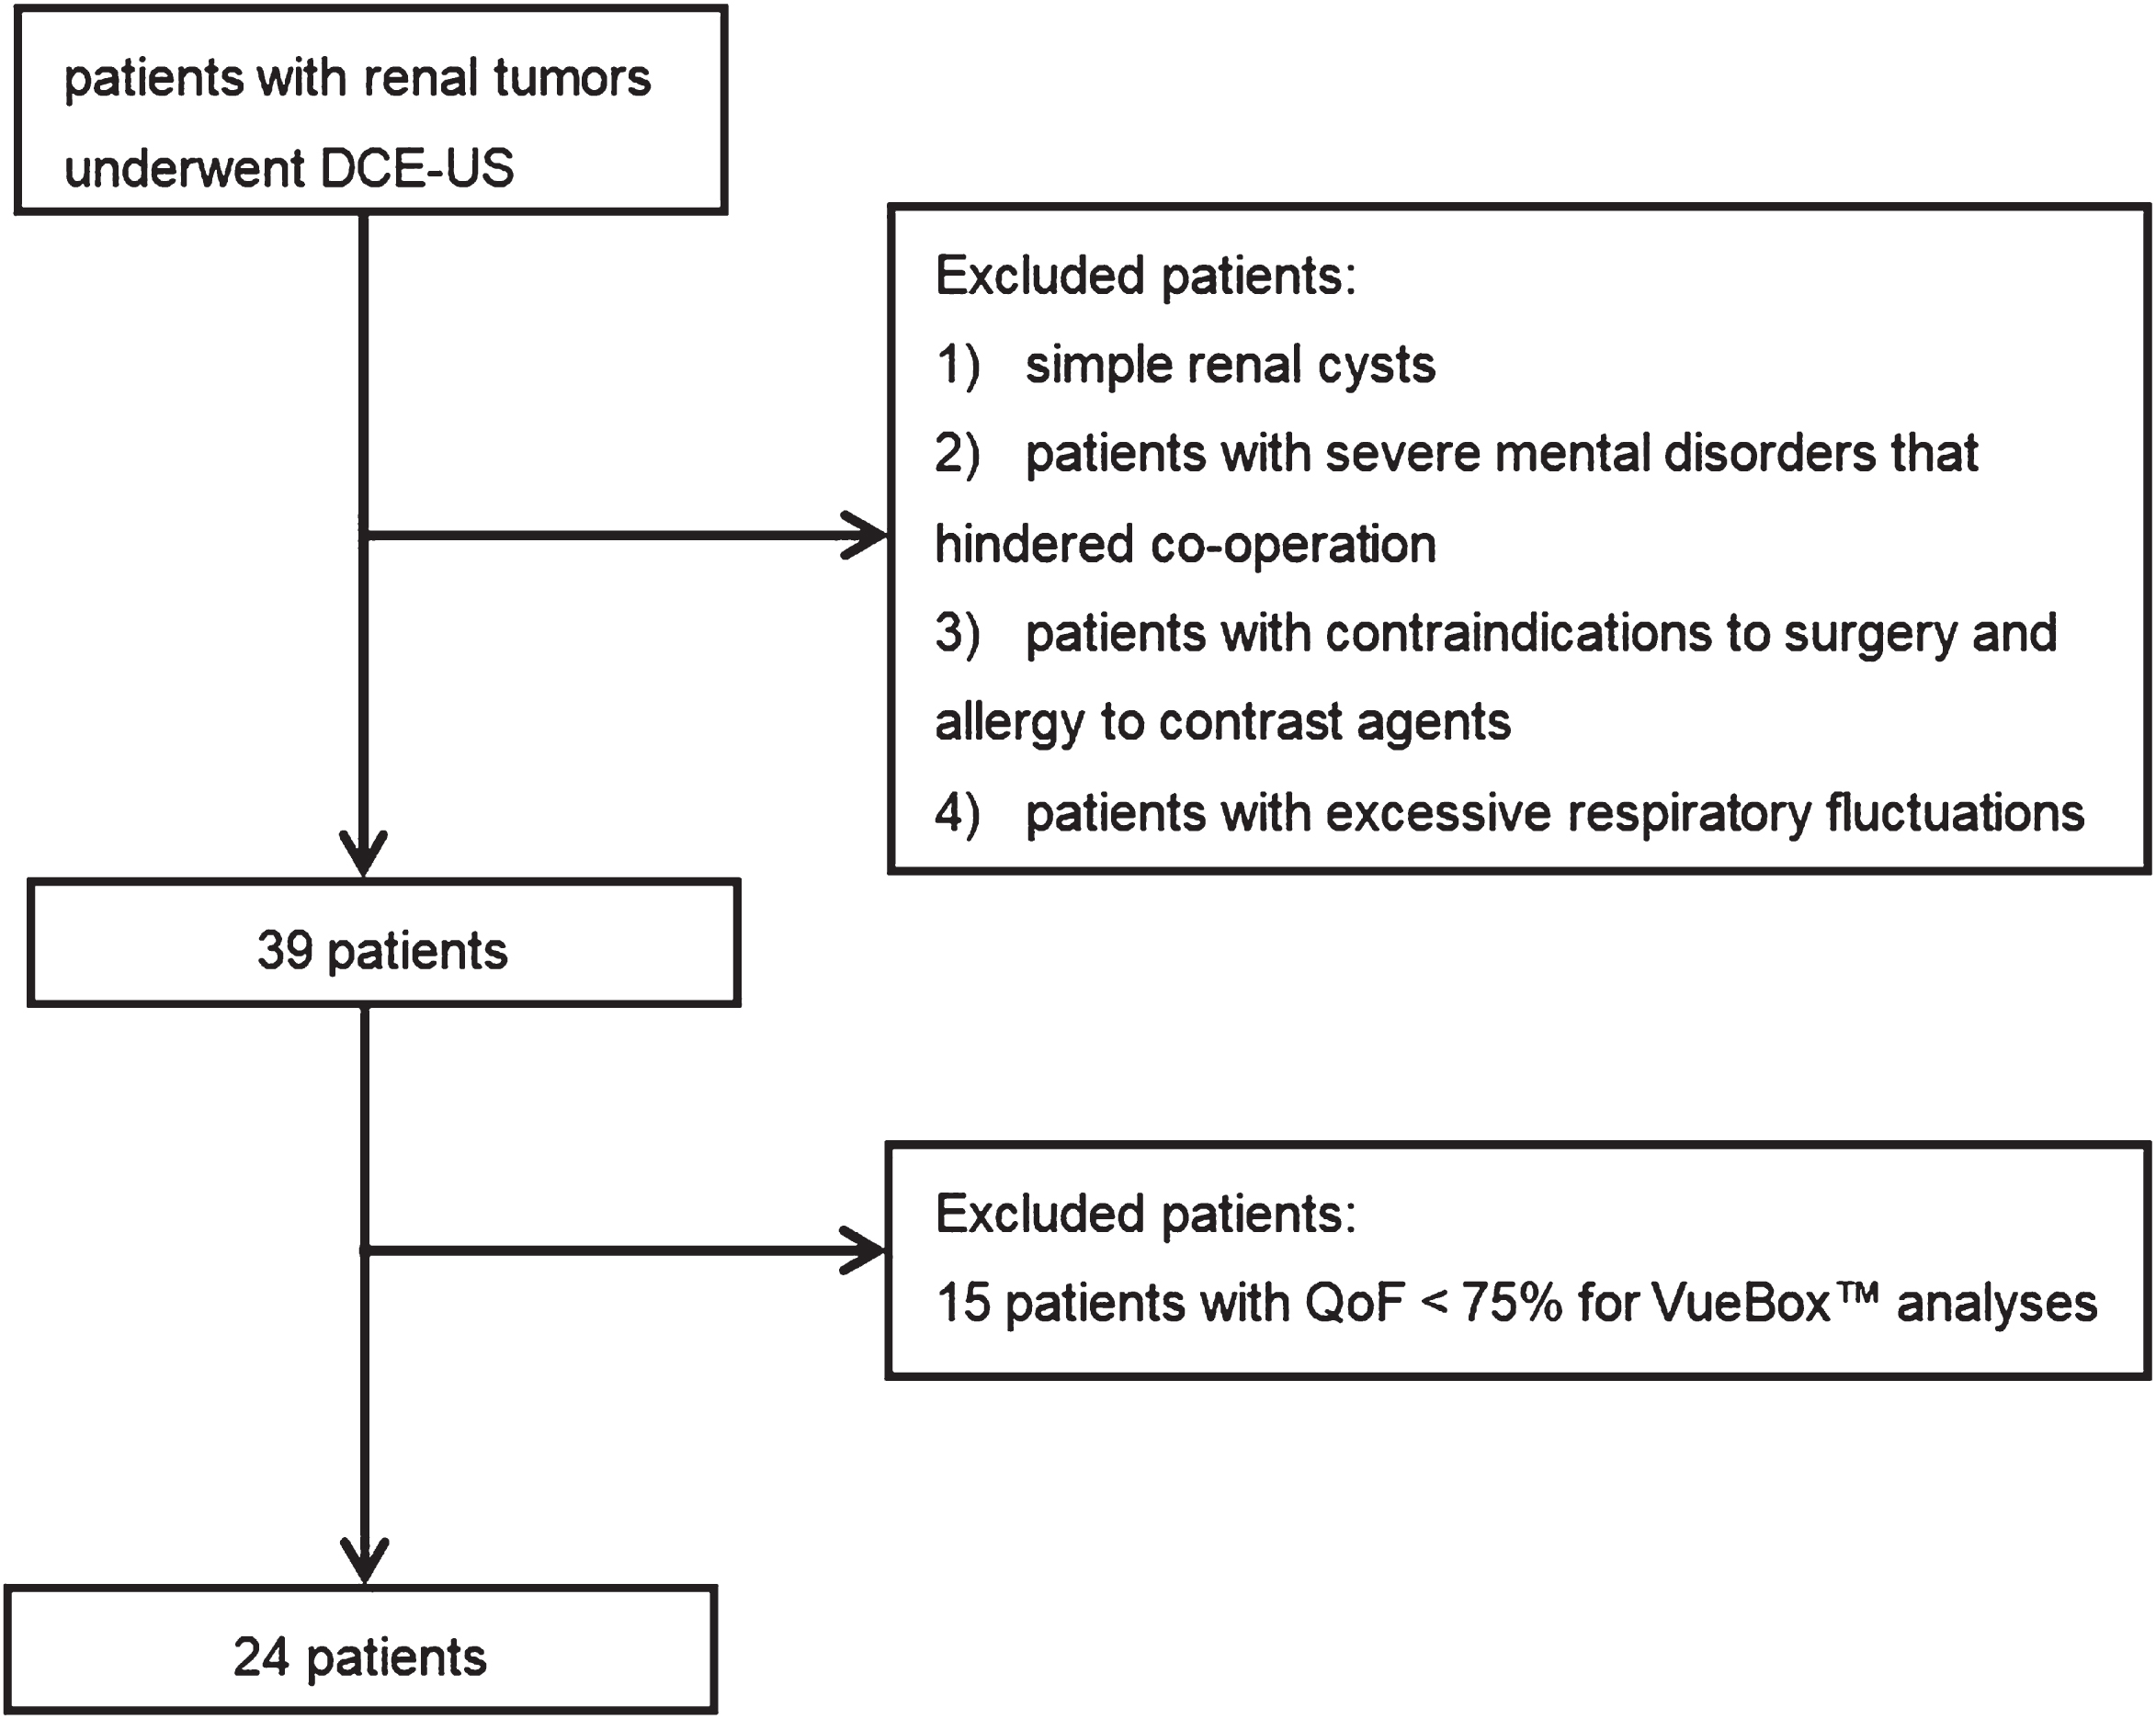
Flowchart of patients selection.
All ultrasound examinations were performed by a senior and experienced ultrasound physician with two high-end devices, one equipped with a C1-5 convex array transducer (Siemens ACUSON S2000), and the other equipped with a i8CX1 convex array transducer (CANON Aplio i800). SonoVue (Bracco Diagnostics) was used as the contrast agent.
B-mode imaging of the renal tumor was performed for measurement of tumor size, and color-coded imaging was performed to identify the blood supply to optimally adjust the transducer for the subsequent DCE-US examinations. Next, 2.4 mL of SonoVue was injected through the elbow vein and then rinsed with 5 mL of normal saline. Imaging was recorded on digital cine clips, starting shortly after the injection and continuing for up to at least 3 min without movement of the transducer. All DCE-US data were exported in DICOM format as cine loops for further analysis.
Qualitative analysis
The dynamic ultrasound images were analyzed retrospectively by two other experienced ultrasound physicians who were blinded to the pathological results and another senior doctor was consulted when the assessments performed by the physicians was inconsistent. The normal renal parenchyma adjacent to the tumor was used as the control for comparison of enhancement. The following enhancement mode parameters reflecting the inner diameter, course, distribution, and function of the blood vessels in the tumor as well as the relationship between the tumor and surrounding tissue were evaluated: Enhancement degree: In comparison with the enhancement of the surrounding normal renal parenchyma, the peak enhancement of the tumor was classified as hyper-enhancement, iso-enhancement, or hypo-enhancement. Homogeneity: Complete enhancement of the lesion without any defects was defined as homogeneous enhancement, while the presence of unenhanced areas, regardless of the enhancement degree, was defined as inhomogeneous enhancement. Wash-in pattern: When the enhancement time of the tumor was earlier, equal to, or later than that of renal parenchyma, the wash-in pattern was defined as fast, synchronous, or slow. Wash-out pattern: When the regression time of tumor is earlier, equal to, or later than that of renal parenchyma, the wash-out pattern was defined as fast, synchronous, or slow. Pseudocapsule: Annular or semiannular enhancement around the tumor indicated that the pseudocapsule was present, otherwise the pseudocapsule was considered to be absent. Enhancement pattern: Rapid or gradual filling of the contrast agent from the periphery to the center of tumor was defined as centripetal enhancement; rapid filling of the contrast agent simultaneously in the periphery and interior of the tumor was defined as overall enhancement; and rapid or gradual filling of the contrast agent from the center to the periphery was defined as centrifugal enhancement. Boundary: The boundary was defined as clear when the boundary between the tumor and surrounding tissue was clear on DCE-US; otherwise, the boundary was defined as unclear. Enhancement of peripheral tissue: Peripheral-tissue enhancement was defined as present when enhancement in the surrounding tissue extended outward from the tumor; otherwise, enhancement was defined as absent.
Quantitative analysis
To quantify contrast enhancement, the contrast clips were analyzed using VueBox (VueBoxtrademark; Bracco Diagnostics, Milan, Italy). The two experienced ultrasound physicians who were unaware of the pathological results delineated suitable regions of interest (ROI) in ultrasound data, and another senior doctor was consulted when their ROIs were not consistent. The size of the ROI depended on the size of the renal tumor, and another ROI was placed at the same level in the adjacent normal renal parenchyma for reference. The motion compensation function was used to increase the reliability of the evaluation results. The time-intensity curve (TIC), which displayed the average intensity in an ROI as a function of time and characterized the dynamic wash-in and wash-out of the contrast microbubbles in the ROI, was then generated (Fig. 2). We studied at least three ROIs and calculated the mean value for each of the parameters.
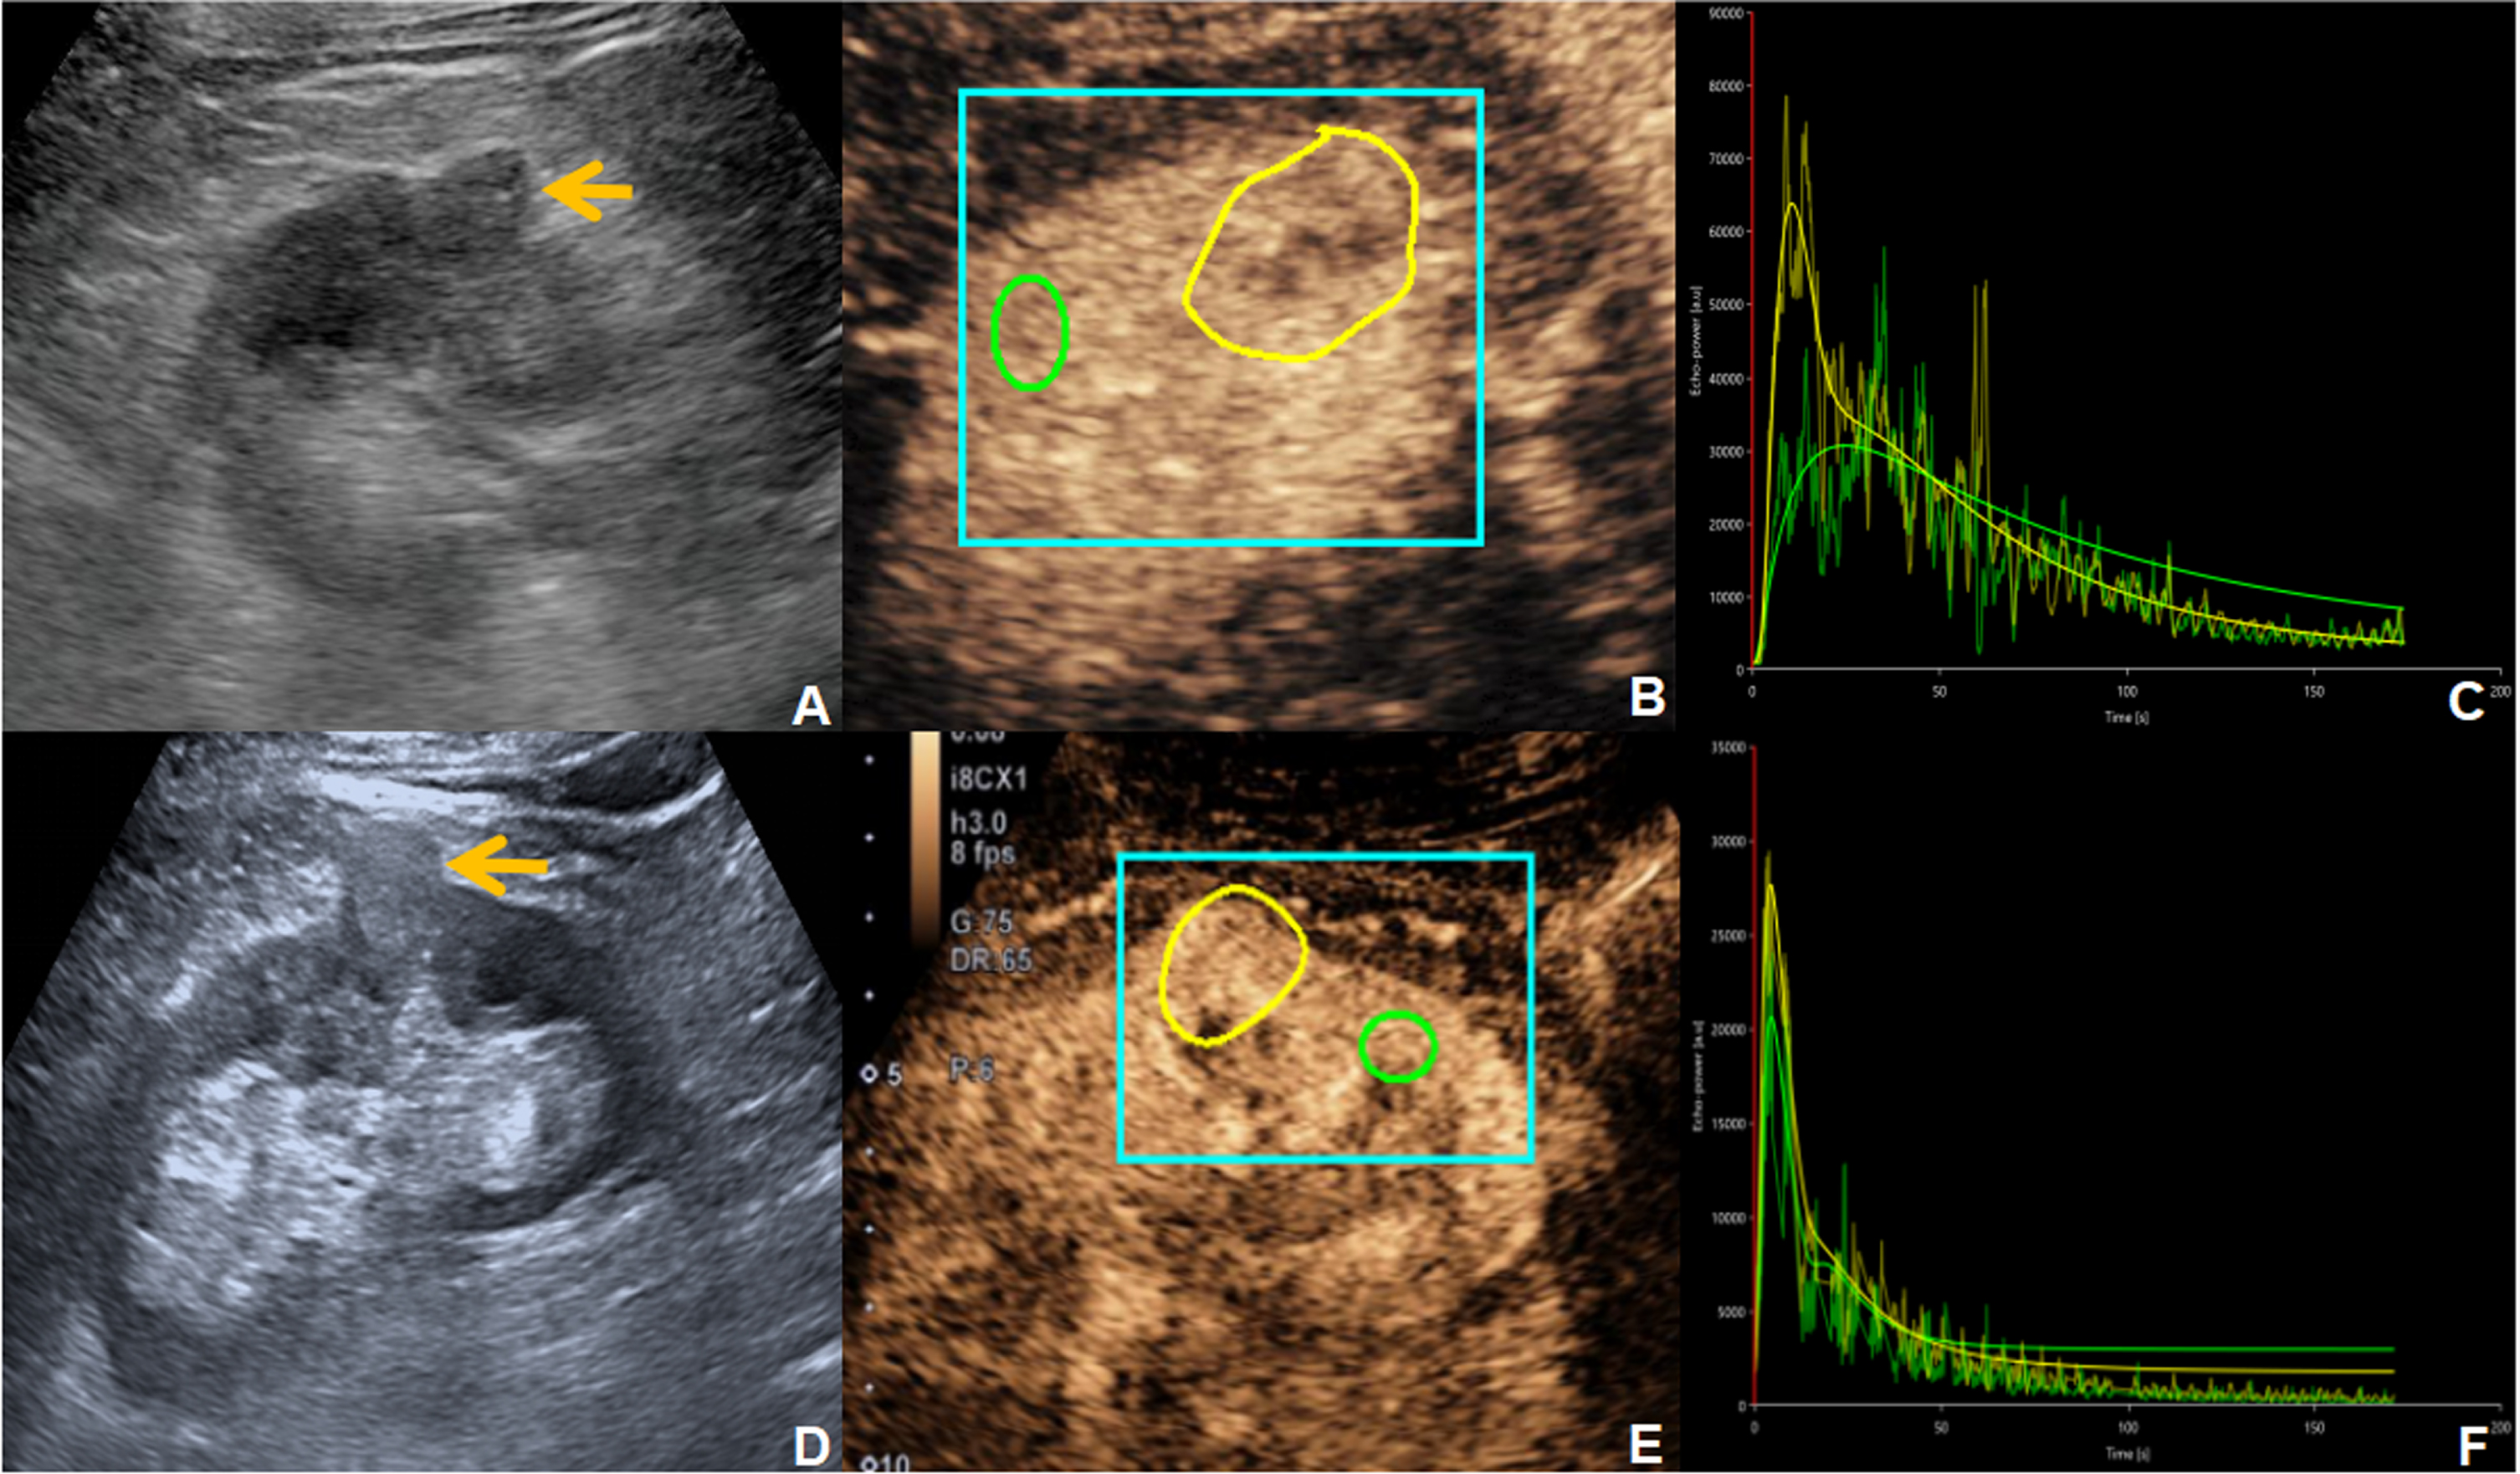
Images from a 72-year-old man with ccRCC of right renal(A-C) and a 54-year-old man with angiomyolipoma (AML) of right renal(D-F). B-mode showed a hypo-echoic and iso-echoic tumor, respectively (yellow arrows of A and D). A delineating ROI (blue square) represented the background reference region for computer analysis, the reference ROI (green) encompasses the renal parenchyma and the analysis ROI (yellow) represented tumor lesion (B, E). For the corresponding TIC, rough curves represent measured intensity data, and smooth curves were plotted according to the perfusion model using the measured data, the yellow and green lines correspond to renal tumor and renal parenchyma (C, F).
The fitting results were considered faithful when the quality of fit (QoF) was≥75%. The following quantitative parameters of DCE-US were recorded: peak enhancement (PE; dB), wash-in area under the curve (WiAUC; a.u), rise time (RT; s), mean transit time local (mTTI; s), time to peak (TTP; s), wash-in rate (WiR; a.u), wash-in perfusion index (WiPI; a.u), wash-out area under the curve (WoAUC; a.u), wash-in and wash-out area under the curve (WiWoAUC; a.u), fall time (FT; s), and wash-out rate (WoR; a.u).
Among these quantitative parameters, PE, WiAUC, WiPI, WoAUC, and WiWoAUC mainly reflect the filling amount of contrast agent, which is closely related to microvessel density; RT, mTTI, TTP, WiR, FT, and WoR reflect the filling or regressing speed of the contrast agent, which is related to the diameter, shape and patency of blood vessels and is mainly used to evaluate the function of microvessels [18].
All statistical analyses were performed with SPSS software (version 25.0, IBM Corp, Armonk, NY), and the normality of the data was tested before analysis. Continuous variables that showed a normal distribution were presented as means±standard deviation, and those that did not show a normal distribution were represented as median (inter quartile range). Categorical data were presented as frequency or rate. Continuous variables that showed a normal or approximately normal distribution were evaluated by Student’s t-test, and those that did not show a normal distribution were evaluated by the Mann– Whitney U-test. Categorical variables were compared using chi-square or Fisher’s exact tests. Diagnostic performance of single indicators was evaluated through receiver operating characteristic (ROC) curves. Diagnostic performance of combined indicators was evaluated through binary logistic regression and ROC curves. The diagnostic accuracy, sensitivity, and specificity of each index was calculated. P-values < 0.05 were considered to be statistically significant.
Results
Patient characteristics
A total of 39 patients with renal tumors were retrospectively analyzed, of which 15 patients with QoF < 75% for VueBoxtrademark analyses were excluded, and the remaining 24 patients were included in the analyses. Among the patients included in this study, 7 and 17 had benign and malignant tumors, respectively, confirmed by pathological analyses, CT, enhanced CT, or MRI, with a follow-up time of more than 1 year (Table 1).
Histological types of renal tumors
Histological types of renal tumors
Among of them, 7/24 tumors showed a solid echo and 17/24 tumors showed a solid-cystic echo, the cystic and solid tumors were mainly composed of solid components. They were divided into benign and malignant groups, respectively. The benign group included 4 female and 3 male patients with a mean age of 60. 42±4.57years(range, 54– 66years), while the malignant group included 3 female and 14 male patients with a mean age of 58.82±10.40 years (range, 42– 73years). The maximum diameter of tumors in the benign and malignant groups was 2.63 cm (2.14– 4.63 cm) and 3.98 cm (2.68– 5.85 cm), respectively. The two groups showed no significant differences in age, sex, and maximum tumor diameter (Table 2).
Baseline characteristics of patients
Note: *represents t value, ding73represents Z value,and #represents accurate chisquare test.
The two groups showed significant differences in the enhancement degree (P = 0.017) and the presence of a pseudocapsule (P = 0.009). Most of the malignant tumors showed hyper-enhancement, and the proportion of malignant tumors showed a pseudocapsule was higher than the corresponding proportion in benign tumors. However, the two groups showed no significant differences in the other parameters (Fig. 3, Table 3).
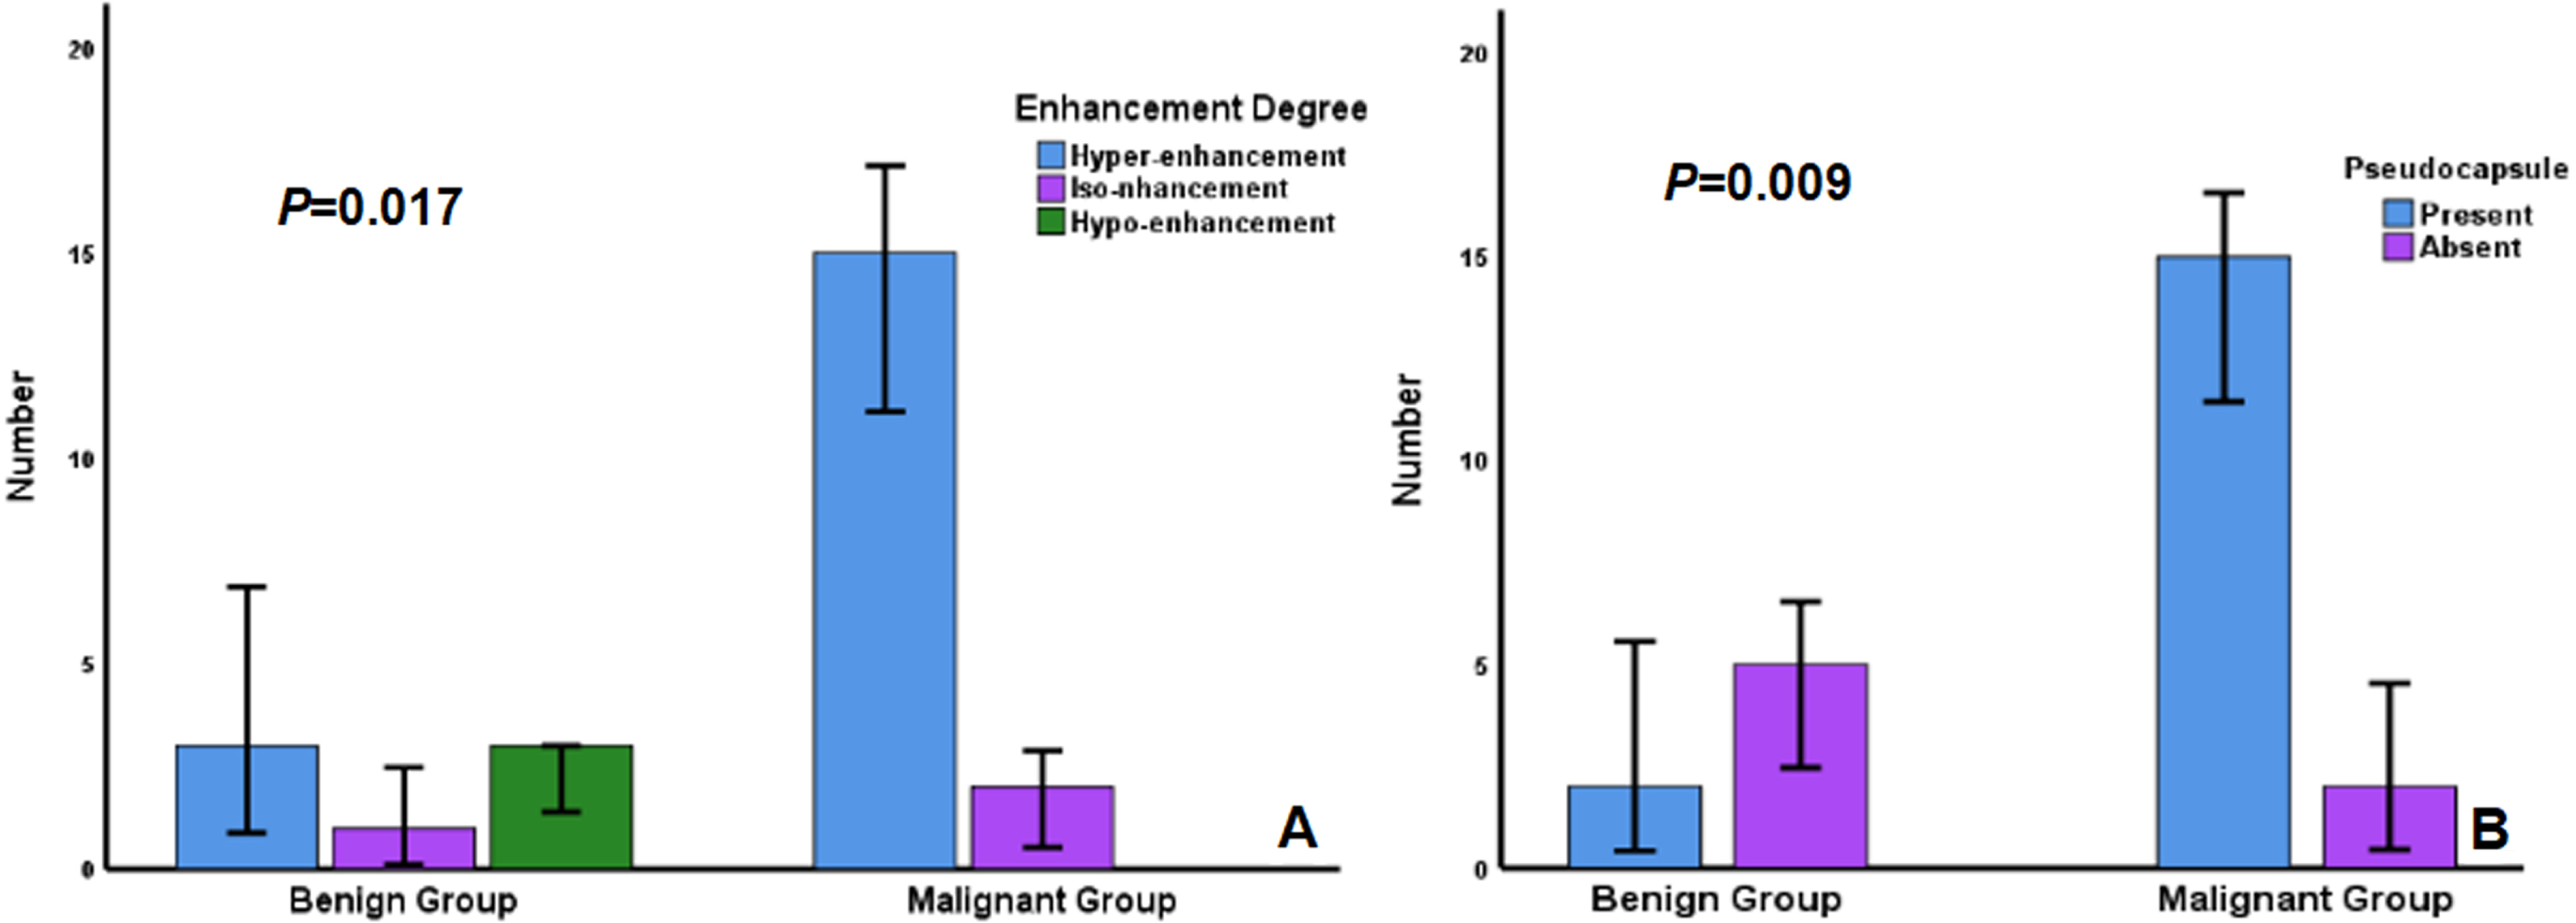
Enhancement mode of renal tumors. Among all enhancement mode parameters, the enhancement degree and a presence of pseudocapsule were significant difference between benign and malignant group(P < 0.05).
Comparison of DCE-US enhancement mode between benign and malignant renal tumors
Note: *represents P < 0.05. All data in the above table are subject to accurate chi square test and no analysis was performed because the proportion of enhancement mode was identical between the two groups.
The two groups showed significant differences in the VueBoxtrademark parameters FT and RT; the RT (P = 0.045) and FT (P = 0.039) of malignant tumors were higher. The two groups showed no significant differences in another parameters (Fig. 4, Table 4).
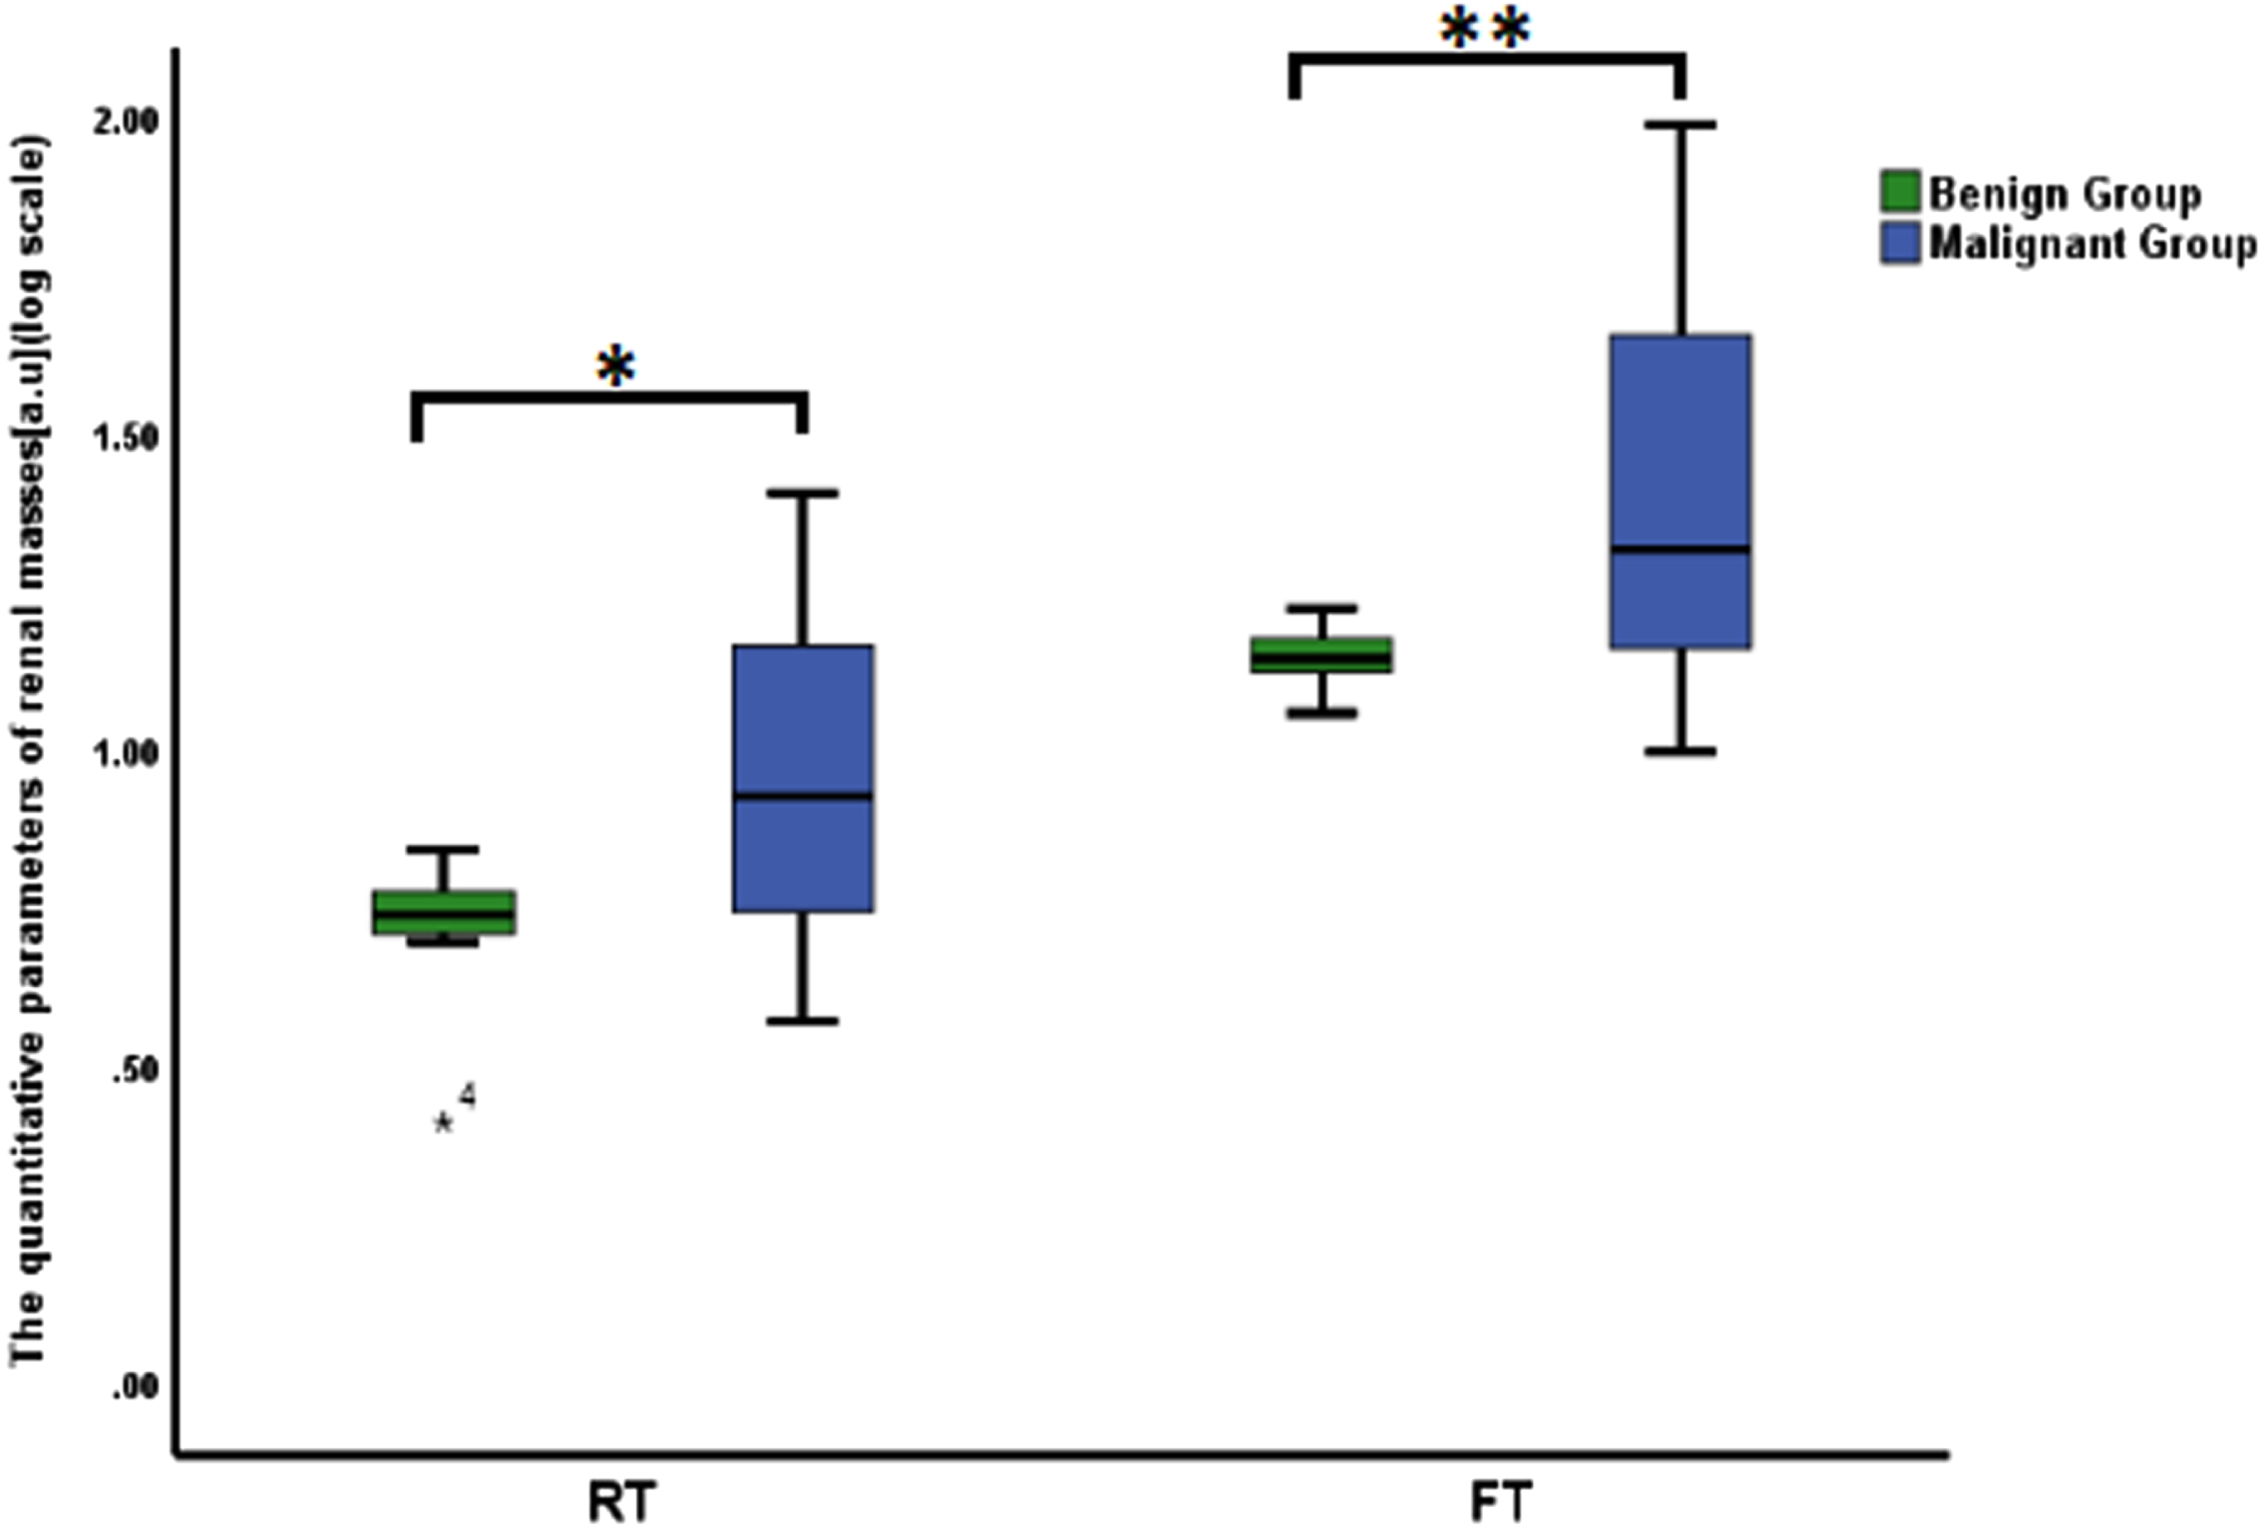
VueBoxTM parameters of renal tumors. Among all VueBoxTM parameters, the RT and FT were higher in malignant group than in benign group (*represent s P = 0.045, **represents P = 0.039).
Comparison of VueBoxTM parameters between benign and malignant renal tumors
Note: *represents P < 0.05.
We performed ROC analyses to evaluate the effectiveness of DCE-US parameters in diagnosing renal tumors. The results showed that a combination of enhancement degree and the presence of a pseudocapsule had higher diagnostic efficacy (AUC = 0.815) than either parameter alone. Similarly, a combination of the VueBoxtrademark parameters RT and FT showed better diagnostic efficacy (AUC = 0.798) than either parameter alone.
Finally, we evaluated the effectiveness of a combination of enhancement-mode (enhancement degree and the presence of a pseudocapsule) and VueBoxtrademark parameters(RT and FT) in distinguishing benign and malignant tumors, and we found that the combined parameter had the largest diagnostic efficacy (AUC = 0.916) with relatively high accuracy (87.50%), sensitivity (76.50%), and specificity (85.70%) (Fig. 5, Table 5).
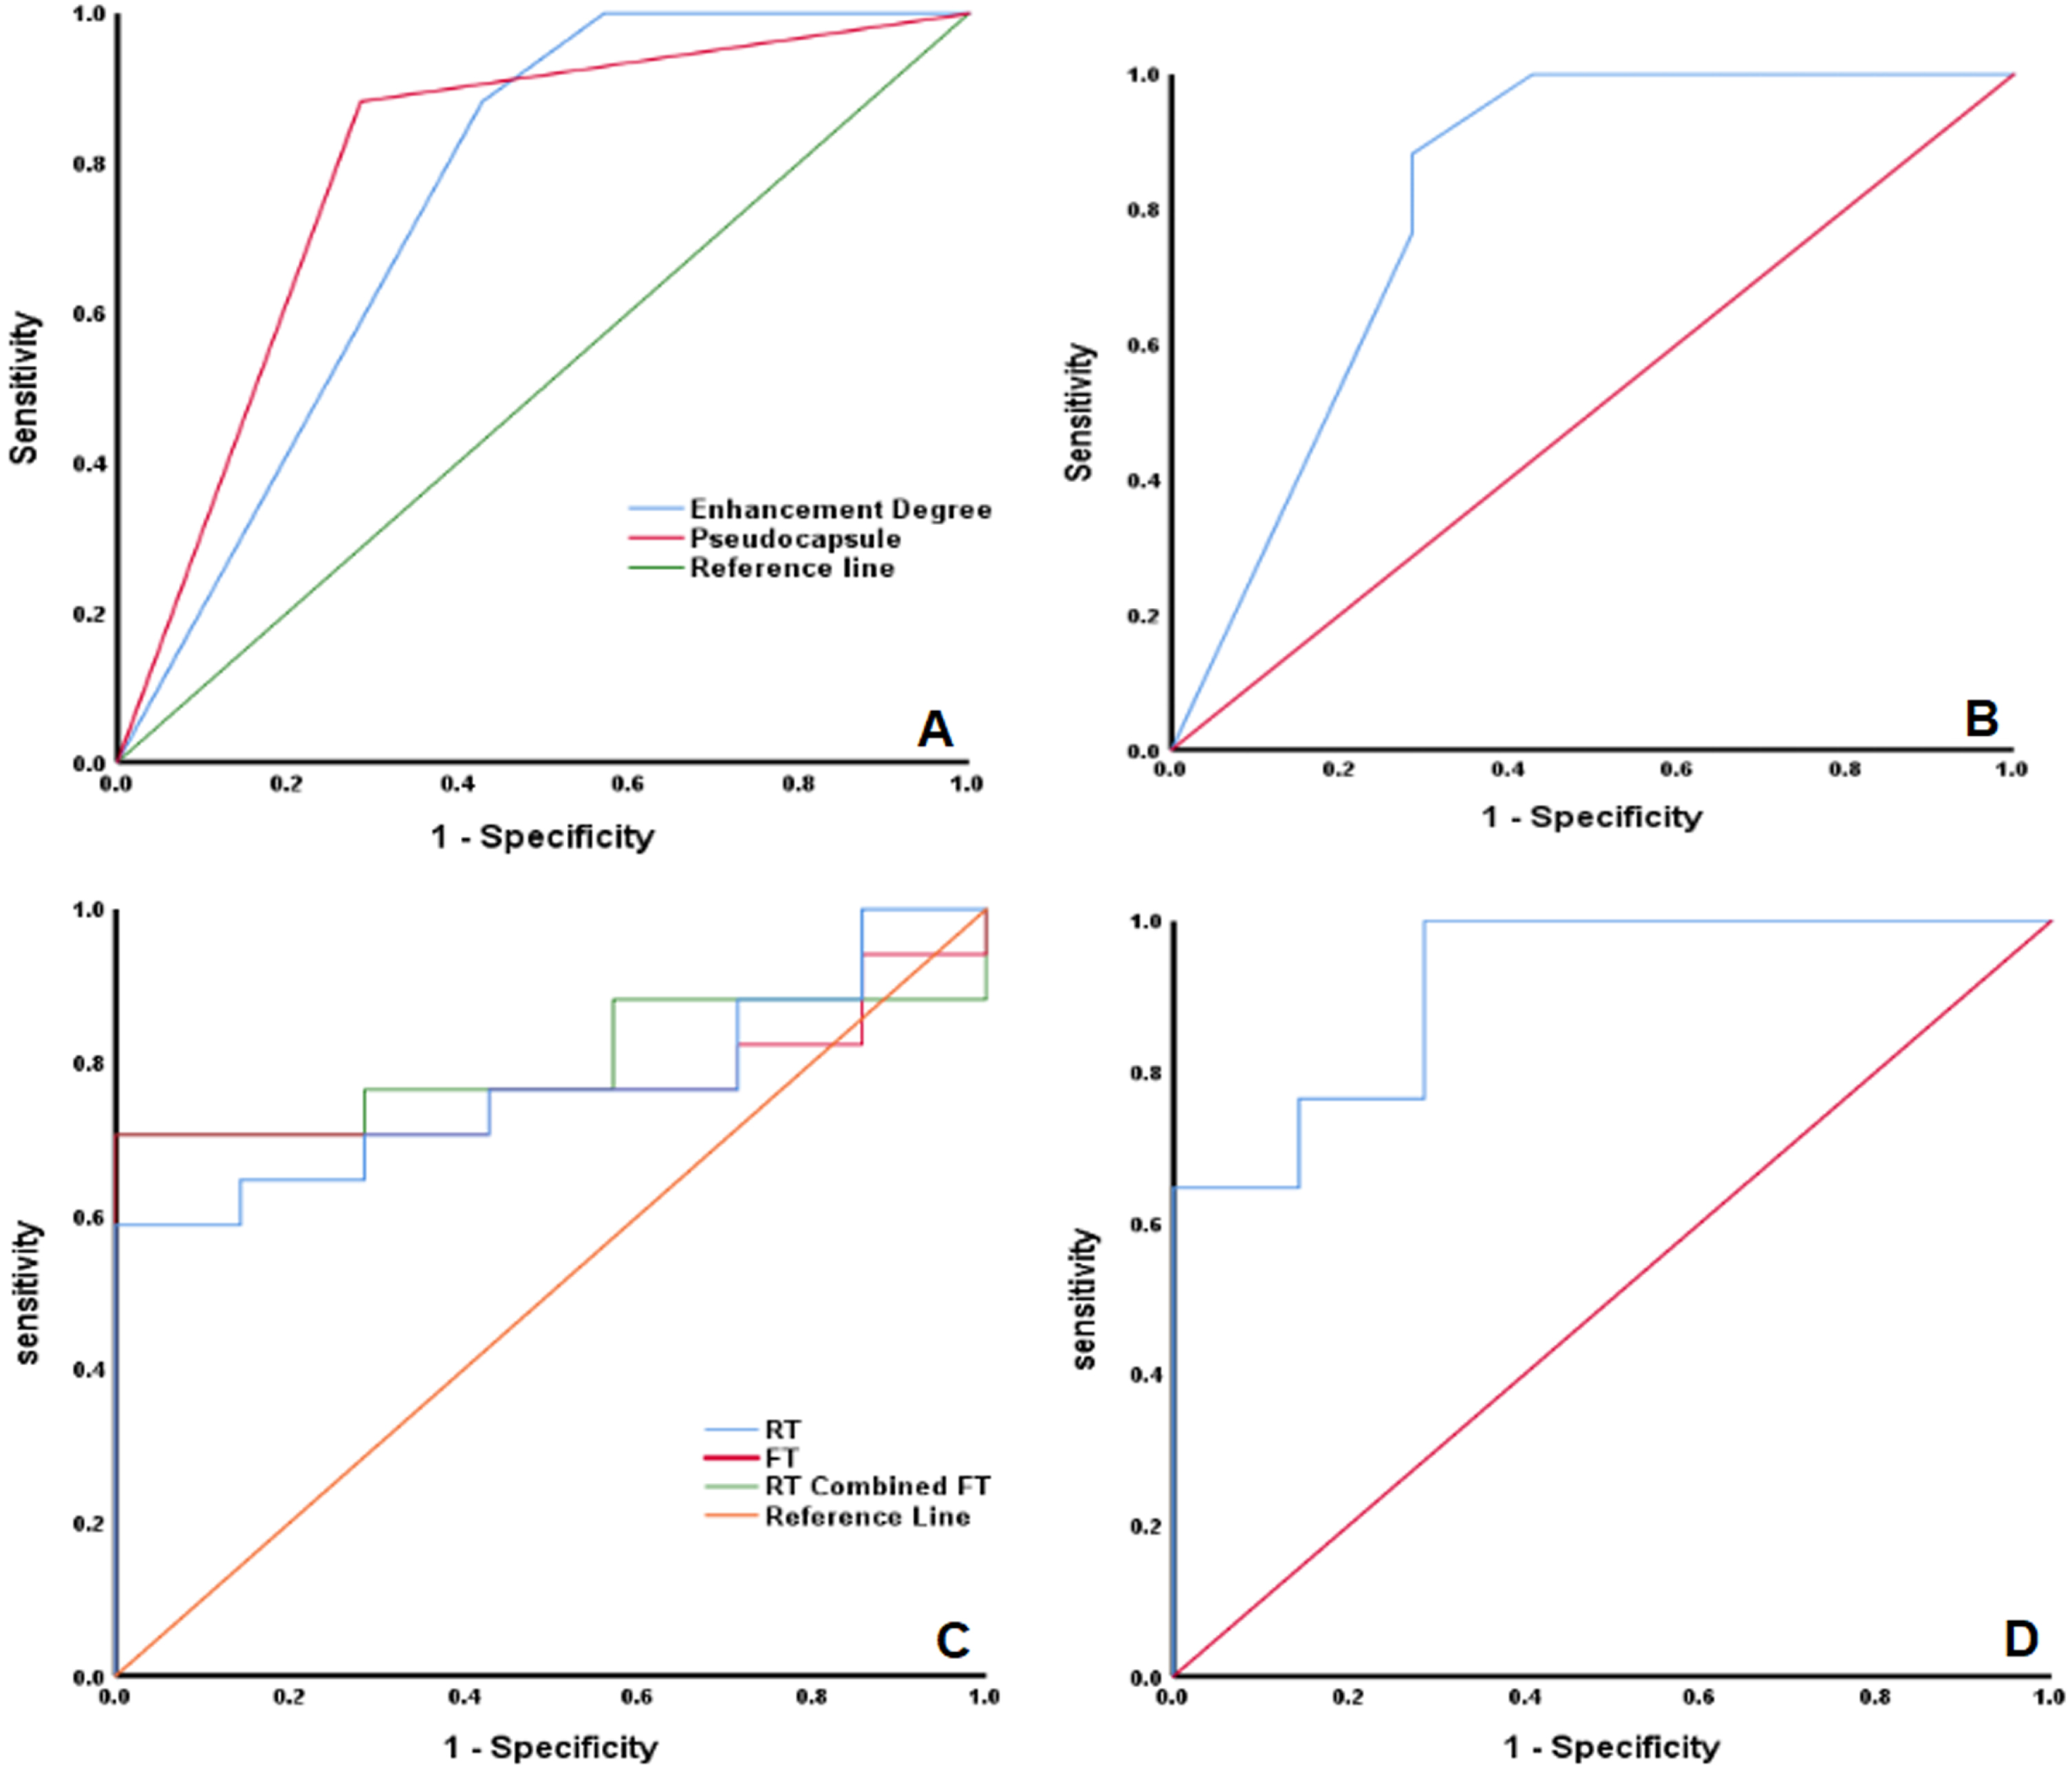
ROC analyses for the diagnostic performance of DCE-US parameters.
ROC analysis of DCE-US parameters in diagnosis of malignant renal tumors
The 2017 EFSUMB guidelines for the Clinical Practice of DCE-US in Non-Hepatic Applications recommend the use of microbubble contrast agents in DCE-US to characterize indeterminate renal tumors, and this approach has been proven to have high accuracy [20–22]. However, most DCE-US analyses are limited to qualitative assessments, and many scholars have proposed quantitative analyses of DCE-US enhancement features to evaluate the nature of renal tumors. However, these analyses were restricted to the use of the integrated perfusion software to analyze the TIC on high-end ultrasound machines, because the storage capacity was mostly limited to CINE cycles that last up to 1 min and the analyses cannot be performed by multiple users or offline [23]. Moreover, analyses of the parameters by different instruments will cause unavoidable measurement errors. VueBoxtrademark is a new offline application for quantitative analysis of DCE-US enhancement features. In comparison with traditional analysis software, it can analyze the DCE-US parameters from different instruments, thereby avoiding measurement errors, and it includes other features such as the ability to perform analyses over longer DICOM cycles when some lesions need to be observed from the early arterial (5– 10 seconds) to the late venous phase (5 minutes), fully automatic in-plane motion compensation, and an easy-to-use clip editor. In addition to standard parameters like PE and TTP, contrast media kinetics like wash-in and wash-out dynamics can also be calculated by VueBoxtrademark. These quantitative parameters can be used for evaluation of neoangiogenesis, microvascularization, necrosis, and treatment effects in lesions [14, 24– 26].
The DCE-US characteristics of renal tumors depend on their pathological features, especially the number and morphology of blood vessels. The formation of renal carcinoma involves multiple genes and factors, among which the mutation or loss of the Von Hippel-Lindau (VHL) gene is closely related to the formation of neovascularization [27]. When the VHL gene is mutated or lost, the expression of its encoded pVHL protein is reduced and the E3 ubiquitin ligase protein complex is reduced, thus causing abnormal accumulation of hypoxia inducible factor-α in human body, and increasing the expression of a series of downstream angiogenic factors that include vascular endothelial growth factor, glucose transporter 1, and platelet-derived growth factor, eventually resulting in a significant increase in neovascularization [28].
In our study, most malignant tumors showed a high degree of enhancement, consistent with the results reported by Xue et al. [29]. This finding can be primarily attributed to the large number of thin-walled new vessels with incomplete basement membrane in tumors. These new vessels are thicker and arranged in a more disorderly manner than normal vessels, leading to contrast agent accumulation in the tumor and hyper-enhancement in comparison with the surrounding normal renal tissue. Pseudocapsule reflects the dense capillary network in the fibrous tissue between the tumor and the compressed renal tissue, which has been reported to be a unique sign of ccRCC, and the pseudocapsule incidence rate is inversely proportional to the World Health Organization/International Conference on Uropathy (WHO/ISUP) grade of ccRCC [30]. In our study, most renal malignancies were grade I and II ccRCCs (13/15), and the presence rate of pseudocapsule in malignant tumors was also higher. We deduced that the higher the tumor grade, the more aggressive the tumor, and the higher the possibility of breaking through the pseudocapsule and invading surrounding tissue, leading to inability in identifying the pseudocapsule.
In most previous studies, the typical renal cell carcinoma (RCC) showed fast wash-in and fast wash-out on DCE-US images, which is related to the formation of a large number of new blood vessels and arteriovenous fistulas in renal tumors [31]. In contrast, in our study, although the difference in RT and FT between the benign and malignant groups was statistically significant, the value in the malignant group was significantly higher. The results may be related to its pathological basis and the small number of enrolled patients. As the tumor increases in size, the demand for nutrients increases and at RCC diameters≥4 cm, the increase in the number and density of new blood vessels inside the tumor cannot meet the excess nutrient demand, resulting in tumor ischemia, necrosis, and liquefaction [32]. Among the tumors in the present study, 13/17 malignant tumors showed a solid-cystic echo and the maximum diameter of 8/17 malignant tumors was≥4 cm, suggesting that these tumors may have undergone ischemia, necrosis, or liquefaction, resulting in uneven distribution of the contrast agent. However, we calculated the average value of contrast agent distribution, which may have resulted in differences from the results of previous studies.
DCE-US may improve the diagnostic confidence for renal carcinoma by providing abundant information regarding tumor vasculature and the blood supply [24, 33]. Our study suggested that the degree of enhancement, presence of a pseudocapsule, and a combination of these features could serve as potential predictors for renal malignant tumors. However, the combination of indicators did not significantly improve the diagnostic sensitivity and specificity. Similar results were obtained for the VueBoxtrademark parameters, indicating the limitations of evaluating benign and malignant renal tumors solely on the basis of qualitative or quantitative analysis. Finally, we found that the area under the curve of the comprehensive index was the largest, and that the comprehensive index also showed relatively higher accuracy, sensitivity, and specificity. These results confirmed that a combination of enhancement mode with VueBoxtrademark can facilitate better evaluation of renal tumors. These data can serve as the basis for future studies, including comparisons of different imaging modalities (DCE-US, CT, and MRI).
Our study had several limitations. First, only a small number of patients with renal tumors were included in this study, which may have influenced the results. Second, renal tumors with different physical properties, such as cystic, solid, and cystic-solid tumors, may show different DCE-US features. However, these aspects could not be evaluated in the present study due to the limited number of samples. Finally, we did not analyze the optimal diagnostic threshold in our study. We will increase the sample size to ensure the reliability of results in future studies and further analyses according to tumor’ physical properties would be carried to provide more information for differentiating benign from malignant renal tumors.
Conclusion
In conclusion, DCE-US with an enhancement mode and quantitative analysis can facilitate preoperative differential diagnosis of benign and malignant renal tumors, and the comprehensive index showed the best diagnostic value.
Abbreviations
Angiomyolipoma
Area under the curve
Computed tomography
Clear cell renal cell carcinoma
Dynamic contrast- enhanced ultrasound
Fall time
Interquartile range
Magnetic resonance imaging
Mean transit time local
Peak enhancement
Quality of fit
Renal cell carcinoma
Receiver operating characteristic
Region of interest
Rise time
Standard deviation
Time-intensity curve
Time to peak
Ultrasound
Von Hippel-Lindau
Wash-in area under the curve
Wash-in rate
Wash-in perfusion index
Wash-out rate
Wash-out area under the curve
Wash-in and wash-out area under the curve
Funding
This work was supported by the Tianjin Health and Health Committee and funded by Tianjin Key Medical Discipline (Specialty) Construction Project (Grant Nos. MS20017 and TJYXZDXK-074 C).
Conflicts of interest
The authors declare that they have no conflicts of interest to disclose.
Author contributions
(I) Conception and design:Y Kan; (II) Administrative support: J Ding, X Jing; (III) Provision of study materials or patients: N Li, Y Liu, Y Kan; (IV) Collection and assembly of data: P Han, Z Hu, Y Kan; (V) Data analysis and interpretation: N Li, Z Hu, Y Kan; (VI) Manuscript writing: All authors; (VII) Final approval of manuscript: All authors. The work reported in the paper has been performed by the authors, unless clearly specified in the text.
Ethics Statement
The authors declare that ethical approval has been acquired from the Research Ethics Committee of The Third Central Hospital of Tianjin (No.IRB2022-004-02) and North China University of Science and Technology Affiliated Hospital (No.20230109028) for this retrospective analysis. All necessary informed consent required by applicable law has also been acquired from relevant patients.