
Abstract
Clustering is one of the most important tools in data mining and knowledge discovery from data. In recent years, semi-supervised clustering, that integrates side information (seeds or constraints) in the clustering process, has been known as a good strategy to boost clustering results. In this article, a new semi-supervised graph based clustering (SSGC) is presented. Using a graph of the k-nearest neighbors and a measure of local density for the similarity between vertex, SSGC integrates the seeds in the process of building clusters and hence can improve the quality of clustering. More over, SSGC can deal with noise, differential density of data, and uses only one parameter (i.e. the number of nearest neighbors). Experiments conducted on real data sets from UCI show that our method can produce good clustering results compared with the related techniques such as semi-supervised density based clustering (SSDBSCAN). Moreover, the computational cost of SSGC is much less than that of SSDBSCAN.
Introduction
Clustering is an important task in the process of knowledge discovery in data mining [1, 2, 3]. In the past ten years, the problem of clustering with side information (known as semi-supervised clustering) has become an active research direction in machine learning community [4, 5, 6, 7, 8]. In general, semi-supervised clustering methods integrate a small set of side information (e.g. seeds or constraints) to boost the quality of clustering. There are two kinds of semi-supervised clustering: constraint based clustering and seed based clustering. In constraint based clustering, the most common form of constraints used are: must-link (ML) and cannot-link (CL) constraints [4].
The motivation of our work focuses on the following open question: How can we integrate seeds efficiently in graph based clustering? Some works have been already proposed in the literature to handle this question such as seed-based K-Means (SSKM)[9], seed based Fuzzy-CMeans (SSFCM)[10], seed based hierarchical clustering (HISSCLU) [11], and seed based Density-Based Clustering (SSDBSCAN) [12]. SSKM and SSFCM have demonstrated the advantages in improving the result of clustering but these methods are specifically dedicated to limits for the clusters with spherical forms. The HISSCLU and SSDBSCAN are efficient for discovering clusters with different sizes and shapes. However, their computation time are quite costly.
To overcome the shortcomings aforementioned, we introduce a new semi-supervised clustering so called Semi-Supervised Graph based Clustering (SSGC). To the best of our knowledge, this is the first seed based graph clustering algorithm. The main advantage of our algorithm is the clustering process does not depend on the density of data set and can easily detect the noise by using the k-nearest-neighbor graph and a measure of the similarity among vertex based on local density of data.
Our algorithm uses only one parameter – the nearest neighbor k and for each data set, it exists a long interval to choose a suitable value for
The rest of the paper is organized as follow: Section 2 discusses related work. Section 3 presents our new semi-supervised graph based clustering. Section 4 describes the experiments that have been conducted on benchmark data sets from UCI. Finally, Section 5 concludes the paper and discusses several lines of future researches.
Related work
Seed-based DBSCAN
The seed-based DBSCAN extends the original DBSCAN algorithm with a small set of labeled data to enable the discovery of clusters with distinct densities.
According to [11], the notion of density is formalized by two parameters: MinPts specifies a minimum number of objects, and
The objective of SSDBSCAN is to overcome this limit by using seeds to compute an adapted radius
The rDist(p,q) measure indicates the smallest radius value
where
Then, given a set of seeds
The seed based K-Means algorithm has been proposed by [9]. This method uses a small set of labeled data, the seeds, to help the clustering of the unlabeled data. Two variants of semi-supervised K-Means clustering are introduced: Seed K-Means and Constraint K-Means. In both methods, the seeds are supposed to be representative of all the clusters. In Seed K-Means, the labeled data is used to compute an initial center for each cluster. Then a traditional K-Means is applied on the dataset without any further use of the labeled data, while in Constraint K-Means the information is used as constraints so that the labeled data can not be removed from the cluster they have been affected by the user. The seed based K-Means is presented in the Algorithm 2.2. The limit of SSKM is also like the traditional K-Means, it is only work well with the cluster with the spherical form.
[ht!] Seed K-Means[1] Data set
Seed based Fuzzy C-Means
The seed based Fuzzy C-Means algorithm proposed in [10]. Like Seed K-Means, this method uses a small set of seeds to improve clustering performance of image segmentation problem. Moreover, this algorithm overcomes three drawbacks of the original Fuzzy C-Means clustering which include (1) choosing number of cluster during initialization, (2) assigning physical labels to the classes at termination, and (3) least objective functional squares try to equalize cluster populations. The seed based Fuzzy C-Means is presented in the Algorithms 2.3.
[ht!] Seed Fuzzy C-Means[1] Data set
Note that, if
HISSCLU method
In [11], the HISSCLU, a hierarchical density-based clustering algorithm relied on OPTICS, is proposed. HISSCLU includes two stages. At the first stage, given a set of labeled objects, HISSCLU starts the OPTICS expansion simultaneously from all the labeled objects and generates as many reachability-plots as the number of labeled objects, each one representing a cluster; during the label expansion they use a method to change the distance between points that resembles the distance learning [12]. The reachability-plots are reordered and concatenated with each other to produce one single plot. In the second stage, a cut at level
It is important to notice that HISSCLU is not able to extract the natural cluster structure from a data set if the plot generated in the first stage of the algorithm represents a distribution where the density varies widely between clusters, as it also uses only one single cut. As for DBSCAN, defining the value of a single cut corresponding to a single density level is difficult and requires the user often to perform a trial and error process, which makes the algorithm unsuitable for an automatic KDD process.
Proposed approach
This section proposes SSGC method which is the semi-supervised clustering based on graph. We first present briefly the concept of traditional k-nearest neighbors graph and then our SSGC approach.
The k-nearest neighbors graph
In this research, we use the graph which is presented in [13, 14]. We define the
where NN(.) denotes the set of
Based on the k-NN graph which is defined in the previous section. We develop a new semi-supervised graph based clustering, called SSGC for short. The SSGC algorithm is designed with 2 steps:
To do this, a threshold After finding the connected components, all points of each component that have at least one seed will be propagated by the label of seeds presenting in its component. This step produces main clusters.
In the first case, points are assigned to main clusters with the largest weight related. This process is similar to the mechanism of expansion of “Minimum Spanning Tree (MST)” in SSDBSCAN algorithm [12]. For the isolated points in the second case, two choices are possible that depends on the purposes users: either remove them as the noise or label them. In the last case, we can apply the clustering method based on k-nearest neighbors: the label of an isolated point will be labeled by the majority in its label set of
SSGC is presented in Algorithm 3.2. We note that the threshold
SSGC Algorithm[1] Data set
The complexity of the construction phase of k-NN graph is
Data sets
We use 8 well-known real datasets from the Machine Learning Repository [17] namely: Iris, Soybean, Ecoli, Zoo, Protein, Thyroid, Haberman, and Yeast to evaluate our algorithm. The details of the data sets are shown in Table 1. These datasets have been chosen because they facilitate the reproducibility of the experiments and some of them have already been used in semi-supervised clustering articles.
Main characteristics of the real datasets
Main characteristics of the real datasets
Result comparison between 4 semi-supervised clustering algorithms.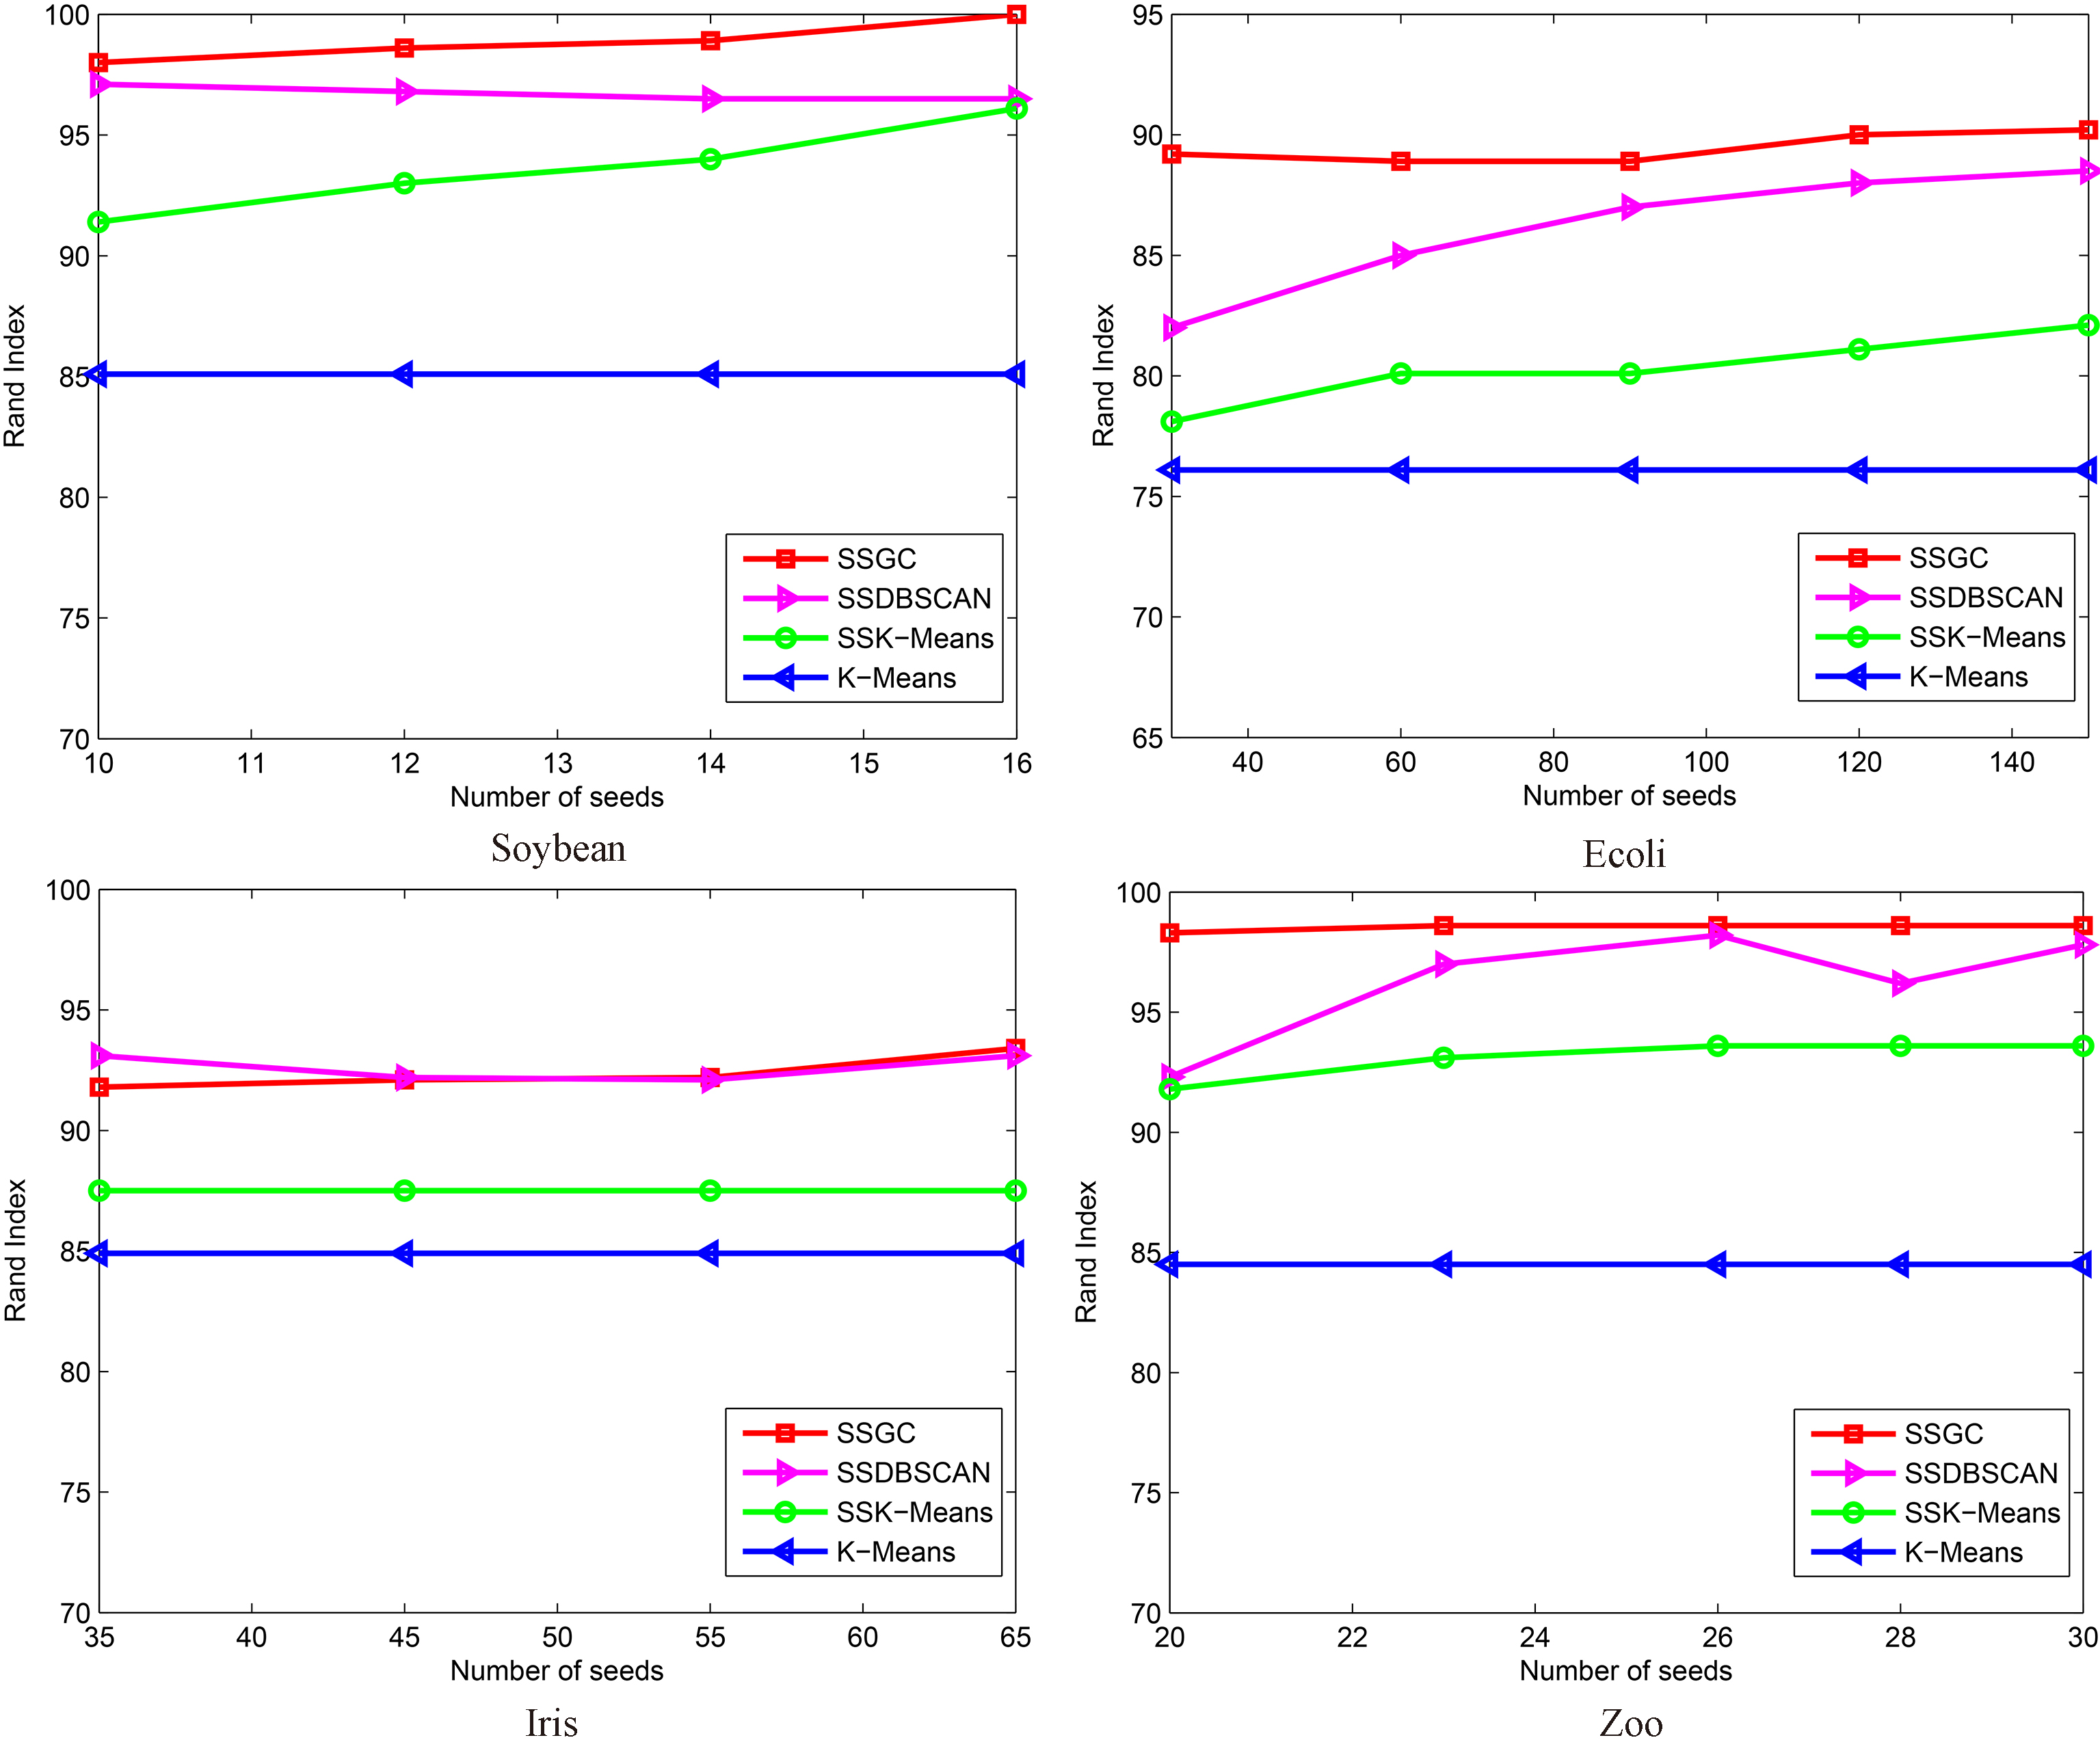
The data set used for the evaluation includes a correct answer or label for each data point. We use the labels in a post-processing step to evaluate the performance of our approach.
We use the Rand Index (RI) measure [15], as it is widely used in evaluation of clustering results.
Comparison of 4 semi-supervised clustering algorithms.
The RI measure computes the agreement between the theoretical partition of each dataset and the output partition of evaluated algorithms. This measure is based on
Let us consider two partitions
RI takes values between 0 and 1; RI
To evaluate the effectiveness of our algorithm SSGC, we compare SSGC with the SSDBSCAN and Semi-supervised K-Means clustering (SSKM). Additionally, we show the results obtained by K-Means clustering as the base line reference. We also compare the computation time between algorithm SSGC and the algorithm SSDBSCAN because its works with the same kind of clusters (difference size and shape).
The seeds for all the semi-supervised methods are randomly chosen in each time of running. The results are averaged over 20 runs.
The quality of clustering
Figures 1 and 2 show the results obtained by four algorithms. It can be observed from these figures that our method generally performs better or at least comparable with SSDBSCAN. This can be explained by the fact that the representation of data through a graph is very appropriate and natural.
With the Protein data set, the SSKM obtains the best result. It can be explain that, Protein has 6 clusters with 115 objects in total. So, both SSGC and SSDBSCAN make the faults in the propagation process.
With the Yeast data set, especially, SSKM and K-Means give the better result than SSGC and SSDBSCAN. It can be explained in [11], this data set is highly unbalances (5 to 423 objects per cluster), the reach-ability plot shows that no cluster structure at all, overlapping clusters, so SSGC and SSDBSCAN are not easy to deal with.
With the 3D-Haberman data set including 2 clusters, both K-Means and SSKM obtained only 50 percent, we can easily see that, in this data set, two clusters are highly overlap (see Fig. 3). However, the results can improve 10% of Rand Index with a small set of seeds with SSGC and SSDBSCAN because of the divide and conquer strategy in the process of finding clustering of SSGC and SSDBSCAN.
Haberman data set visualisation.
Running time comparison between SSGC and SSDBSCAN.
Observing parameter for 
One important aspect that we want to point out here is the computation time of SSGC and SSDBSCAN. We compare SSGC and SSDBSCAN because they have the same kind of clustering (i.e. it can find clusters of different sizes, shapes, and densities in noisy).
With the same condition (computer, data set, number of seed), Fig. 4 shows that the computation time of the algorithm SSGC are very low in comparison with the the running time of SSDBSCAN. In general, the algorithm SSGC is about 20 times faster than SSDBSCAN.
This can be explained in theoretical that the complexity of the algorithm SSDBSCAN is
Parameter setting
Our algorithm has only one parameter k that is the number of nearest neighbors. As illustrated Fig. 5, for all
Conclusion
In this paper, a new semi-supervised graph based clustering algorithm is proposed. To the best of our knowledge, this is the first seed based graph clustering. By using the common nearest neighbor to determine the similarity among objects, the algorithm can be effective for the problem of detecting clusters of arbitrary shape and different density. Moreover, the computation time is significantly lower than SSDBSCAN, which makes our method suitable for real KDD applications.
In future works, we will continue to develop new semi-supervised clustering algorithms and apply for real applications in KDD such as facial expression recognition, web usage mining, and so on. Finally, the finding number of nearest neighbor will also be an attractive task after the paper of [16].
Footnotes
Acknowledgments
This research is funded by Vietnam National University, Hanoi (VNU) under project number QG.18.40.