



Abstract
One of the first stages during the evaluation of the viability of an Energy Saving Devices (ESDs) for existing ships is a global scan of the field of application, performance and the required investment. Based on this preliminary data the Return on Investment (RoI) for an ESD retrofit can be estimated, which is a key figure in decision making processes. To this end an Early Assessment Tool (EAT) is developed, containing a database of reliable performance data, a patent database, a benefit tool, cost model and an economical tool.
The EAT is compatible with container vessels, bulk carriers, tankers, ferries/RoPax vessels and short sea shipping cargo vessels. Integrated ESDs are the pre duct, pre swirl stator, PBCF, rudder fin, rudder bulb-hub cap system, ducts surrounding the propeller, hull fin and the combination of a pre duct and pre swirl stator.
The benefit tool calculates the power reduction at a given sailing mode by application of a specific ESD type. The cost tool determines approximate ESD costs, broken down into design, material and installation costs. The economical tool combines output from the benefit and cost tools and calculates the RoI.
A web-based EAT for public use and an extensive EAT for project members have been created.
Keywords
List of Symbols
Specific CO2 emission per nautical mile Fuel conversion factor ( Constant depending on the ship type Main engine’s Nominal Continuous Rating Power requirement of the vessel Main engine’s Specific Fuel Oil Consumption Vessel speed Vessel speed at NCR power Displacement of the ship
Background
One of the first stages during the evaluation of the viability of any improvement measure is a global scan of the field of application, performance and the required investment. Based on this preliminary data for instance the Return on Investment (RoI) can be estimated, which is one of the key figures in the decision-making process.
Energy Saving Devices (ESDs) have been applied for quite some time now with varying success. The field of application is often not made clear by the manufacturer, which makes it difficult for a ship owner to select the best ESD for retrofitting a particular vessel. Therefore, a pre-selection has been made to limit the number of ESDs and ship types.
Reliable performance data on these devices was not readily available. Literature, reports and presentations from research institutes, advisory councils, design companies and manufacturers have been collected to overcome this problem.
Both fuel savings and emissions reduction can be the goal of retrofitting a vessel with an ESD. In order to assess the viability, the Early Assessment Tool (EAT) has been created which estimates the fuel savings and ESD cost. The cost estimates are not only based on the product/material costs but also account for design and installation costs. Finally, the ESD benefit can be assessed based on the RoI.
Objectives
The objectives within the first part of the project were the following:
Define the framework of vessel types and ESDs to be considered and define reference cases; Set up a database of reliable performance data of ESDs; Develop a tool for calculating the reduction in power requirement with ESDs in an early stage based on both empirical and theoretical data; Develop a parametric cost model for the estimation of Return on Investment (RoI) in cooperation with ship yards and operators; Develop and implement an Early Assessment Tool (EAT): A web-based tool for public use; A project member tool for more in-depth calculations in an early stage.
Methods
In this section, the methodologies which have been used to generate results are presented. The section hereafter shows the actual results.
Define framework of vessel types and ESDs to be considered
In order to structure the investigation regarding ESDs, they are divided into eight groups: hull fins/spoilers, pre swirl stators, pre ducts, ducts surrounding the propeller, contra rotating devices, hub cap-rudder bulb systems, post swirl stators and the so-called ‘combined systems’ which are combinations of ESD types.
The combined systems group specifically comprises of PBCF, Grim Wheel and the combination of an upstream duct and a pre swirl stator. An initial estimation of claimed fuel savings was identified based on frequently cited energy savings. Also an overview of the fuel consumption per vessel type and their share within the world fleet is created.
Fuel consumption
The fuel consumption for a given vessel type is estimated via two paths: (1) as a function of displacement and sailing speed and (2) as a function of MCR power and ship speed. Both are based on least squares regression formulae.
The first method is derived from an annual publication by the Royal Institution of Naval Architects called ‘Significant Ships’ which includes displacement and speed information on approximately 50 recently built merchant vessels. The power required to propel the vessel is related to its displacement and speed. The exponents on these values are variables and depend on the type of ship.
Variable k is strongly dependent on the hull form. Hence, for a certain ship type – with similar hull forms – the factor k remains almost constant. An overview of
Typical
and
values for selected ship types
Typical
To calculate annual fuel consumption figures from the required power, a Specific Fuel Oil Consumption of 185 g/kWh has been assumed for the engine which is a suitable average of new and older engines. Also a factor representing the estimated sea time per vessel type has been incorporated in the calculations.
The second method is also empirical in nature but based on the MCR power and the mission profile of the vessel. The mission profile is an estimate of the percentage of time the vessel is sailing and the percentage of MCR power the vessel is sailing on. The duty factor from the mission profile is dependent on ship type.
Also an energy efficiency index is calculated. The IMO has developed some measures to take control of and reduce CO2, NOx and SOx emissions from shipping. One of these measures is the implementation of the Energy Efficiency Design Index (EEDI) for newbuilds and the Energy Efficiency Operating Index (EEOI) for existing ships and vessels in service. Within GRIP, a new index called the Energy Efficiency GRIP Index (EEGI) is developed which is based on EEDI but very much simplified to make it more applicable for quick assessments. The EEGI is based on the EEDI but only takes into account the main engine power at a given vessel speed and the displacement. The impact of auxiliaries is not included in the calculation of EEGI. A Comparison of the main and auxiliary engine contribution to EEDI for a typical container ship, tanker and bulk carrier has shown that auxiliaries are only responsible for less than 10% of EEDI and can thus be neglected for EEGI without having a serious impact on the correctness for comparison.
EEGI is calculated as follows:
Comparison of EEDI and EEGI for a container ship, tanker and bulk carrier has shown that the contribution of the auxiliary engine part to the overall EEDI is typically about 5%. It can thus be concluded that EEGI, which only represents the main engine part of EEDI is a suitable replacement for assessing the propulsion efficiency of a vessel though the outcome will be about 5% lower. EEGI may serve as a tool to select candidate vessels for retrofits.
Cost estimation of ESDs
An initial estimation of ESD costs is split between design, installation and material costs. Since the dimensions of ESDs are typically closely related to the propeller diameter, scaling of ESD costs will be based on propeller diameter. As a rule of thumb, design costs are not scaled with the propeller diameter, the installation costs in a linear way while the material costs are scaled with a power of 2.5. These dependencies were derived from detailed cost information of commercially applied ESDs, made available by industry partners within GRIP.
Final structure of Early Assessment Tool
The final structure of the Early Assessment Tool is shown in Fig. 1. First, a retrofit ESD needs to be selected after which the user would enter information on the vessel and its main operating condition. Once an ESD is selected, the user can choose the run the benefit model, cost model or both. Based on these data, combined with an estimation of the fuel costs, the Economic tool calculates Return on Investment. Alongside, the ESD database is implemented into the software which provides access to reviewed and screened literature on ESDs.
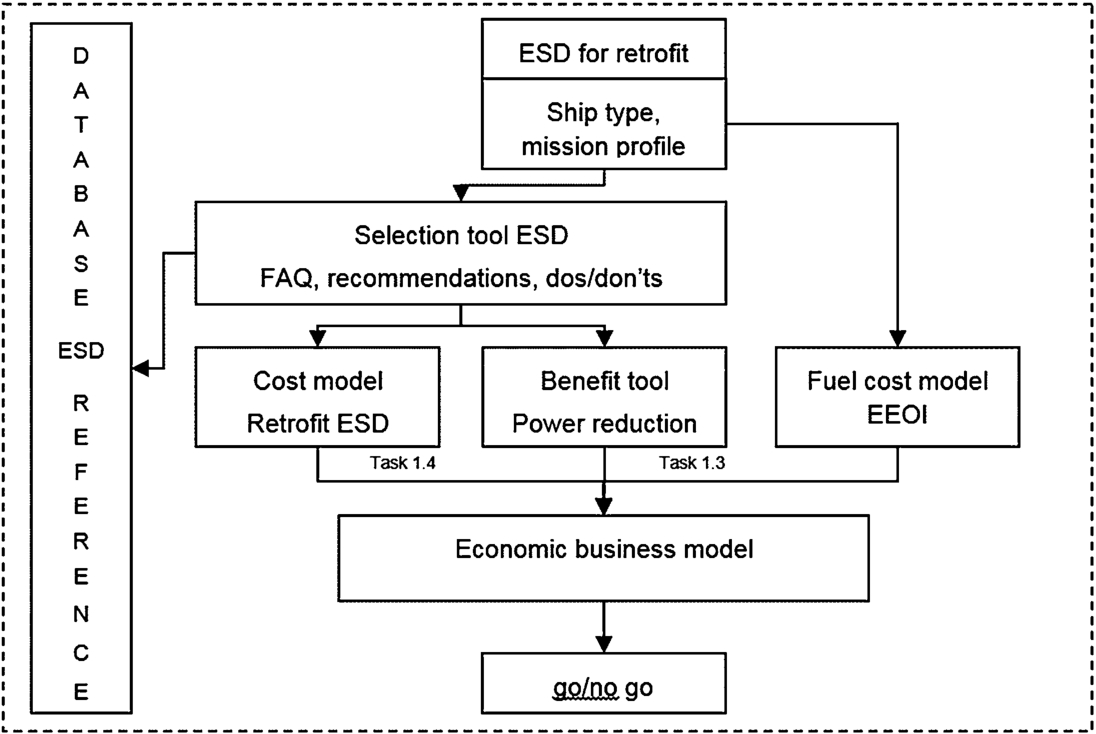
Structure of Early Assessment Tool.
First, a definition of the required database contents is created. Based on this, a reviewing tool is put together by MARIN to easily store the main contents of each reviewed paper. The reviewing tool asks for typical general information such as the title, author and publication date, but also contains input fields for more specific information on the contents of the paper such as the type of ESD, the energy-saving ratio (ESR), a quality designation and the source of the data (e.g. model testing, full scale measurements, CFD etc.). These quality designations are set up as follows:
Journal papers or reports having undergone peer review and uncertainty estimates available Papers from symposia or reports giving detailed information on procedure and results, preferably indicating the uncertainty. Data source: model tests or computations Papers from symposia or reports giving little detail on procedure and results, not indicating uncertainty. Data source: model tests, computations or full scale tests Data from advertisements or advertorials in magazines
Develop a tool for calculating the reduction in power requirement from ESDs
For the benefit tool five different ESD’s were selected to be implemented: pre swirl stators, pre ducts, hub cap- rudder bulb systems, propeller boss caps with fins (PBCFs) and small rudder fins.
Three of these ESDs (Hub cap- rudder bulb, PBCF and the small rudder fins) were combined in one group, the so called propeller hub slip stream recovery devices (PHSSRDs).
For each ESD a separate model is made, except for the pre swirl stator and the pre duct. From the other work packages in the GRIP project it turned out that the working principle of these two ESDs is very similar. Therefore it has been decided to use the same model for both ESDs. The user still has the possibility to select either a pre swirl stator or a pre duct because the costs are different.
Modelling of tool
The benefit tool is built up from different models. This has been visualized in a flow chart, where the different parts of the benefit tool are specified and coupled. In Fig. 2 the flow chart of the benefit tool is shown.
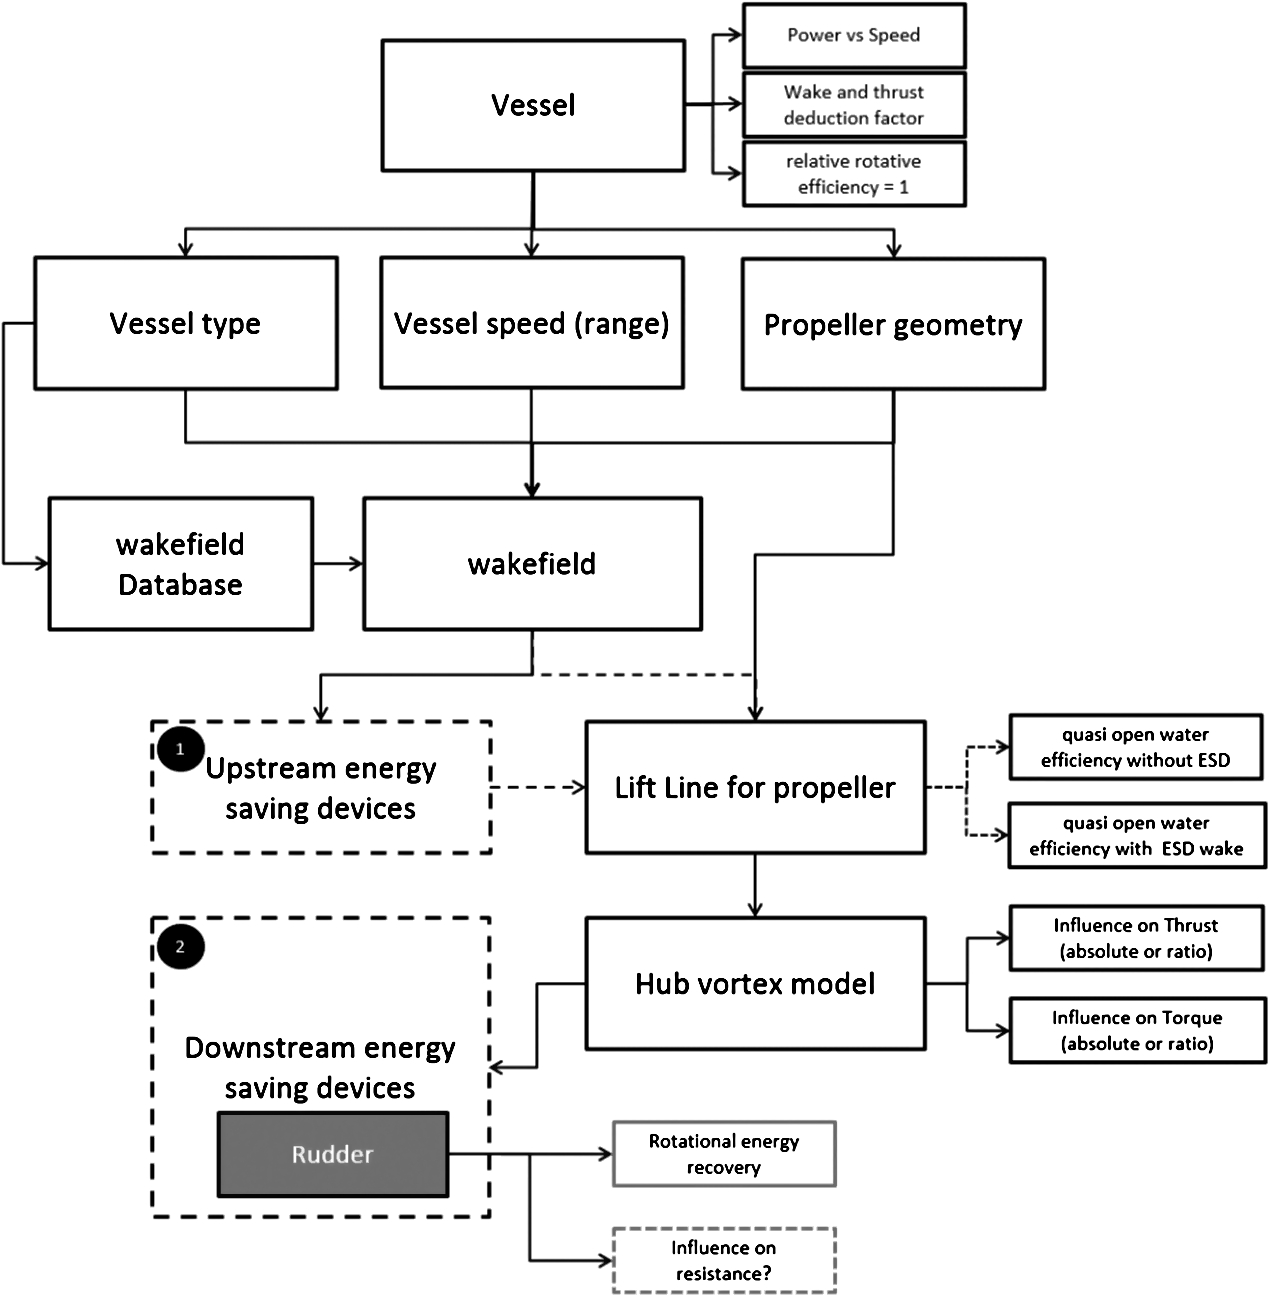
Flow chart of ESD power difference calculation.
Vessel data is given by the user. This vessel data consists of a vessel speed, propeller speed, power, vessel type and propeller geometry. In case the full propeller geometry is not available, a B-series propeller can be used instead. The user also has to select an ESD. Depending on the vessel type, a circumferentially averaged wake field will be selected from the wake field database. This wake field is used in a lifting line model to determine the propeller efficiency according to the given data. The lifting line model is derived from the Liftline software developed and validated within CRS project ECONSHIPS in 2010. This lifting line module is combined with the ESD models to determine the differences in required power with and without ESD. The calculation procedure is visualized in a calculation scheme. This scheme is shown in Fig. 3.
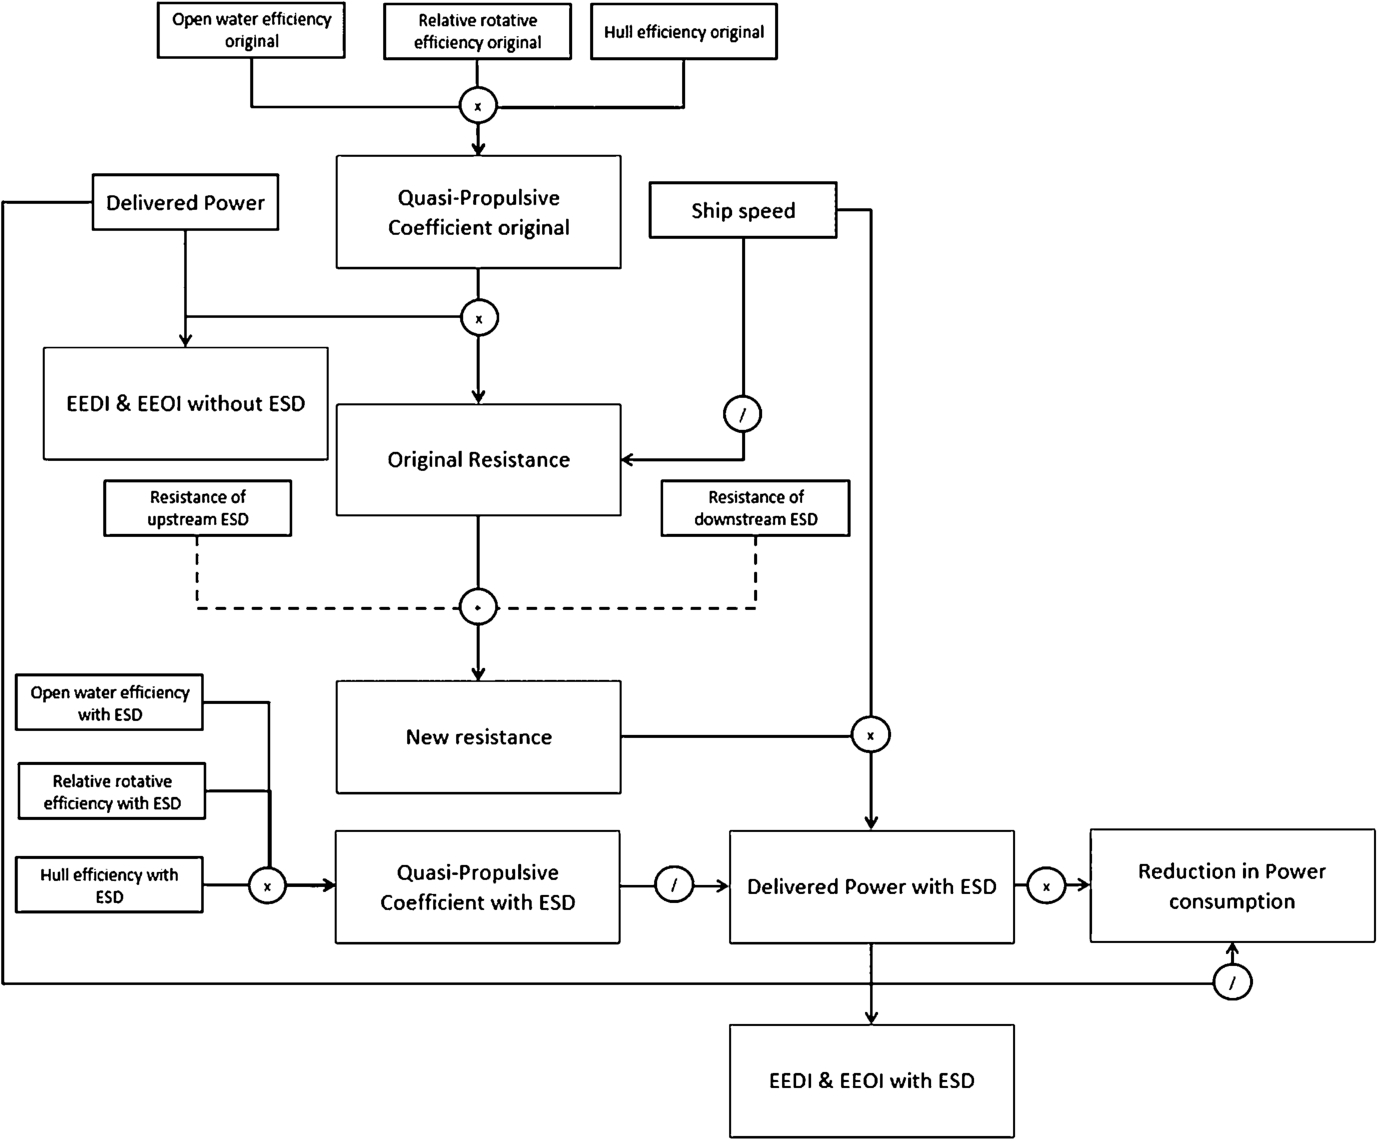
Calculation scheme of benefit tool.
As input for the calculation the ship speed and original delivered power are needed. Based on these values the original resistance is determined, using the calculated propulsive efficiency, which is the product of open water, hull and relative rotative efficiencies. Open water efficiency is taken from the lifting line model. Hull efficiency is derived from user-provided values of effective wake fraction and thrust deduction factor. If these are not supplied by the user of the tool, default values, dependent on ship type, are used instead. Application of an ESD was assumed not to affect the relative rotative efficiency for the purpose of this early assessment. The ship’s resistance, combined with the additional resistance of the ESD, is then again used to calculate the required power for the same vessel with ESD. The difference between the required powers is the power reduction that is expected from the selected ESD.
The internet Early Assessment Tool (iEAT) is the publicly available software product of GRIP. It is developed in MARIN’s workflow framework, named Quaestor. The iEAT uses a Windows machine for running the Quaestor software and an Apache Server for running the GUI and the internet server. The latter triggers the calculation workflow once it receives a request.
Results
Claimed fuel savings, working principle and field of application
An initial estimation of claimed fuel savings was identified based on frequently cited energy savings and is shown in Table 2.
Summary of frequently claimed energy savings
Summary of frequently claimed energy savings
Hull fins seem to lack a clear rationale for its working principle, but do show significant fuel savings in literature. Hull fins might aim on a partial recovery of bilge vortices. These devices are often applied to full blocks ships.
Pre swirl stators give a pre-rotation to the propeller inflow and lead to a direct reduction of rotational losses and can have an indirect effect on the viscous losses. Pre swirl stators can be applied to a wide variety of vessels. Presently, they are mainly fitted to container vessels and bulk carriers. Pre swirl stators seem to suffer from severe structural problems.
Ducts surrounding the propeller are appropriate for vessels with a sailing speed up to approximately 16 knots. When the thrust loading coefficient
Contra rotating devices reduce the rotational losses considerably and indirectly also affect axial and viscous losses. However, huge improvements are needed to justify conversions due to the high complexity and cost of such systems.
Hub cap-rudder bulb systems act in the slipstream of the propeller hub. There seems to be a concentration of losses in the form of the pressure drag from a large hub and swirl losses behind a small hub. Special hub caps, sometimes combined with rudder bulbs, can recover part of these losses.
Post swirl stators aim at recovering the rotational losses in the slipstream of the propeller. Since also the rudder is effectively also a post swirl stator and post swirl stators operate in the accelerated flow from the propeller, their viscous resistance is larger and gains are smaller compared to pre swirl stators.
The PBCF is a combination of a post swirl stator and a hub cap. It eliminates or weakens the hub vortex generated at the inner radii of the propeller. Due to easy installation and negligible interaction with the propeller and/or rudder, the PBCF is an easy to retrofit and popular ESD.
The Grim Wheel was already a popular ESD in the 70’s and 80’s. This device is also known as a vane wheel. It rotates freely in the slip stream of the propeller and has a larger diameter than that of the propeller; the outer parts of the vanes generate thrust. In the past, the bearing system was the practical bottle neck. Applying Grim Wheels as a retrofit seems complicated and expensive: the large additional mass of the wheel needs to be borne by either the propeller shaft or the rudder. In general, this is not feasible without changing the entire shaft or the complete rudder.
The combination of a pre duct and pre swirl stator is mainly suitable for full block vessels with a speed below 18–20 knots such as bulk carriers and tankers. The robustness is seen as a large advantage; the working principle is not fully clear since propeller-duct-hull interactions are rather complex.
The Equasis database, using data from all major classification societies, reflects the current world fleet. The division of the world fleet by ship type in 2010 is shown in Table 3. Table 4 shows the annual fuel consumption of typical examples. By combining the data from Table 3 and Table 4, the distribution of fuel consumption per vessel type was determined. The results from this analysis are shown in Table 5. Container vessels, bulk carriers and oil and chemical tankers are the main fuel consumers.
Division of world fleet per ship type in 2010
Division of world fleet per ship type in 2010
Typical examples of annual fuel consumption
Distribution of fuel consumption per vessel type
In order to select the most promising ESDs for further investigation within the project, cost estimations for typical ESD applications were made. When possible, the cost assessment was based on real life cases to get the most realistic price levels. In some cases, such as the conversion from an open to a ducted propeller, not only the ESD itself needs to be designed, built and installed, but also a new propeller. This in included in the cost estimations. Also in case of other ESDs, application of a new propeller can be beneficial or even recommended. Examples include the pre swirl stator and pre duct which alter the inflow into the propeller disc and thereby have an effect on the power absorption curve of the propeller. In these cases, a remark is shown in the output screen of the EAT.
Return on Investment
From the combination of estimated power reduction and cost of selected ESDs, the RoI is calculated for typical examples. Generally, RoIs are within 1 year for most of the ESDs. When a propeller modification or even a new propeller is needed, the RoI can increase to about
Selection of vessel types and ESDs for further research
The selection of vessel types for further research within GRIP is based on a few criteria:
Vessel type should have a dominant share in the world fleet
Vessel type should have a large fuel consumption
The owners/charterers/yards should be present in the European Union
Based on these criteria the following vessel types are selected:
Container vessels
Bulk carriers
Tankers
Ferries/RoPax vessels
Short Sea Shipping cargo vessels
For the selection of ESDs, the following criteria were considered:
Suitability to selected vessel types
Energy Saving Ratio (ESR) needs to be measureable (
Retrofit budget
Reliable and mature technology
Suitable for retrofitting
Based on above criteria, hull fins are excluded since they’re thought to be unreliable. Claimed fuel gains are doubted for service conditions and varying trims and draughts.
Pre swirl stators are selected though it must be noted that this retrofit is not suitable for all vessels since sufficient space needs to be available in the stern between the aft skeg and the propeller to mount the stator fins. Moreover, the connection needs to be mechanically sound to withstand large fluctuating loads. It is expected that structural issues can be overcome.
Pre ducts are also included since they are easy to install due to their small size and robust because of their circular shape. On a downside, a propeller modification might be required after installation to correct for interaction effects and working principles are not fully understood yet.
Conversions from open to ducted propellers are not included. They can provide one of the highest efficiency gains possible and technology is mature and reliable but limited to propellers smaller than 4.5 m in diameter for cost price reasons. Vessels with such small propellers are outside the scope of GRIP.
Also Contra Rotating Propellers are out of scope: they’re extremely expensive to retrofit with budget prices at least 10 times higher than for other ESDs.
Hub cap-rudder bulb systems are robust, reliable and easy to mount/integrate but mainly suited to propellers with larger hub-to-propeller diameter ratios such as CPPs. Checks on shaft whirling, shaft alignment and rudder steering forces et cetera are recommended before installation. This ESD is selected.
Only smaller post swirls stators are selected for GRIP since they’re less impractical to apply compared to larger variants.
The PBCF is being applied over 20 years and is easy to install on virtually every FPP. This mature solution is included in GRIP.
The Grim Wheel is excluded: either the propeller shaft or the rudder need to be replaced to facilitate it, which makes it a costly ESD. RoI is beyond 5 years.
The innovative combination of an upstream duct and a pre swirl stator is robust and can be applied to tankers and bulk carriers which are within the GRIP scope. This ESD type is included.
An overview of the selection criteria for ESDs is shown in Table 6.
Selection of ESDs for the GRIP project
Selection of ESDs for the GRIP project
The various review sheets, created and maintained by each of the participants, were combined into a single database. Many papers contain information on several ESDs or discuss several applications of a similar ESD on different vessels. Therefore, the number of reviews (130) is considerably higher than the number of papers (56). A list of publicly available literature on ESDs has been created and can be downloaded as a Supplementary data to the article.
Basic statistical analysis was performed on the data. The average Energy Saving Ratios and the standard deviations in the results have been calculated for each of the ESDs. Within the different datasets for the specific ESDs, also subdivisions based on the source of information (model test, full scale measurement, CFD, etc.) and the assigned quality level have been made. Overall results are shown in Table 7 and Fig. 4.
Number of articles, number of review sheets, average ESR and ESR standard deviation for the investigated ESDs
Number of articles, number of review sheets, average ESR and ESR standard deviation for the investigated ESDs
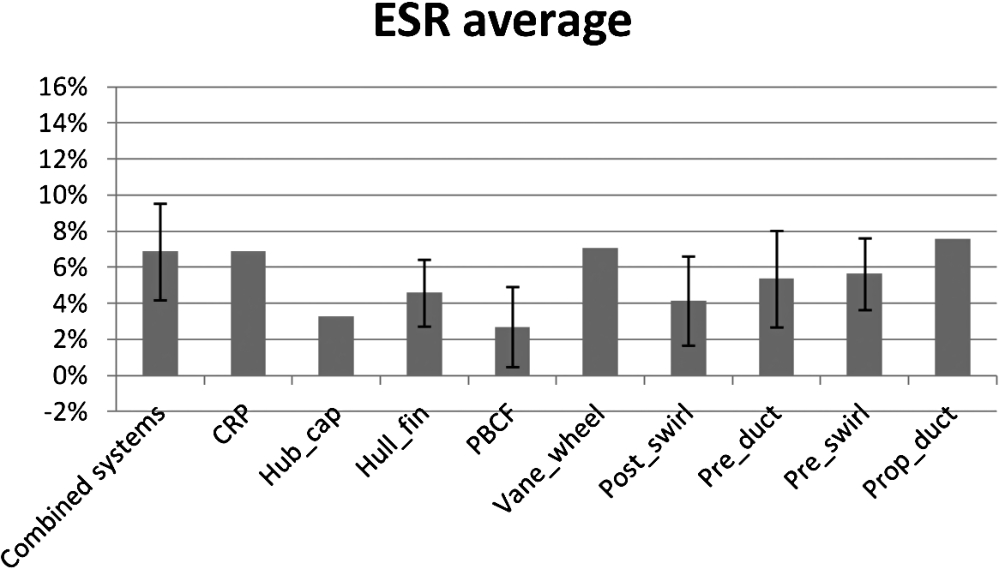
Average ESR and ESR standard deviation for the investigated ESDs.
Table 7 shows that by far the most data is collected for pre ducts based on both the number of articles and the number of review sheets. Furthermore, a significant amount of data is gathered for the hull fins, PBCF and pre swirl stators. Also the combined systems represent a relatively large group. This group consists of various combined devices including the combination of an upstream duct and a pre swirl stator and various combinations of ESDs including a Costa bulb.
Looking at the average ESRs shows that the highest gains are expected from the combined systems, Contra Rotating Propellers (CRPs), vane wheels and ducted propellers. The standard deviation in the CRP and ducted propeller groups however is very large and the available data is scarce. In case where the number of reviews is
For most ESDs, average gains derived by different methods give comparable ESRs. By far the most data comes from model testing (68 review sheets). Full scale measurement data comes in second with 42 review sheets. Data from CFD, either on model scale or full scale is scarce with both 7 review sheets.
Furthermore, the data shows that there seems to be no correlation between the designated quality level of the paper and the average ESR. Also no positive correlation between the quality level and the standard deviation in the results is observed. Most papers have quality designation C (68 review sheets), followed by quality level B (24 review sheets). The pre-selection of papers was done properly, because only 3 papers have been assigned the lowest quality level D.
The benefit tool is built up from different models. The benefit tool is programmed by Marin in the platform Quaestor. Quaestor is a knowledge-based engineering framework to integrate model fragments and knowledge components with limited effort or knowledge about programming. Quaestor is acting as a shell over the different models and couples the input and output. This means that for the user only the Quaestor interface is visible.
Pre swirl stator
It is considered that one may estimate the benefits of a pre swirl stator from very basic performance data of the propeller: thrust coefficient
The tool leaves the stator geometry undefined. In its basic form, the tool does also not consider the propeller geometry (it doesn’t request for the number of blades etcetera). However, besides the expected reduction in required power, the tool will also calculate the relative increase in the required thrust (
To come closer to the operation of a real stator and an actual propeller, the tool introduces efficiencies for the generation of swirl on stator side and the ‘acceptance’ of swirl on the propeller side, respectively
The tool can be combined with a propeller lifting line code and consequently the propeller efficiency becomes better defined while the generic character of the stator efficiency remains. Practically, this means that the parameter
Pre duct
The early assessment tool for Pre ducts is only developed after a good understanding of the working principles of the pre duct was obtained. Based on information from literature, it was concluded that the working mechanism for pre ducts is essentially the same as it is for pre swirl stators: to generate as much pre swirl into the propeller disk as possible, at least the amount of additional drag (see also Schuiling [9], Schuiling et al. [10] and Van Terwisga [14]) is required.
The Early Assessment model for pre ducts is for this reason essentially the same as for pre swirl stators. It was initially intended to modify this model for the pre swirl stators, as a pre duct often has a slightly smaller diameter than a pre swirl stator and it has stator blades that end in a duct or a partial duct, such that the induced drag for the pre duct is likely different than for a pre swirl stator. Recent insights into this effect on stator drag and efficiency however showed that these contributions play only a modest role in the overall benefits and are not decisive for the total performance.
Given the many contributions to the change in resistance with pre duct, there is no meaning in accounting for the differences in wetted surface between pre swirl stators and pre ducts. A strong correlation was found from the limited set of ESDs studied, between the generation of pre swirl and the increasing thrust demand. It is therefore suggested that the increased thrust demand is also coupled to swirl production by the ESD in much the same way as it is for the pre swirl stator. This coupling is brought about through an empirical relation, covering all the distinct contributions to the change in resistance.
To have an additional check on the power saving as obtained from the CRS ECONSHIPS-based lifting line tool, an additional relation has been derived from Svardal and Mewis [13] between the thrust loading coefficient
Hub loss recovery devices
This section summarizes our current understanding of the working principles of rudder bulbs, propeller boss cap fins (PBCFs) and small rudder fins. This understanding is largely based on publicly available literature on PBCFs (e.g. Dang et al. [3], Atlar & Patience [2], STX Finland [12], Nojiri et al. [8], EPA [4], MARIN [7], Hansen et al. [5], ITTC [6] and SDARI & DNV [11]) and work done by Wärtsilä and MARIN within internal development projects.
Since the three ESDs treated here all work through a combination of changing thrust demand (or less overall resistance with active propeller) and a change in propulsor characteristics, the generic form of the vortex model consists of a correction in thrust requirement as well as a correction of the propeller characteristics. The term propulsor characteristics is deliberately used here, as it refers to both the propeller blade characteristics, the hub and possible fins added to the hub. The selected form of the prediction model depends on the data that were available.
Hub cap – rudder bulb systems
Rudder bulbs prevent flow separation and excessive vorticity behind the hub by effectively extending the propeller boss. As a result, the hub drag is reduced. This should compensate the additional friction caused by the increased area exposed to the water. A general trend of the power savings has been modelled for this ESD as a function of the propeller thrust coefficient.
Propeller Boss Cap with Fins (PBCF)
The proposed model for the PBCF on model scale is expressed as a correction on thrust and torque coefficient for any given advance ratio J as a function of the pitch unloading. For full scale corrections, an additional 0.5% may be added to the effect on thrust coefficient.
Small rudder fins
As small rudder fins have very little influence on propeller torque, there are considered as “thrust rudder fins”. The model is then made of the calculation of the thrust efficiency as a function of attack angles and number of additional fins.
Lifting line model
To evaluate the propeller efficiency in the benefit tool, the lifting line theory for propellers is used based on an implementation developed within CRS project ECONSHIPS. This theory calculates the lift and drag which are generated by a propeller in a given flow field. To link the geometry to the lifting line theory, established correction methods are employed.
Because the lifting line model is an important part of the benefit tool, this model has been validated separately. The validation has been performed using open water results from CFD. The result of this validation is shown in Fig. 5. The diamonds are the individual validation cases that have been used. The dashed line indicates the zero deviation line and the dotted lines indicate a 2% relative difference between the CFD results and the lifting line calculation from GRIP. Because this is a relative difference, the distance between the lines is larger for higher absolute efficiencies. The lifting line model also calculates the output that is needed as input for the ESD models, for example the Thrust Loading Coefficient
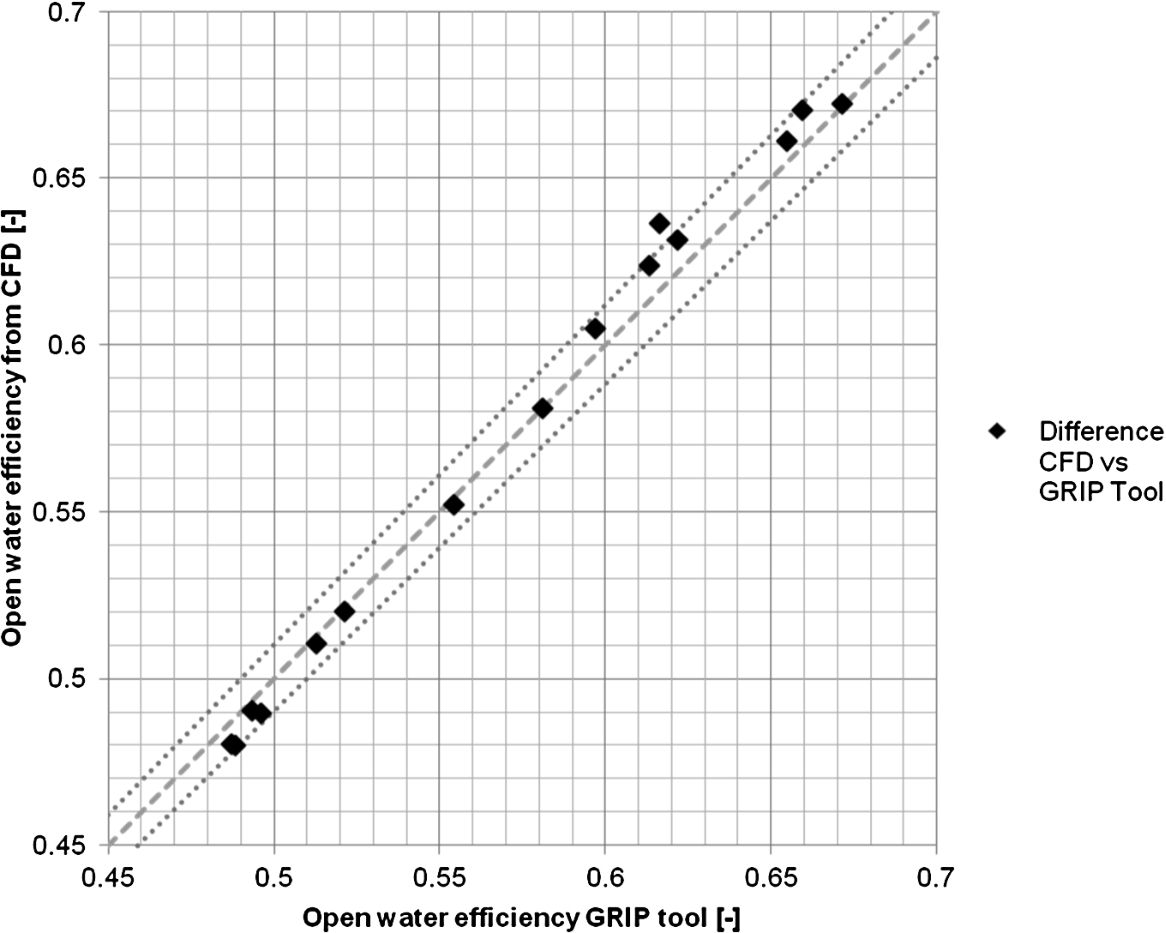
Comparison in calculated open water efficiency from the GRIP tool compared to full scale CFD cases.
As mentioned, the lifting line theory is used in combination with a pre-described wake field. To be able to do this, the wake fields are circumferentially averaged. This means that every radius experiences a constant velocity, but this velocity can be different for each radius. Only the axial and tangential velocities are used in the tool, the radial components are neglected. Within the Lifting line tool the wake field database is included. In Fig. 6 an example wake field is shown on the left, with the circumferential averaged axial velocities shown on the right.
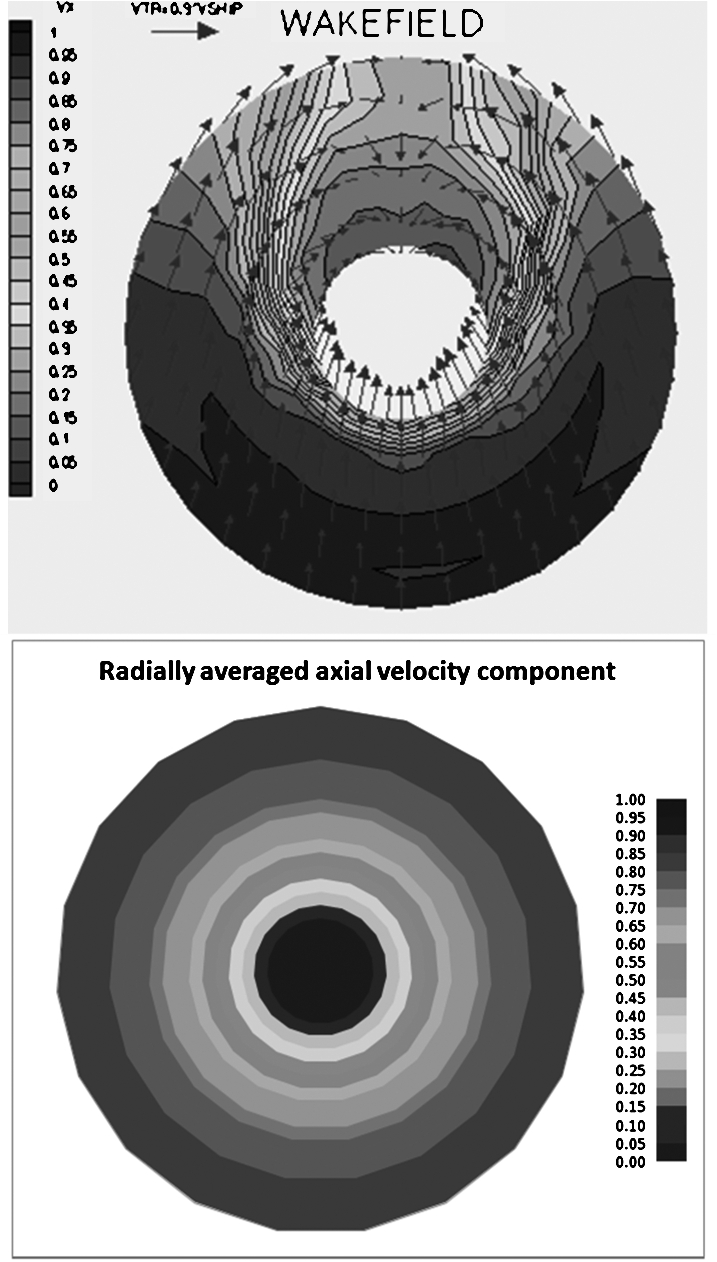
Example of a fully defined wake field with axial, tangential and radial components (top) and circumferentially averaged axial components as used in the lifting line model.
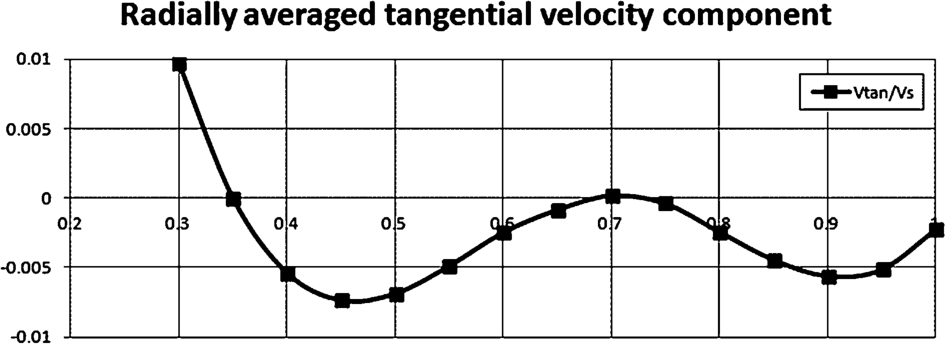
Example of circumferentially averaged wake field tangential components.
In Fig. 7 the tangential velocities are given over the radii. The values of the averaged tangential components are very close to zero. The tangential velocities on the left side of the propeller disc have opposite signs compared to the tangential velocities on the right side, which makes the average approximately zero.
In the lifting line theory it is assumed that the circulation goes down to zero at the hub. Therefore the circulation close to the hub as calculated by lifting line models is not realistic. For the calculation of the propeller performance this is not an issue, since the inner radii do not contribute a lot to the total thrust and torque. For the evaluation of hub loss recovery devices however, this model is unsuitable since the circulation near the hub is undefined. For this reason the hub vortex model could not be used. The downstream ESD models are based on empirical data with propeller characteristics as input.
Validation of the benefit tool
The validation is performed using data from the different participants. An overview of the validation cases is given below.
Pre swirl stator
Uljanik Bulk Carier case made available by HSVA. The results are from a CFD analysis. The full propeller geometry for this case is not available, so a B-Series propeller is used based on the main parameters. The same case is also tested at full scale during sea trials.
Pre duct
Uljanik released data for one of their bulk carriers and information on a tanker was made available by MARIN, taken from the STREAMLINE EU project 233896 (Strategic Research for Innovative Marine Propulsion Concepts). The results are from a CFD analysis. The full propeller geometry for the Uljanik case is not available, so a B-Series propeller is used based on its main parameters.
PBCF
Two anonymous validation cases are made available by Wärtsilä. These results are from a CFD analysis. All needed data was available for this case.
Hub cap – rudder bulb
HTC-2 case made available by MARIN. For this validation case both a model test and CFD analysis are performed. All required data was available for this case.
Small rudder fins
No actual validation cases are available for the small rudder fins. However, both HSVA and VICUS have made an attempt to design optimal small rudder fins without achieving a noticeable efficiency gain.
Summary of validation cases for the different ESDs
Summary of validation cases for the different ESDs
An overview of the results is given in Table 8. The power reduction that is determined is given for the validation case and for the benefit tool. Also the relative and total difference is given with respect to each other. The current version of the tool seems quite promising for the work it is intended to do considering that the EAT only requires basic input on the ship and its operating profile. A detailed analysis requires much more detailed information on the geometry of the vessel, propeller and appendages to conduct sophisticated RANS or RANS-BEM calculations. Such an extensive analysis is generally only conducted once an early assessment has shown potential.
The input fields for the cost model tool have been limited as much as possible to limit the complexity for the user. The general input fields are:
Propeller diameter
Single or twin screw
Docking zone 1, 2 or 3
The main parameter that determines the cost is the propeller diameter because it was shown that all ESDs physically scale with the propeller diameter. Furthermore, total investment costs per vessel depend on the shaft configuration: single or twin screw. The models are primarily based on single screw vessels. In case of a twin screw vessel the engineering costs are multiplied by 1.3 since twin screw vessel are more complex in design. Material and installation costs are multiplied by 1.9 – slightly lower than the logical value of 2 – since it was assumed that production efficiency increases when 2 identical ESDs need to be manufactured.
The installation costs depend on where the vessel is docking. Therefore three zones have been identified, providing the user with a first indication on the effect of different docking locations. Zones are determined based on a paper by Apostolidis [1], describing the regional shipyard costs for repairs for 13 regions.
In case of ESDs for which a new propeller might be required, a fourth parameter is requested. This parameter is the question whether the existing propeller is a CPP or an FPP since this determines the price quite significantly.
Full Early Assessment Tool (EAT)
The full EAT is developed to assess the viability of ESDs in an early stage. This version of the tool is available to project members only. It estimates the fuel savings and ESD costs and combines them into a RoI to assess the overall ESD benefit. Target users are the staff of ship owners, consultants et cetera.
The EAT is stand-alone, Windows-based software. It is built using the Quaestor knowledge-based engineering framework which is a tool developed by MARIN. It combines the benefit and cost models into a user-friendly interface.
The tool also facilitates access to the literature and patent databases created within in the GRIP project. A search function is included for filtering purposes. Users can filter the database contents on the title of the paper, author, file name, quality designation, ESD type and ESD description. Results are shown in a table including links to the actual pdf documents. A screenshot of the EAT literature database is shown in Fig. 8. The patent database consists of active patents filed for ESDs.
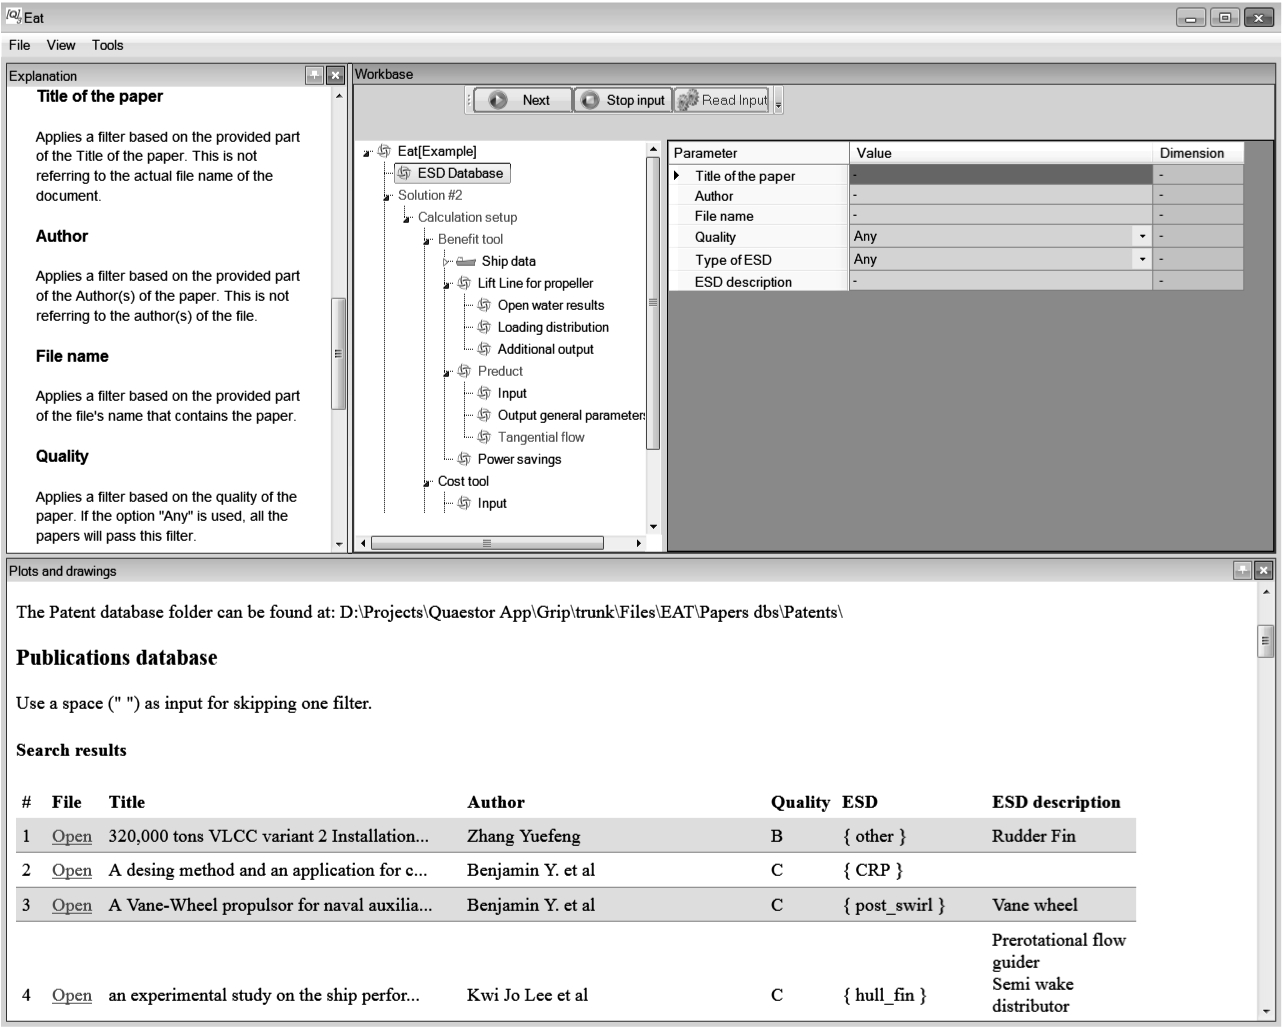
The EAT literature database.
To use the cost, benefit and economical tools, the user can create a new solution. The user can choose between the benefit tool, cost tool and the combination of both after selecting a specific ESD type. Step by step, the user is guided through the required input fields. The tool also displays intermediate results. Finally, the results from the cost and benefit tools are combined into the economical tool to calculate a RoI and the Energy Efficiency GRIP Index. Figure 9 shows a screenshot of the structure and output from the economical tool.
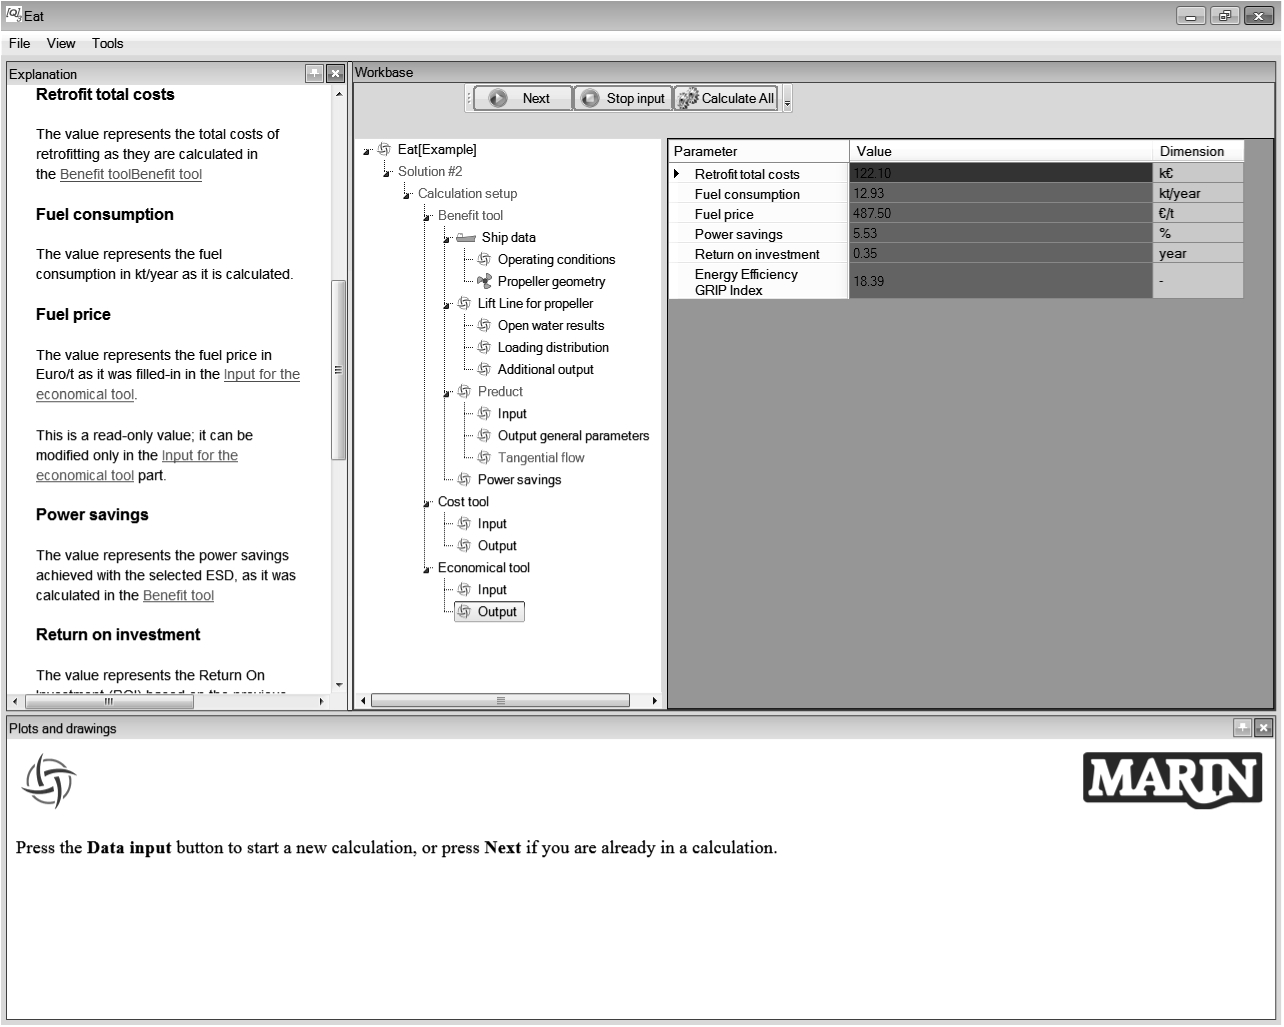
Screenshot of the structure and output from the economical tool.
An example is the application of a PBCF on a large container vessel with an MCR power of 60 MW, a propeller speed of 102 rpm and a ship speed of 25 knots. Using the B-Series to calculate an open water diagram for its 9000 mm, 6-bladed FPP with a Blade-to-disc Area Ratio (BAR) of 0.95 and a pitch to diameter ratio of 1.00, allows the tool to calculate the expected power reduction from application of a PBCF. In this specific case, the expected power saving is 2.0%. After that, the input for the cost tool can be entered. Data which was already entered before, like the propeller diameter, is inserted automatically. For this single screw vessel, docking in China, calculated costs are estimated at 112 k€. Since most container vessel are currently operating in slow steaming mode, an average engine power of 30000 kW is used in the economical tool to calculate the annual fuel consumption of the vessel. Based on this input, a RoI of 6 months is calculated.
Other examples for typical applications of other ESDs show power savings in the range of 2.0% to 6.5% and RoIs in the range of 4 to 11 months. Some typical examples are shown in Table 9.
Example cases from EAT calculations
The iEAT is the web-based version of the EAT for public use. It is accessible at
Vessel type
Propeller diameter
MCR power per shaft
Number of shaft lines
Vessel speed
Displacement
Current fuel price
Fixed costs factor
A series of 8 ESDs are supported: hull fins/spoiler, pre swirl stator, pre duct, duct surrounding propeller, contra rotating devices, hub cap-rudder bulb, post swirl stator and combined systems. Most of the input fields have an on-site explanation. Once the mouse hovers over the line presenting the input field, a tooltip will be displayed, if available. The results of the iEAT are presented on the output page, shown in the Fig. 10. Similar to the input page, the output page contains explanations for some of the results. Once the mouse hovers over the line presenting the output field, a tooltip will be displayed, if available.
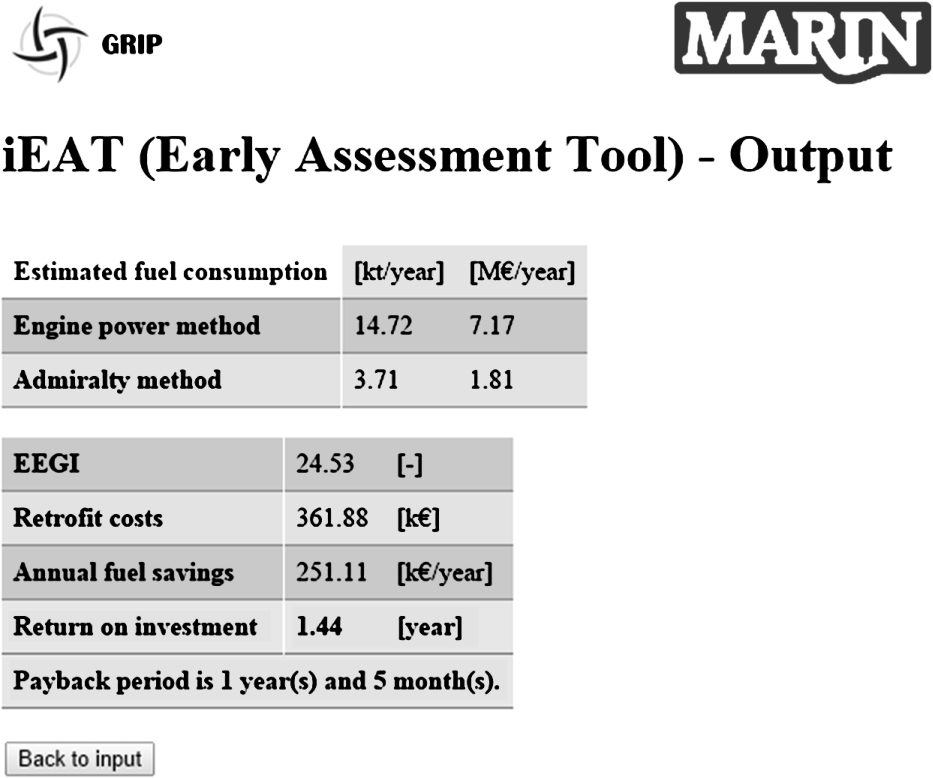
Output screen of the iEAT.
Within the GRIP project, first a selection of ESDs and vessel types to be considered was made. Vessel types which account for the largest share in absolute worldwide fuel consumption were selected and consist of container vessels, bulk carriers, tankers, ferries/RoPax vessels and short sea shipping cargo vessels.
The ESD types which were selected for detailed research are hull fins, pre swirl stators, pre ducts, ducts surrounding the propeller, contra rotating devices, hub cap-rudder bulb systems, post swirl stators and a number of combined systems.
Then, the general structure for the Early Assessment Tool was set up after which the collection of data for the ESD literature database was initiated. A reviewing tool was created to easily and structurally store the main contents of each reviewed paper. In total, the database contains 130 review sheets. Basic statistical analysis was performed on the data. The average Energy Saving Ratios and the standard deviations in the results have been calculated for each of the ESDs. Within the different datasets for the specific ESDs, also subdivisions based on the source of information (model test, full scale measurement, CFD, etc.) and the assigned quality level have been made.
A general calculation tool for the prediction of potential power savings from ESDs has been developed. The algorithms used for this tool are largely empirical, derived from regression analysis by using a parametric ship-propulsor description. A lifting line model is set up to calculate propeller efficiency for a given operating condition. By comparing the results from calculations with and without ESD, the power reduction obtained with the selected ESD is calculated. Circumferentially averaged wake fields are used to include the influence of the hull on propeller efficiency. A database is included in the calculation tool containing typical wake fields for the 5 selected vessel types. The benefit tool can calculate relative power savings for 5 different ESDs. For each of these, a parametric model was created which does not consider the specific ESD geometry but calculates power savings based on the propeller losses that can be recovered with the selected ESD. ESD models are created for the pre swirl stator, pre duct, hub cap-rudder bulb systems, PBCF and small rudder fins.
The models were validated by comparing against reference cases from CFD calculations and model tests with satisfactory results. Because the amount of required input data is limited and the nature of the calculation models is general, accuracy is limited. Depending on ESD type, the uncertainty is between
A second model is created to estimate costs for ESDs. The goal of this model is to determine the Return on Investment of an ESD at an early stage. The cost model is created using collected real-life data. From the retrieved data, per ESD a single parameter is selected which correlates well with actual costs. For all ESDs, the driving parameter which determines costs is the propeller diameter. Cost models for the contra rotating propeller, Grim Wheel and post swirl stator were dismissed, since they turned out to be too case dependent.
The ESD database, benefit tool and cost tool are integrated into two versions of the Early Assessment Tool: a web-based iEAT which is publicly available and the Windows-based full EAT tool which is only available to GRIP participants. The iEAT is based on simpler, initial models and requires less input than the full EAT but is therefore also offers lower accuracy. Furthermore, the full EAT includes literature and patent databases which are not available in the iEAT. Users can calculate power savings, costs and RoIs for a selection of ESDs to assess the applicability of ESDs on a specific vessel type.