
Abstract
Background:
Advanced Alzheimer’s disease (AD) has no effective treatment, and identifying early diagnosis markers can provide a time window for treatment.
Objective:
To quantify the changes in cerebral blood flow (CBF) and iron deposition during progression of AD.
Methods:
94 subjects underwent brain imaging on a 3.0-T MRI scanner with techniques of three-dimensional arterial spin labeling (3D-ASL) and quantitative susceptibility mapping (QSM). The subjects included 22 patients with probable AD, 22 patients with mild cognitive impairment (MCI), 25 patients with subjective cognitive decline (SCD), and 25 normal controls (NC). The CBF and QSM values were obtained using a standardized brain region method based on the Brainnetome Atlas. The differences in CBF and QSM values were analyzed between and within groups using variance analysis and correlation analysis.
Results:
CBF and QSM identified several abnormal brain regions of interest (ROIs) at different stages of AD (p < 0.05). Regionally, the CBF values in several ROIs of the AD and MCI subjects were lower than for NC subjects (p < 0.001). Higher QSM values were observed in the globus pallidus. The CBF and QSM values in multiple ROI were negatively correlated, while the putamen was the common ROI of the three study groups (p < 0.05). The CBF and QSM values in hippocampus were cross-correlated with scale scores during the progression of AD (p < 0.05).
Conclusion:
Iron deposition in the basal ganglia and reduction in blood perfusion in multiple regions existed during the progression of AD. The QSM values in putamen can be used as an imaging biomarker for early diagnosis of AD.
Keywords
INTRODUCTION
Alzheimer’s disease (AD) is a neurodegenerative disease mainly manifested by progressive irreversible memory loss and cognitive decline [1]. The incidence of AD has been increasing in recent years. It not only seriously affects the quality of life for the elderly but also causes a heavy economic burden on the society. Neurofibrillary tangles and amyloid-β neuritic plaques are well-known pathological features of AD, but its pathogenesis is complex, involving multiple theories, and including multiple risk factors [2]. Several studies have pointed out that vascular risk factors and iron deposits play an important role in the process of AD pathology [3, 4]. Previous studies have found, using three-dimensional arterial spin labeling (3D-ASL), that these vascular risk factors lead to vascular injury, resulting in abnormal cerebral blood perfusion in specific areas, such as the hippocampus and thalamus, with abnormal in blood flow in these areas related to the progression and severity of AD [5–7]. In recent years, MR quantitative susceptibility mapping (QSM) has been used in AD patients and iron overload has been observed in the basal ganglia [8, 9]. Simultaneously, a new study found an imbalance in iron metabolism in the neurons of AD patients [10]. These studies show that the rapid development of neuroimaging and the latest progress in MRI quantitative technology make an early diagnosis of AD possible. While previous research shows that the cerebral blood flow (CBF) changes due to vascular injury and iron deposition (because of abnormal iron metabolism) are involved in the pathological process of AD, the correlation of CBF and iron deposition has not been investigated [8, 11]. Therefore, in this study, we followed the natural progression of AD, which includes different stages of AD, namely, subjective cognitive decline (SCD), mild cognitive impairment (MCI), and dementia [12]. Our aim was to use 3D-ASL and QSM techniques to quantify the CBF and iron content in specific brain regions in these different groups; analyze the characteristics of CBF and iron deposition; and explore the correlation between them.
MATERIALS AND METHODS
Study participants
The institutional ethics committee approved our prospective study. All of the subjects gave written informed consent prior to their inclusion in the study. Ninety-four subjects were enrolled in this study from January 1, 2018 to December 30, 2019. Of those recruited, 22 patients had probable AD (denoted as AD in this paper) (9 males, age: 70±9 years; 13 females, age: 75±7 years), 22 patients had MCI (10 males, age: 73±7 years; 12 females, age: 71±10 years), and 25 patients had SCD (11 males, age: 69±6 years; 14 females, age: 71±10 years). Additionally, 25 age- and sex-matched healthy controls (mean age: 69 years; age range: 60–81 years, 10 males [mean age: 70 years; range: 60–81 years] and 15 females [mean age: 69 years; range: 65–75 years]) were recruited for the study.
A diagnosis of probable AD was made based on National Institute on Aging and Alzheimer’s Association (NIA-AA) [13], a diagnosis of MCI was made according to Petersen [14], and a diagnosis of SCD was made according to the consensus among Chinese experts [15, 16] and in accordance with the subjective cognitive decline initiative (SCD-I) [17]. Furthermore, the exclusion criteria were as follows: Hachinski Ischemic Score (HIS) ≥4 [18]; Geriatric Depression Scale (GDS) scores ≥21 [19]; patients with structural brain abnormalities; patients with a history of mental health problems; patients with serious hearing and vision disorders that would make them unable to cooperate with the examination; patients with contraindications for undergoing MRI examination; and patients with poor image registration in the post-processing process.
All of the control subjects were free of neurologic illness as indicated by their performance on two cognitive screening tests, namely, Mini-Mental State Examination (MMSE) and Montreal Cognitive Assessment (MoCA). All of the demographic details are summarized in Table 1.
Values are in means±standard deviations, with ranges in parentheses.
The χ 2 and P values refer to statistical results of Kruskal–Wallis test in the whole group. SCD, subjective cognitive decline; MCI, mild cognitive impairment; AD, Alzheimer’s disease; MMSE, Mini-Mental State Examination; MoCa, Montreal Cognitive Assessment.
Imaging protocol
All of the data were obtained on a 3.0T MR scanner (Discovery MR 750, GE Healthcare, Milwaukee, WI) equipped with a 32-channel phased-array coil. All the participants underwent a 3D T1-weighted imaging acquisition (TR/TE = 8.5/3.2 ms, TI = 450 ms, FA = 15°, FOV = 256×256 mm, matrix = 256× 256, slice thickness = 1 mm, 192 sagittal slice, BW = 31.25 kHz), a 3D-pCASL acquisition (TR/TE = 5357/10.7 ms, matrix 240×240, delay time = 2500 ms [20], NEX = 3 times, FoV = 240×240 mm, matrix = 512 points×8 arms, slice thickness = 4 mm), and a 3D multigradient-echo QSM acquisition (TR/TE1 = 41.8/3.3 ms, number of echoes = 16, TE spacing = 2.3 ms, flip angle = 20°, FoV = 256×256 mm, matrix = 256×256, slice thickness = 1 mm, 124 axial slices, BW = 62.50 kHz).
Post-processing and measurements
Arterial spin labeling and quantitative susceptibility mapping MRI
The CBF and magnetic susceptibility maps were further calculated from the ASL and QSM data on an AW4.6 GE Workstation. Using the SPM12 software package (http://www.fil.ion.ucl.ac.uk/spm/) implemented in MATLAB (MathWorks, Natick, MA, USA), we first registered the ASL and CBF images of each participant to the structural image of their brain, then normalized it to the standard brain, and finally smoothed with a 6 mm isotropic Gaussian kernel (Fig. 1). The processing method used for analyzing QSM data was the same as above.
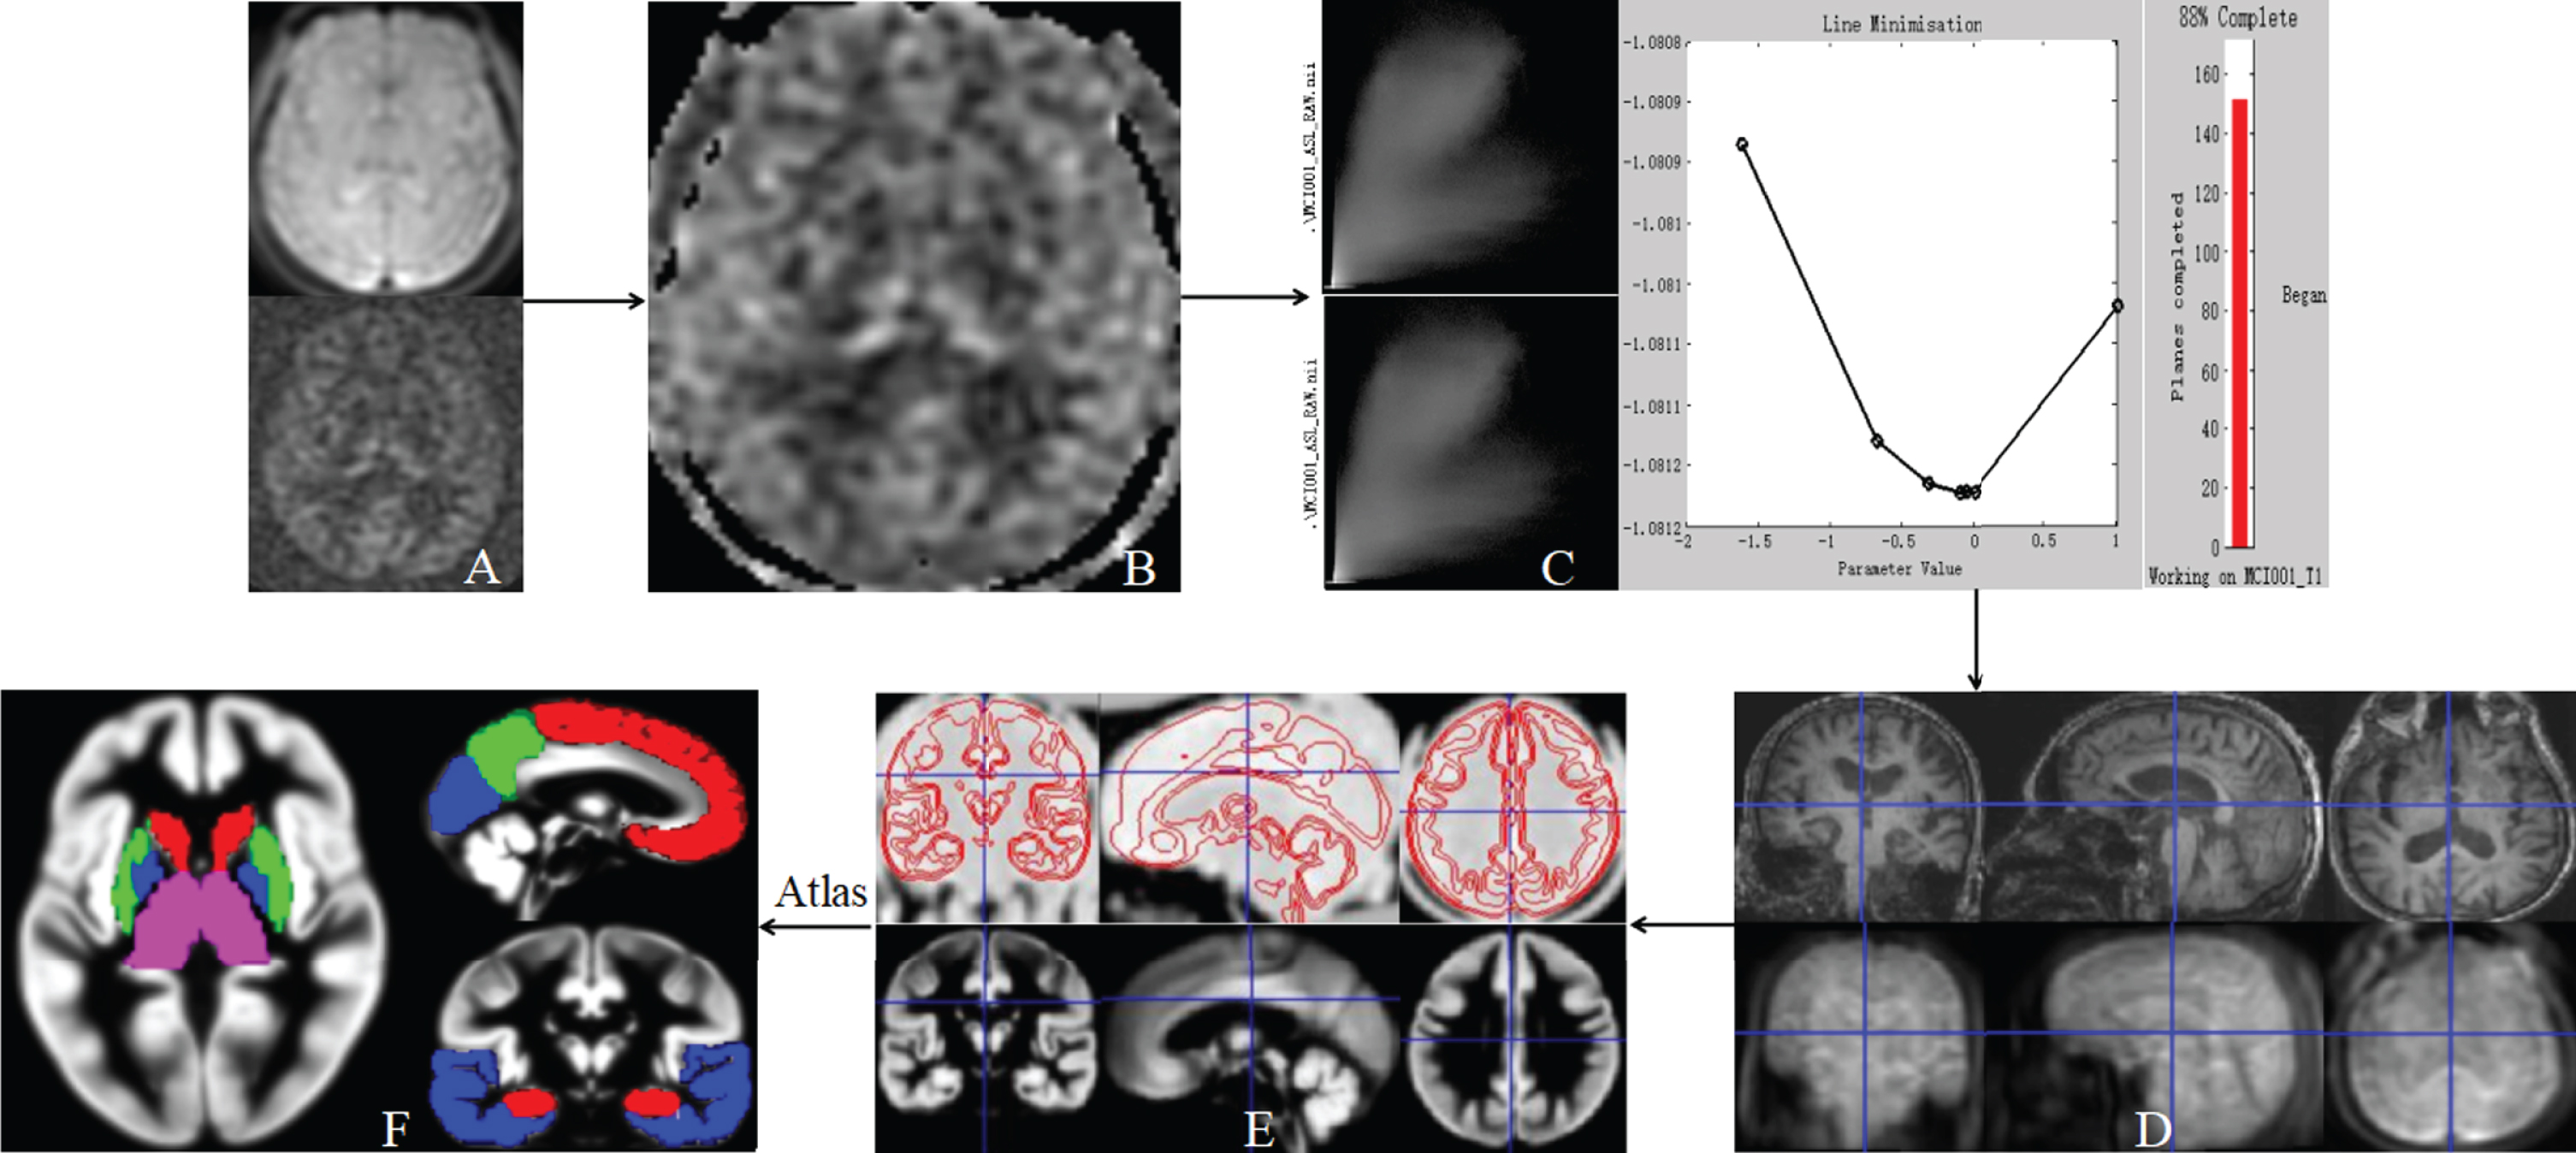
Standardized method for measuring the cerebral blood flow (CBF) in ROIs using the MATLAB software (the same method was used to extract the susceptibility value). A) Raw data including control images and marker images were obtained through ASL-MRI scanning. B) The CBF maps were further calculated from the ASL raw data on AW4.6 GE workstation. C, D) ASL and CBF images of each participant were registered to their own structural image using the SPM12 software package in MATLAB and normalized to the standard brain. E) It was smoothed with a 6 mm isotropic Gaussian kernel, and the registered image was proofread. F) Extracted CBF values on a normalized segmented ROI based on the Brainnetome Atlas (axial view = globus pallidus, putamen, caudate nucleus, and thalamus; sagittal view = frontal cortex, parietal cortex, and occipital cortex; coronal view = hippocampus and temporal cortex).
Regional extractions
Several previous studies [11, 22] have shown that abnormal blood perfusion and iron content exist in certain areas of the AD brain. Therefore, we set knowledge-based ROIs in different brain regions, namely, globus pallidus, putamen, caudate nucleus, hippocampus, thalamus, frontal cortex, parietal cortex, occipital cortex, and temporal cortex. These areas were extracted based on the Brainnetome Atlas brain network atlas using the SPM12 software package implemented in MATLAB [23]. The mean values of CBF and QSM were obtained from the eight defined ROIs using a custom MATLAB script.
Statistical analysis
Demographic analysis
Age and gender were compared among the four groups. Using the Kolmogorov–Smirnov test, we found that they were not normally distributed (p < 0.05). Hence, age and gender differences were tested using the Kruskal–Wallis test.
Differences analysis
Because ROI for CBF and QSM were normally distributed (p > 0.05 by the Kolmogorov–Smirnov test), analysis of covariance (ANCOVA) test was used with age and gender as covariates to evaluate group differences in CBF and QSM among the four subject groups for each ROI. A significance level of p = 0.05 was applied with correction for multiple comparisons using the family-wise error (FWE) method. The post-hoc test did pairwise comparisons of values between different subject groups. Bonferroni correction was applied (p = 0.05).
Correlation analysis
Wilcoxon rank-sum test was used to perform the correlation analysis between the CBF and gender in each ROI. Spearman test was used to perform the correlation analysis between the CBF and age in each ROI. Partial correlation analysis between the CBF and scale scores (MMSE and MoCA) was performed by controlling age and gender factors. The statistical method used for correlation analysis of QSM was the same as for CBF. Finally, the partial correlation analysis between the CBF and QSM values was performed with age and gender as covariates.
The receiver operating characteristic (ROC) curve analysis: ROC curve analysis was performed to demonstrate the sensitivity and specificity of CBF and QSM to differentiate among the subject groups in each ROI. A significance level of Bonferroni correction (p = 0.05) was also applied for this analysis. MedCalc statistical software (http://www.medcalc.org, Ostend, Belgium) was used to analyze the ROI.
RESULTS
Demographic analysis
The demographic data of the subjects are summarized in Table 1. Age and gender was not significantly different among the four groups (p > 0.05). The score in the two scales (MMSE and MoCA) was not statistically analyzed between the groups as it was used as the standard of sample enrollment.
Difference analysis
Significant differences in CBF and magnetic susceptibility values were found between different groups in several ROIs in the ASL and QSM maps (p < 0.05) (Table 2). As shown in Fig. 2, there were significant differences between the two groups with Bonferroni correction. The AD and MCI groups showed significant differences from the NC group with respect to CBF in all of the ROIs, and significant differences of CBF in thalamus were observed in the SCD group (p < 0.05). No significant differences in CBF were observed in the MCI and AD groups (p > 0.05). Similarly, no significant differences in QSM were observed in globus pallidus, caudate nucleus, and putamen in the MCI and SCD groups (p > 0.05), while the differences between the other groups were significant (p < 0.05). The above phenomena were visually observed on the CBF and QSM maps (Fig. 3).
Group differences in CBF and QSM between the four subject groups for each ROI, including the subjects with Alzheimer’s disease (AD), mild cognitive impairment (MCI), subjective cognitive decline (SCD), and normal control (NC) subjects, were evaluated by analysis of covariance test (the F and p values refer to results in the whole group). Values are reported as means±standard deviations. (CBF, ml/100 g/min; QSM values in ppm, parts per million). Significance difference is p = 0.05
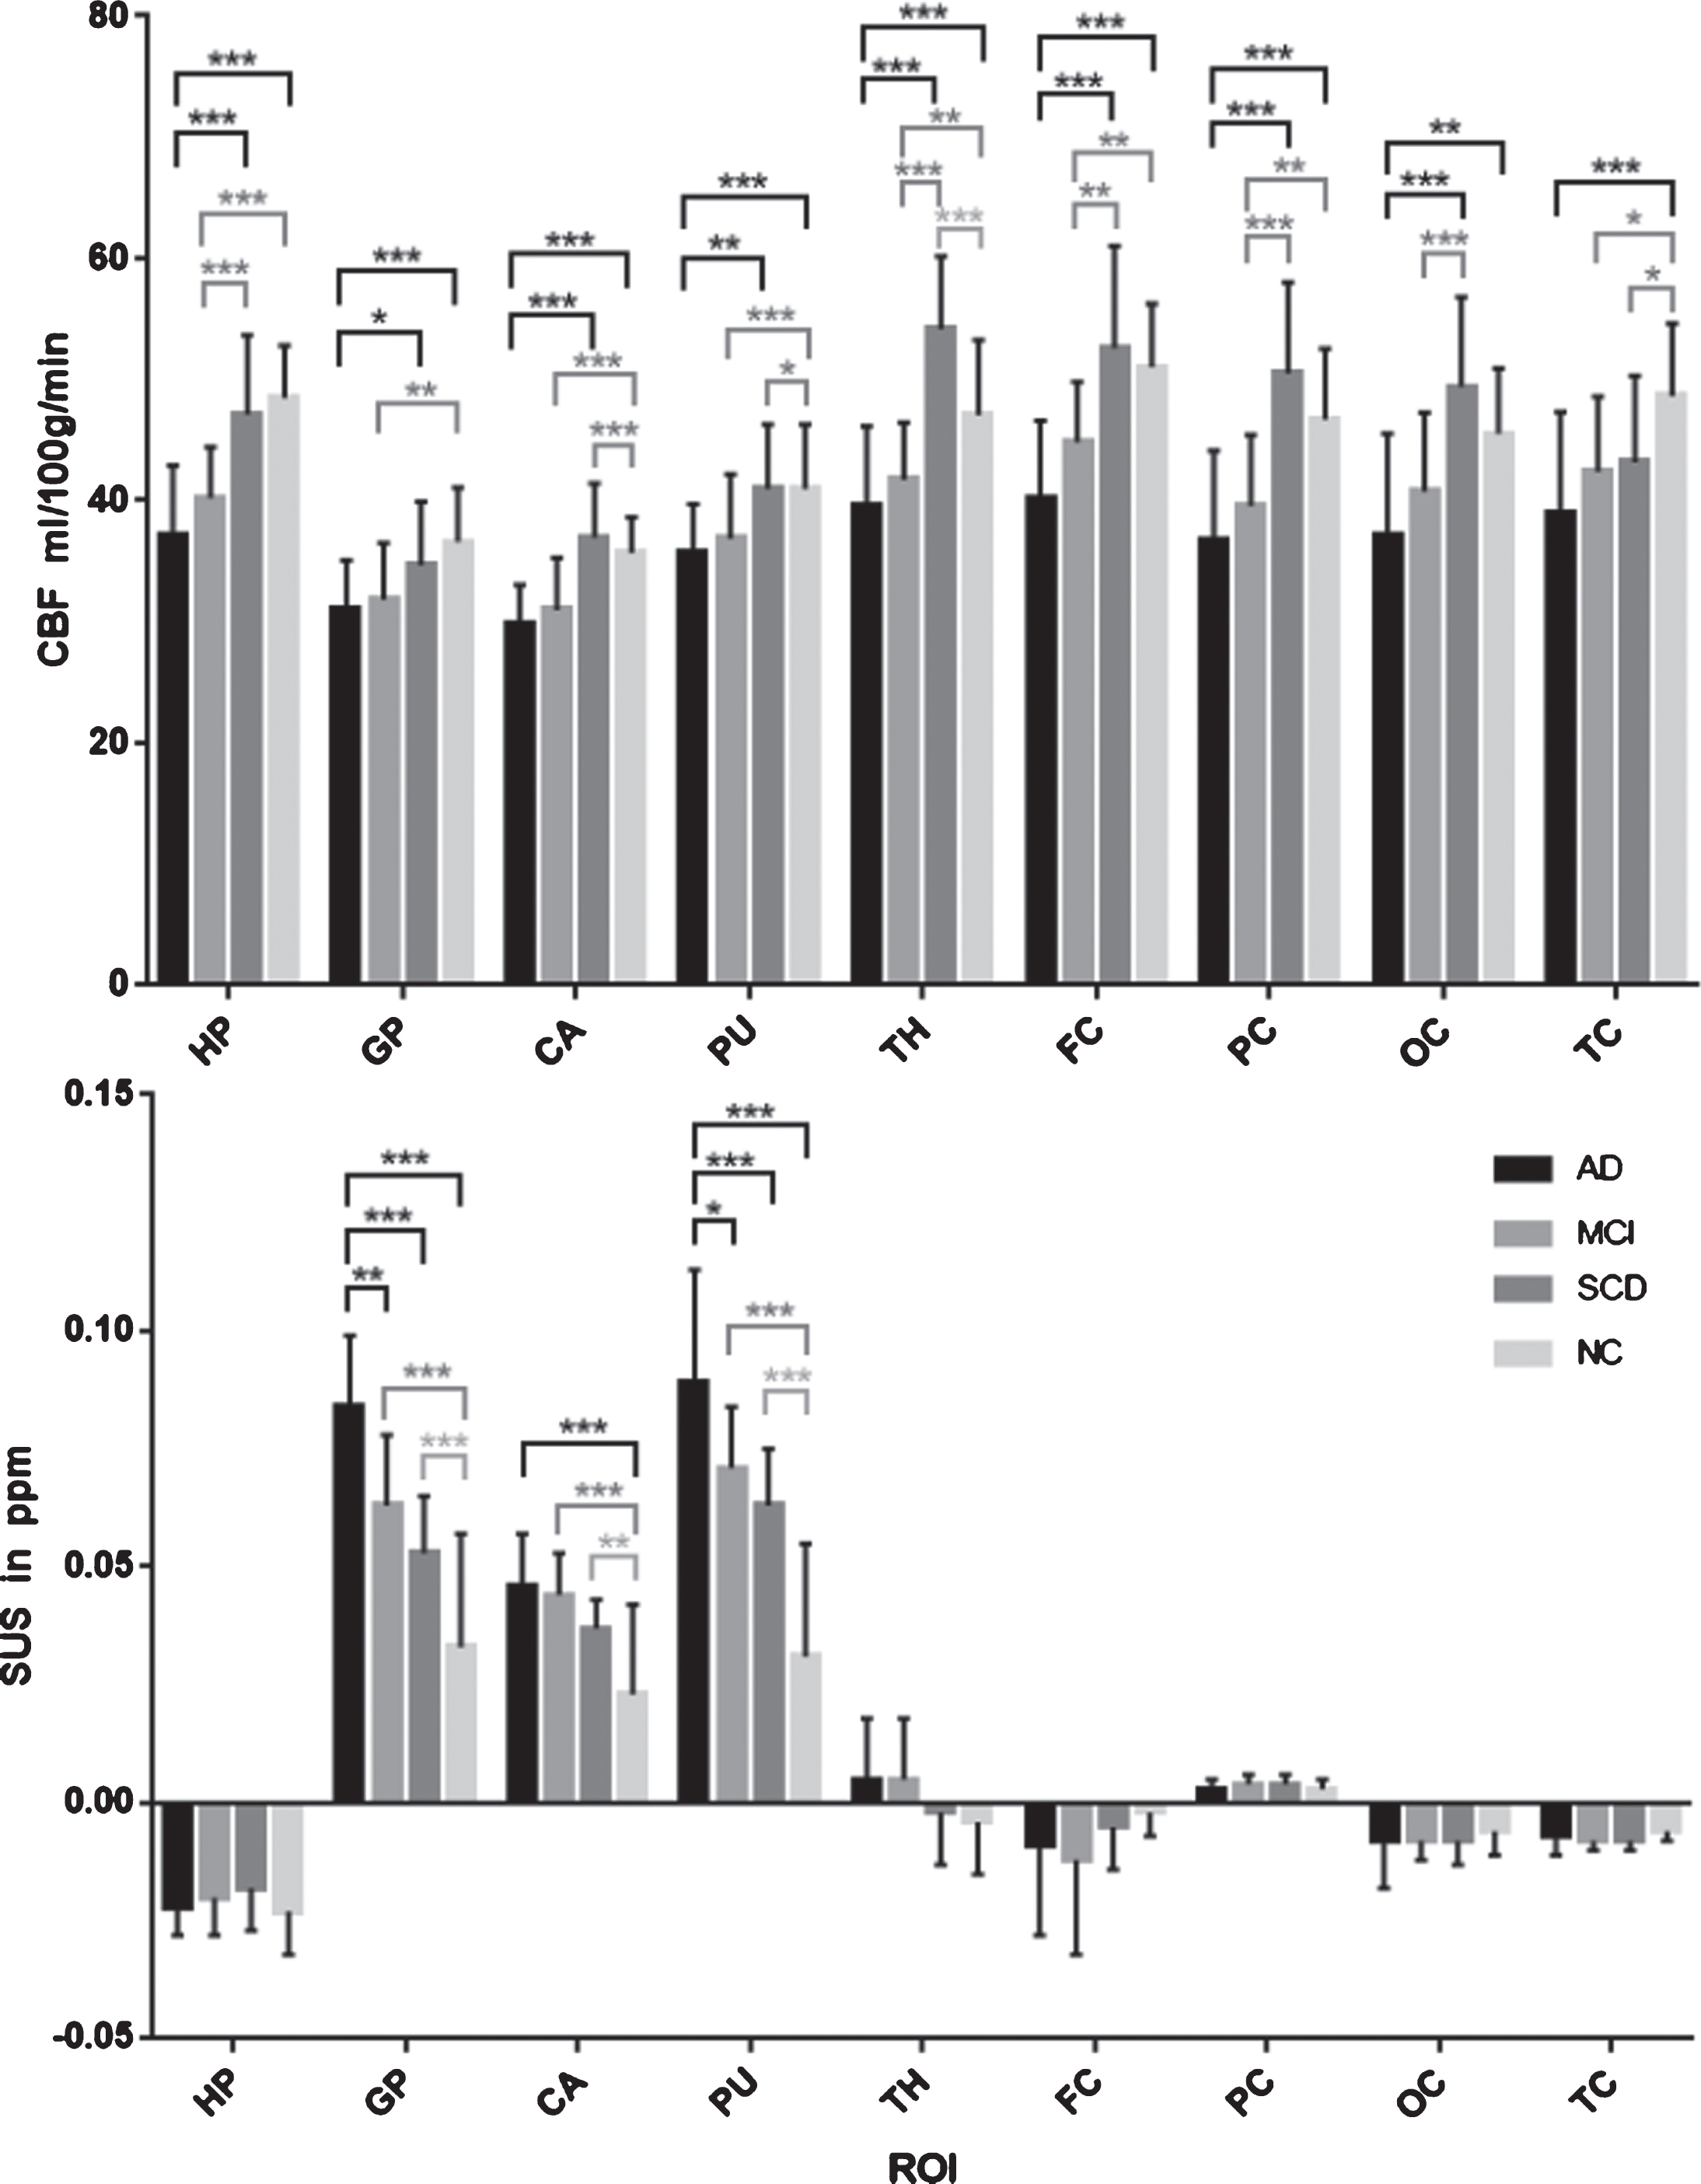
CBF and QSM statistical differences between the two groups for each ROI. Bonferroni correction was applied. p = 0.05. The bar chart data was reported as means±standard deviations, in which AD = 22, MCI = 22, SCD = 25, and NC = 25 cases. Asterisks show the strength of the group difference, that is, *p < 0.05; **p < 0.01; ***p < 0.001.
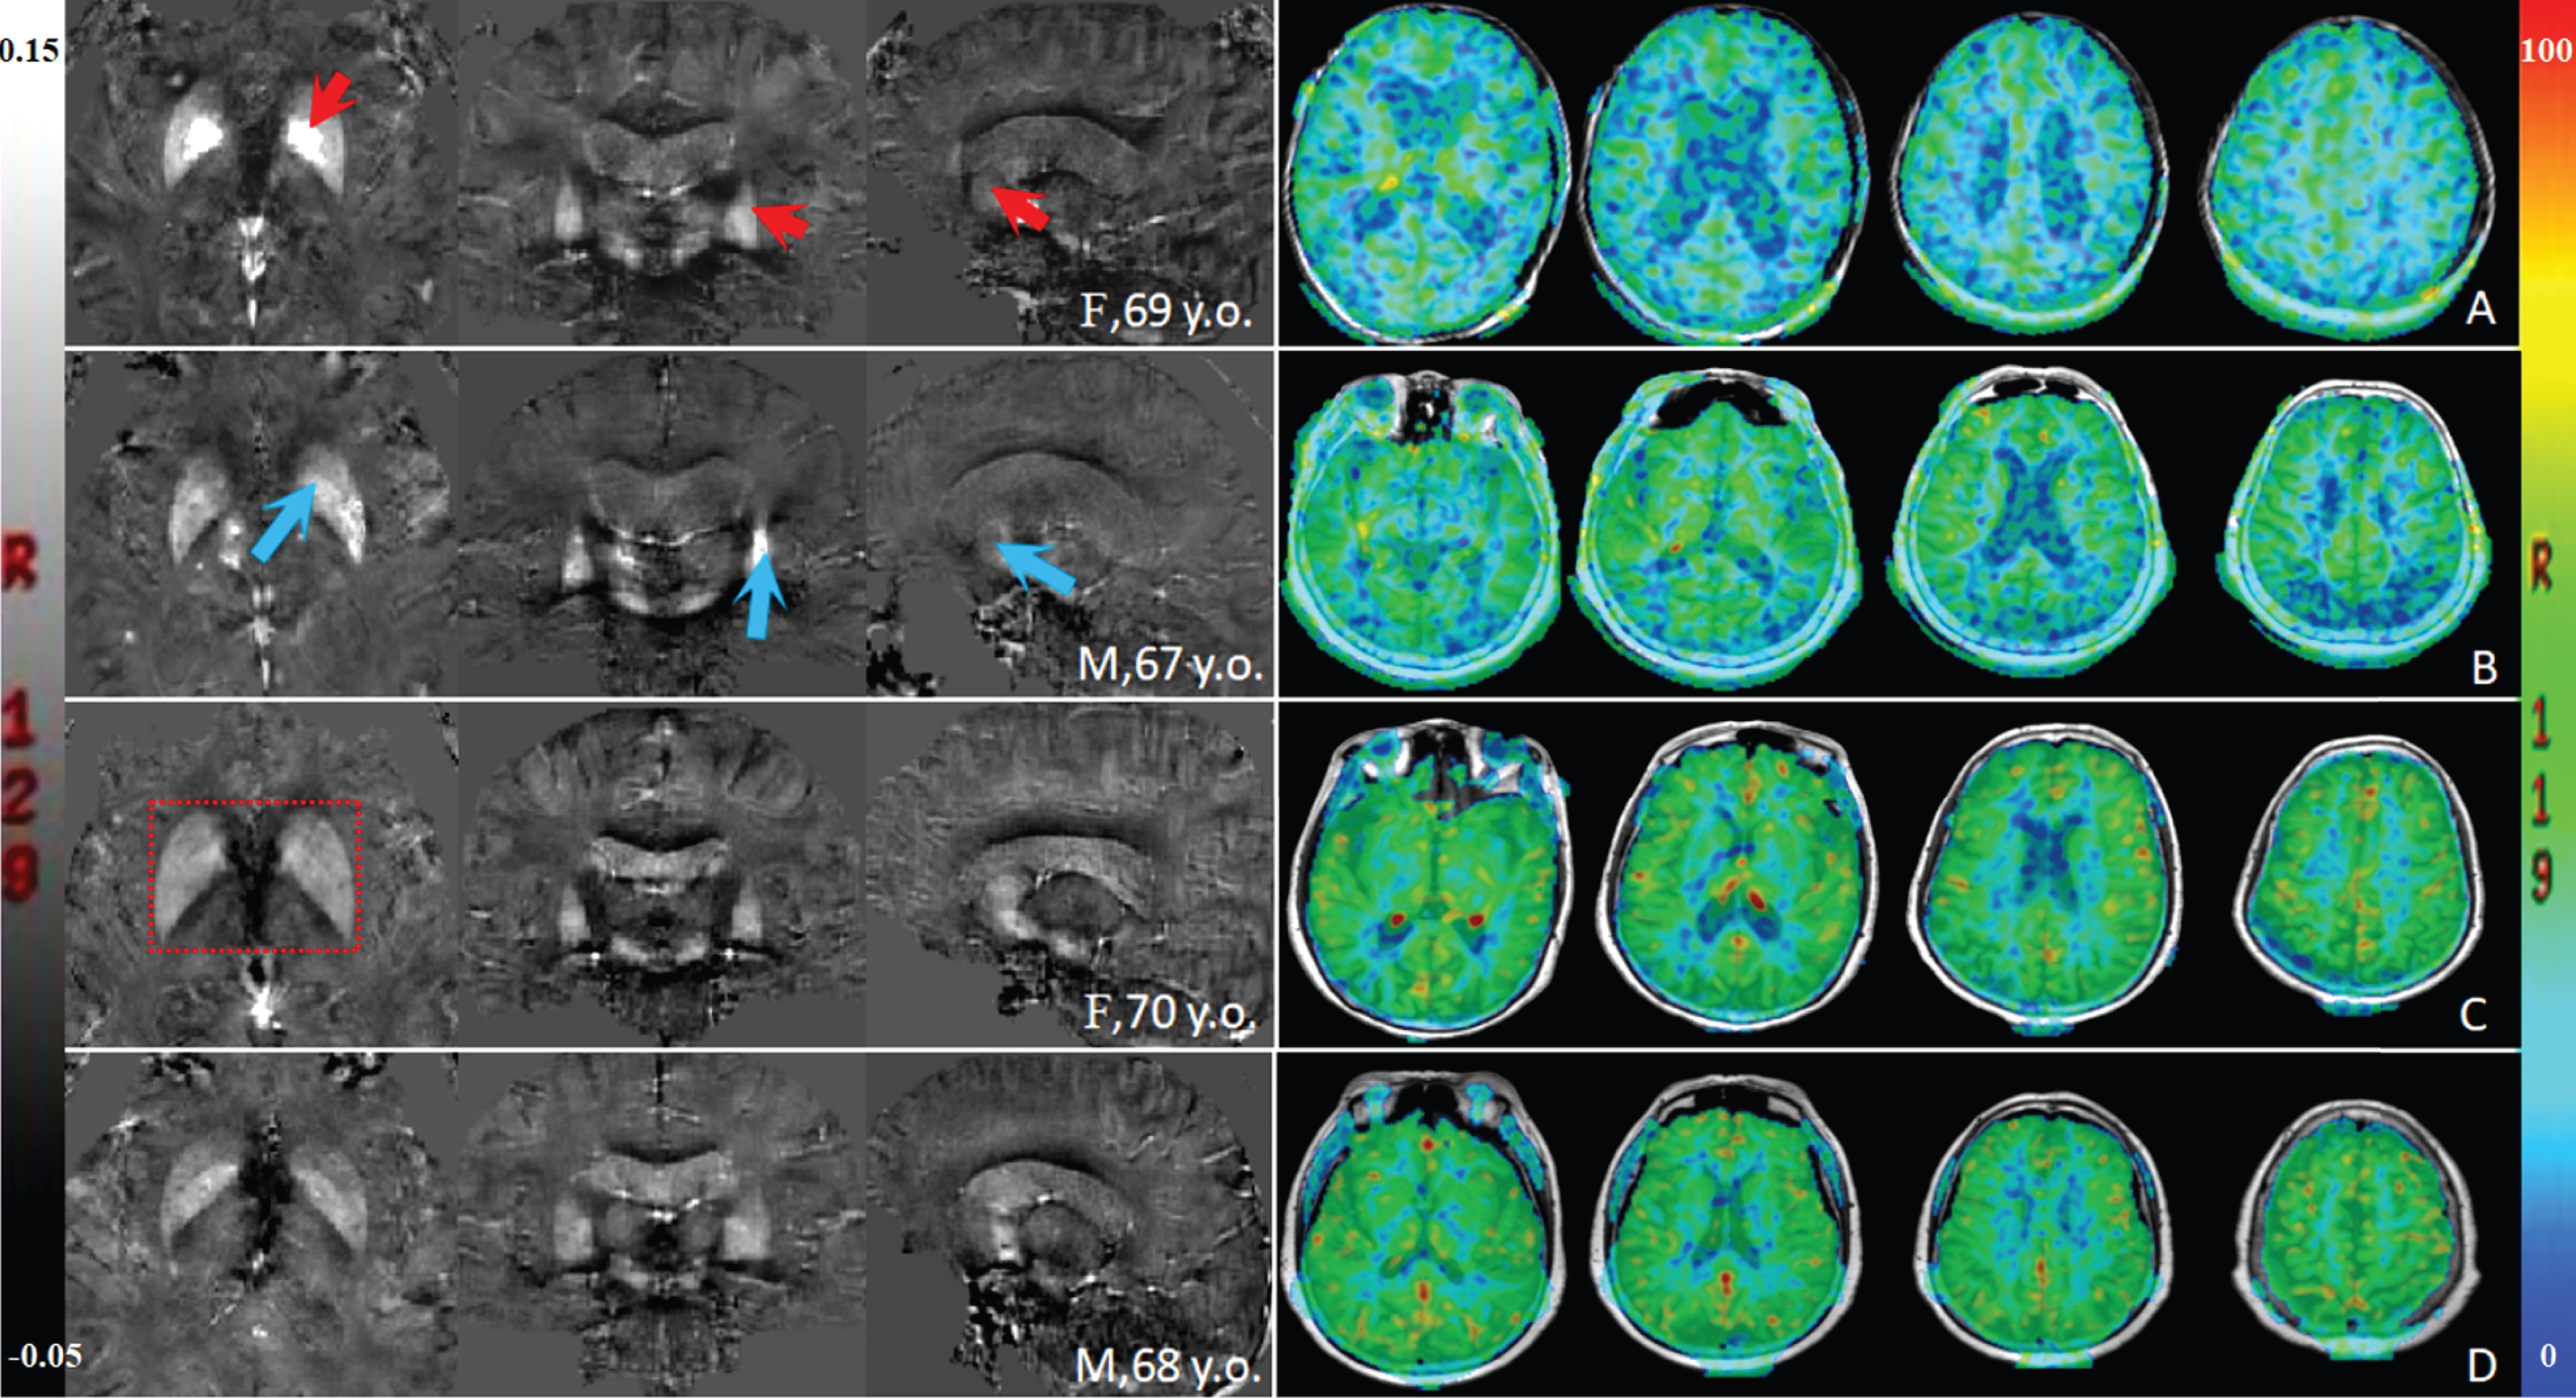
Representative axial, coronal, and sagittal quantitative susceptibility mapping (QSM) views in (A) an Alzheimer’s disease (AD) patient, (B) a mild cognitive impairment (MCI) patient, (C) a subjective cognitive decline (SCD) patient, and (D) an age-matched control subject. Arrowheads point to regions where QSM increases in A and B, that is, globus pallidus (axial view), putamen (coronal view), and caudate nucleus (sagittal view). There was no obvious visual difference between C and D, but the boundary of the basal ganglia nucleus in C was not clear (red box), indicating an increase in the iron content. On the right is the corresponding cerebral blood flow (CBF) image of the subject on the left. Visually, it could be intuitively shown that A and B views (axial) had decreased blood perfusion in multiple brain regions compared to the C and D views, with A showing a more marked reduction. F, female; M, male; y.o., years old.
Correlation analysis
No correlation between the CBF or QSM values and gender was observed in each group (p > 0.05). No correlation in all of the indicators was observed in the NC group (p > 0.05). The CBF values for thalamus in the AD group was negatively correlated with age (r =–0.562, p = 0.006) (Fig. 4a), while it was positively correlated with the MoCA score in the hippocampus (r = 0.584, p = 0.007) (Fig. 4b). The CBF values for the hippocampus in the MCI group positively correlated with the MMSE score (r = 0.595, p = 0.006) and MoCA score (r = 0.689, p = 0.001) (Fig. 4c). Similarly, the QSM values for the hippocampus in the AD group was negatively correlated with the MoCA score (r = –0.728, p < 0.001) (Fig. 4d), while it was positively correlated with age in the globus pallidus (r = 0.636, p = 0.001) and putamen (r = 0.658, p = 0.001) (Fig. 4e). The QSM values in the MCI group for globus pallidus (r = 0.531, p = 0.011), and hippocampus (r = 0.516, p = 0.014) were positively correlated with age (Fig. 4f). Finally, the QSM values in the SCD group for thalamus (r = 0.421, p = 0.036) was positively correlated with age (Fig. 4g).
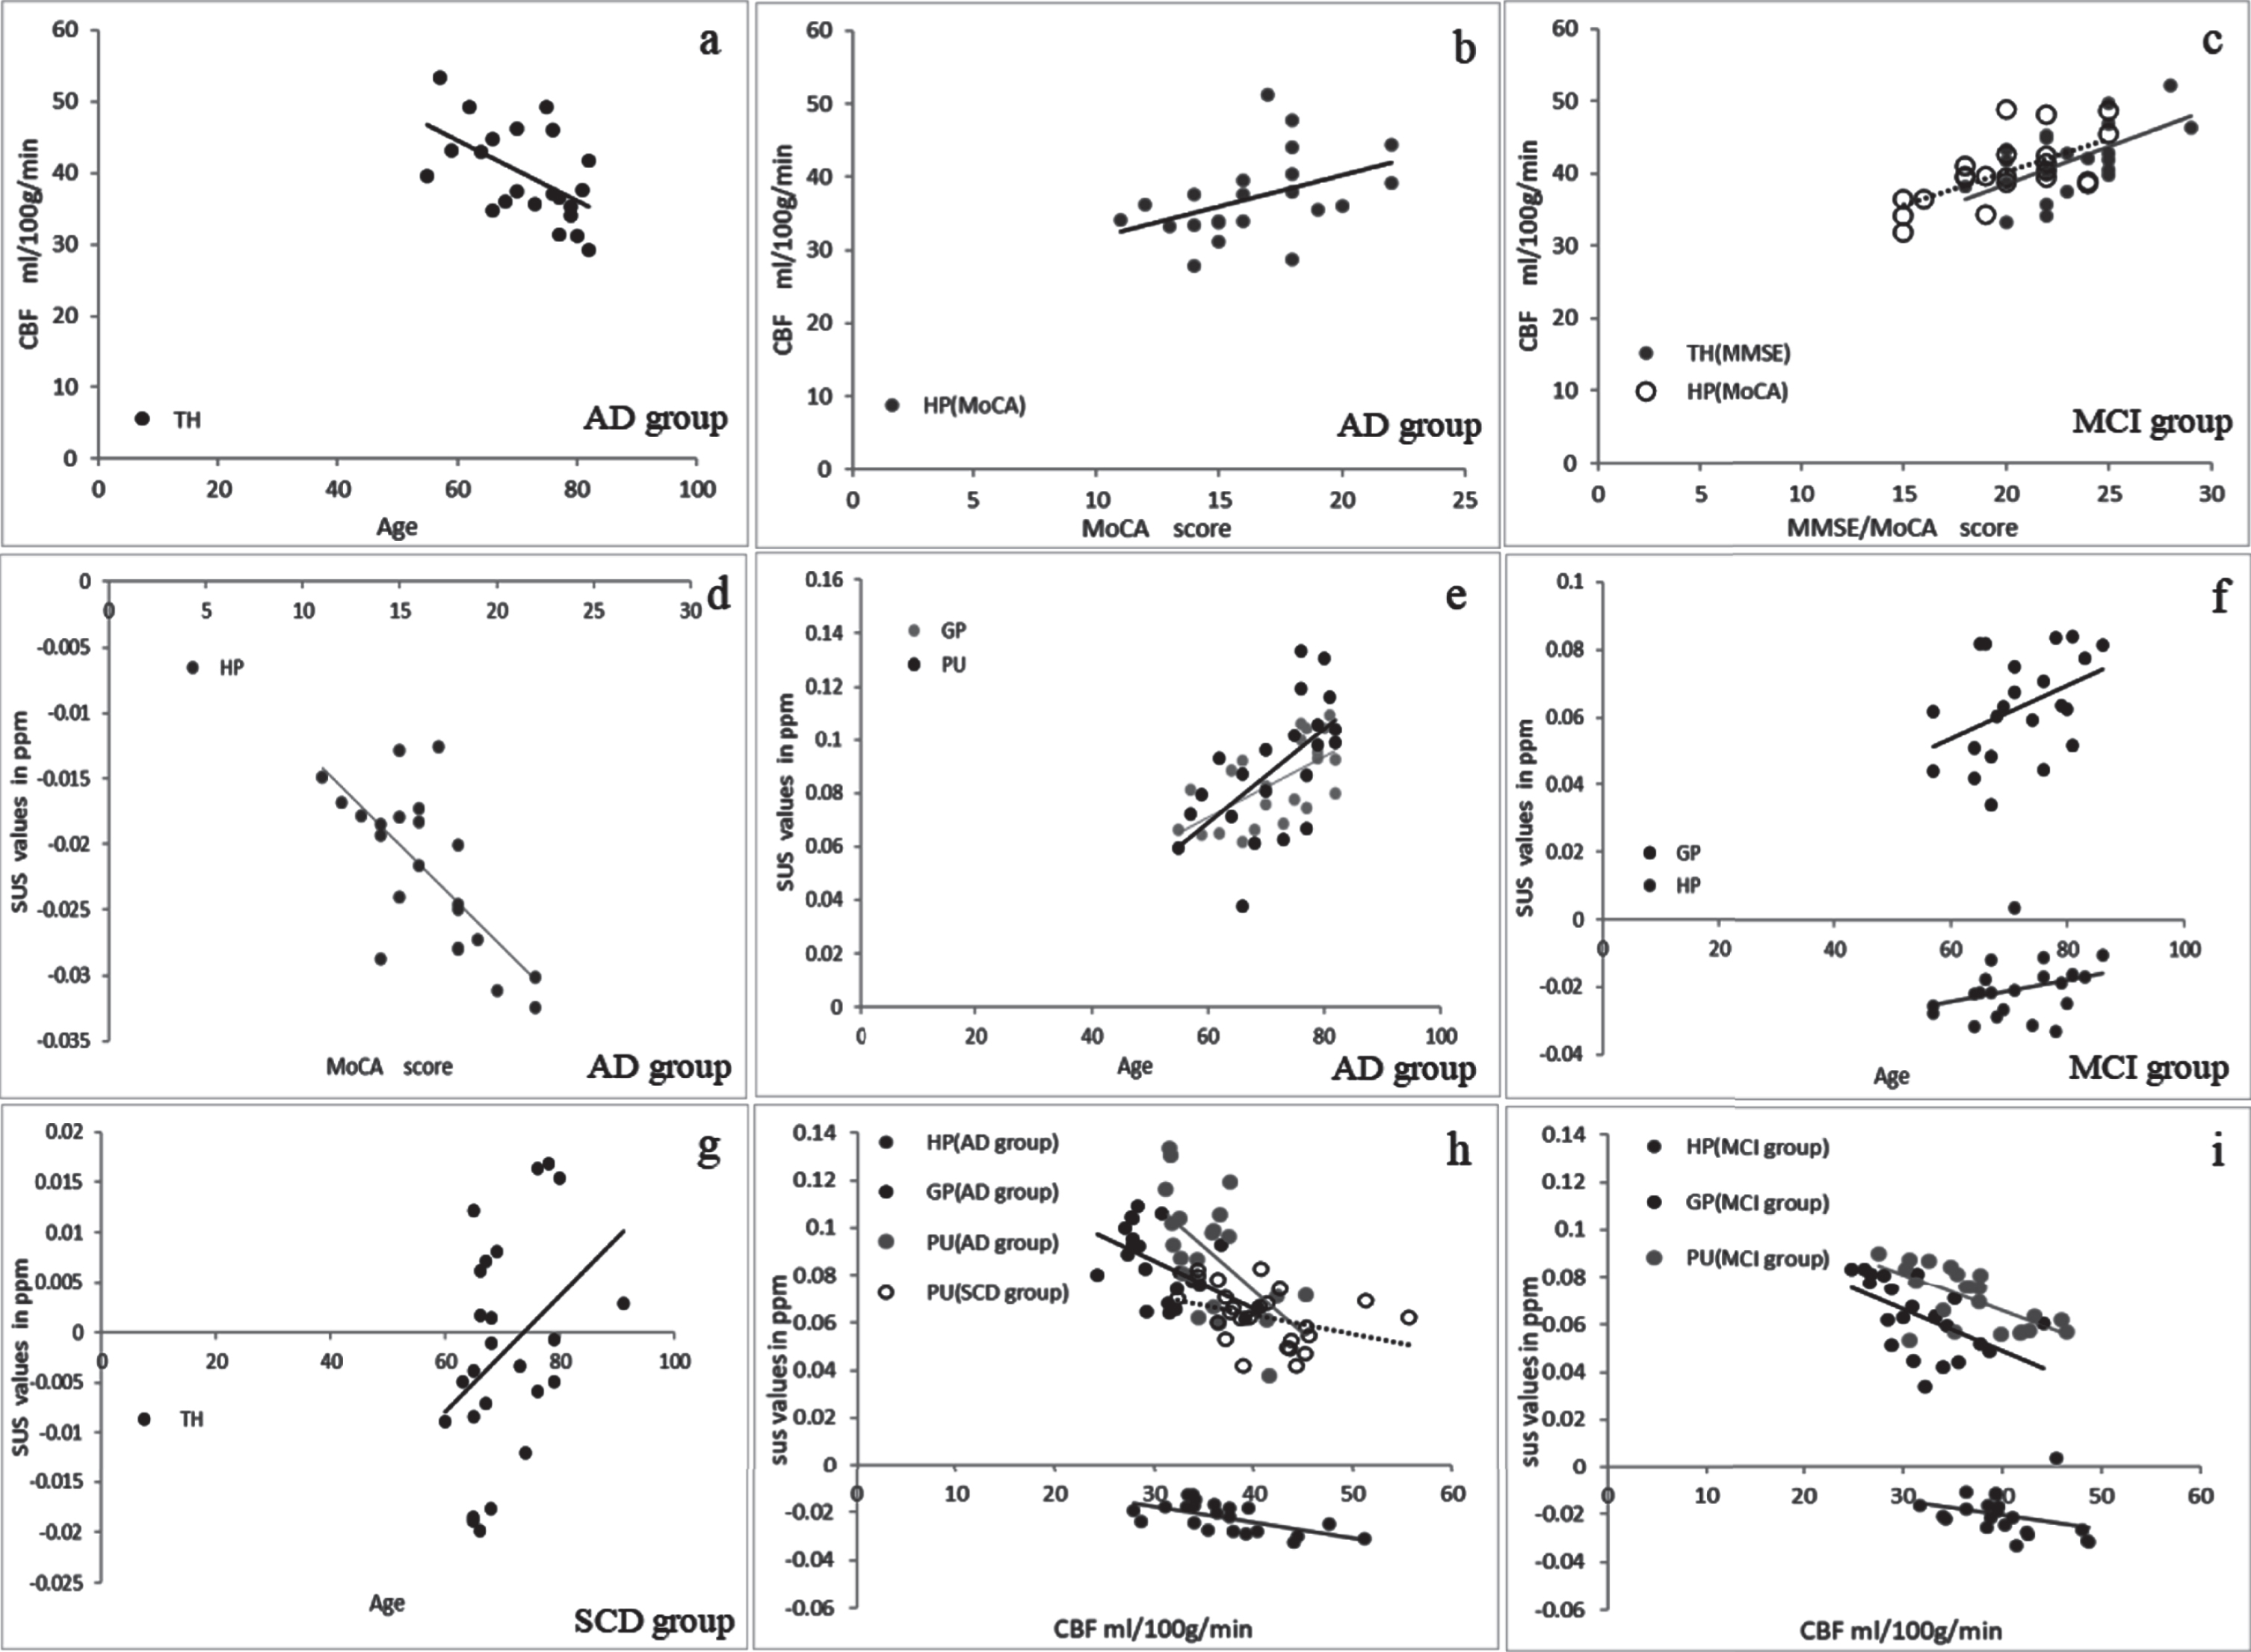
Correlation analysis scatter between CBF and QSM values. At different stages of AD, in multiple brain regions, CBF values was negatively correlated with age and positively correlated with the scale score; QSM values was positively correlated with age, but negatively correlated with the scale score; CBF was negatively correlated with QSM, while the PU was the common ROI of the three study groups. AD = 22 cases; MCI = 22 cases; SCD = 25 cases. SUS, susceptibility (QSM values; ppm = parts per million); CBF, cerebral blood flow (values; ml/100 g/min); HP, hippocampus; GP, globus pallidus; PU, putamen; TH, thalamus.
In addition, significantly negative correlation between the CBF and QSM values was noted for the hippocampus (r = –0.671, p = 0.001), globus pallidus (r = –0.457, p = 0.043), and putamen (r = –0.531, p = 0.016) in the AD group and for the putamen (r = –0.475, p = 0.017) in the SCD group (Fig. 4h). Similar observations were observed for globus pallidus (r = –0.509, p = 0.022) and putamen (r = –0.656, p = 0.002) in the MCI group (Fig. 4i).
The receiver operating characteristic curve analysis
Table 3 lists the results of ROC curve analysis of the CBF and QSM values obtained from eight ROIs in subjects with NC, SCD, MCI, and AD. The CBF values of multiple ROIs were able to differentiate the NC subjects from AD.
Results of ROC curves analysis of CBF and QSM values obtained from the eight regions of interest (ROIs) in the subjects with AD (n = 22), MCI (n = 22), SCD (n = 25), and NC (n = 25) subjects. ROC, receiver operating characteristic; AUC, area under curve; CBF, cerebral blood flow; QSM, quantitative susceptibility mapping; SE, sensitivity; SP, specificity; p, p-value; p*, Bonferroni correction was applied, p = 0.05
Figure 5A summarizes the results of ROC curve analysis of the CBF values obtained from the representative hypoperfusion regions, including the hippocampus (AUC = 0.927), caudate nucleus (AUC = 0.911), and putamen (AUC = 0.896). Also, the CBF values only in the thalamus were able to differentiate the NC subjects from SCD (AUC = 0.838, p < 0.001), and the CBF value in the SCD groups was higher than in NC; the CBF values in multiple ROIs were able to differentiate the NC subjects from MCI, SCD subjects from AD, and SCD subjects from MCI.

A) Results of ROC curve analysis of CBF values. B) QSM values obtained from the special region-of-interests (ROIs) to differentiate Alzheimer’s disease (AD) subjects from normal control (NC) subjects. C, D) Results of comparison of ROC curves between QSM and CBF at the specific regions. A and B show the significant results in ROC curve analysis of CBF and QSM data in the representative hypoperfusion regions and the iron deposition regions, respectively. C and D show the result of comparison of ROC curves to compare QSM and CBF in the putamen and the thalamus, respectively. HP, hippocampus; GP, globus pallidus; CA, caudate nucleus; PU, putamen; TH, thalamus.
Similarly, the QSM values in globus pallidus, putamen, and caudate nucleus can differentiate the NC subjects from the others (p≤0.001). Figure 5B summarizes the results of the ROC curve analysis of QSM values obtained from the above iron deposition regions. Also, the QSM values in globus pallidus and putamen can differentiate the SCD subjects from AD, and the MCI subjects from AD.
In addition, AUC values in the putamen were greater in QSM (0.904, p < 0.001) than in CBF (0.674, p = 0.341) measurements, which helped differentiate the SCD subjects from NC (Fig. 5C). AUC values in the thalamus were greater in CBF (0.838, p < 0.001) than in QSM (0.549, p > 0.05) measurements, which helped differentiate the SCD subjects from NC (Fig. 5D).
DISCUSSION
This study found evidence for tissue CBF reduction and the increase in iron deposition in specific brain regions during the progression of AD. Notably, the CBF in the hippocampus, putamen, and caudate nucleus reduced and the iron deposition in the putamen and globus pallidus increased with the progression of AD. Putamen was found to be the only region with increased iron deposition and decreased blood perfusion during the different stages of AD, and the increased magnetic susceptibility (QSM values) correlated with ASL metrics (CBF values). However, in the early stages of the disease, the blood flow increased in the thalamus. By using the ROC curve, it was found that the CBF and QSM values in specific brain regions were better measures to differentiate the other groups from the NC group. In addition, along with the decrease in the MMSE or MoCA scores, we found that the blood flow decreased and iron content increased in the hippocampus during the progression of AD.
CBF values decreased and QSM values increased in certain brain regions as expected, which was based on the decrease of blood perfusion caused by vascular risk factors (vascular wall damage) and the increase of free iron caused by oxidative stress (free radical damage) [24, 25]. These studies indicate that vascular wall damage and increased free iron are the earliest pathologic events in AD, and the two may not exist independently. Increased ferritin levels can be found in amyloid deposits and entangled nerve fiber nodes deposited in AD patients, a phenomenon that occurs primarily in the basal ganglia [8, 9]. Similarly, vascular injury can reduce the threshold of cognitive impairment [4, 26] and accelerate the progress of dementia. Therefore, measurements of CBF by ASL and susceptibility values by QSM may provide evidence for AD pathology. Our results extend these findings and demonstrate that CBF abnormalities in the hippocampus and QSM abnormalities in the basal ganglia in AD can be detected using an area of interest method.
Previous ASL work in AD demonstrated that brain function abnormalities predated structural abnormalities, and CBF value changes occur before cerebral blood volume changes [27]. Furthermore, these changes are more sensitive than atrophic changes in the brain tissue. In our study about cerebral perfusion evaluation using 3D-ASL, the CBF in multiple regions decreased in patients with AD and MCI compared to the control subjects. These results are concordant with other AD imaging findings in showing that cerebral perfusion decreases gradually with the progression of AD [6, 7]. However, CBF values for the thalamus in SCD were significantly higher than in NC. This result was similar to the previous findings that showed that increased perfusion in certain regions with AD was due to the compensatory effect on blood flow [5, 28]. Nevertheless, in the AD and MCI subjects, CBF values in the thalamus decreased. Based on the fact that SCD is a preclinical stage of AD with a high risk of AD in the future, we believe that the increased perfusion in the thalamus is a compensatory effect of changes in blood flow; this effect goes away as the disease further progresses. With the progression of disease, the decrease of vascular injury and vascular bed would inevitably lead to the decrease in blood perfusion. However, the exact pathophysiological mechanism needs to be further investigated.
In our study, we found that the QSM values was the highest for the globus pallidus and was the lowest for the hippocampus in the NC group, which indicates that the distribution of iron in different brain regions varies [29–31]. However, in the study subjects, QSM values was the highest in the putamen, which indicates that iron deposition during progression of AD is not similar to iron deposition in normal elderly brains, and putamen in AD patients may be susceptible to iron deposition. This observation is similar to a previous study [8] that showed that QSM values in the putamen can be used as imaging biomarkers for the diagnosis of AD. In addition, we found the QSM values for putamen and globus pallidus gradually increased in the SCD, MCI, and AD groups, with the iron deposition increasing gradually with the progression of the disease, indicating that they were the main regions for iron deposition. Interestingly, whether it is the study group or the NC group, the QSM values in several ROIs including the temporal cortex were reverse of the values in the nucleus of basal ganglia, that is, the values were more negative, indicating a shift toward greater diamagnetism. However, studies by Ayton et al. have shown elevated levels of iron in the temporal lobe [32, 33]. In this study, the QSM values in several ROIs were negative. It may be caused by the accumulation of non-paramagnetic material (e.g., proteinopathy in tissue with AD neuropathology), or it may be related to the properties of tissue structure (e.g., hippocampus) [34], but the mechanism is still unclear.
Correlation analysis showed that QSM values in the putamen were negatively correlated with CBF values in the study subjects. It is possible that vascular injury leads to the leakage of ferritin as well as deposition of hemosiderin between tissues, while the increase of free iron leads to further damage of vascular wall through peroxidation stress reaction. These results are consistent with the pathology of AD, as described before [24, 25]. In addition, we found that CBF and QSM values in the hippocampus was significantly correlated with the scale score in the AD and MCI groups, indicating that perfusion reduction or iron deposition in this region may reflect the severity of the disease to some extent. This is consistent with the functional basis of the hippocampus as the memory center. This observation is similar to the result of previous study that showed that cerebral perfusion changes measured by ASL were related to the severity of the disease [35]. Therefore, the measurement of CBF values by ASL and susceptibility values by QSM is significant to estimate the severity of the disease.
A previous study [36] has shown that the ASL perfusion maps can be used for classification and predictive diagnosis of AD disease stages with good accuracy by using the ROC curve for disease prediction. Kim [37] proposed that the susceptibility values measured by QSM can be used to separate the MCI subjects from NC group, which is important for early diagnosis of AD. Our study further confirmed these results. By analyzing the ROC curve, we found that CBF or QSM values of specific brain regions can differentiate the study subjects from the NC group and can differentiate between the study groups as well. Therefore, quantitative measurement of ASL and QSM technology is important for early diagnosis of AD and the classification of disease course.
In addition, ASL has been widely used to horizontally assess CBF in patients with AD and MCI, and the results showed decreased blood flow perfusion in multiple brain regions, including cerebral hemisphere and hippocampus, which was more significant with AD [38]. Studies have shown that CBF increases in some brain areas with AD and MCI, such as hippocampus and basal ganglia [39], but some scholars have pointed out that CBF decreases in putamen in patients with MCI and SCD [40]. They believed that high perfusion was a disorder of CBF caused by neurodegenerative changes, and that high perfusion in some brain regions might be related to the neurocompensatory mechanism of MCI and early cognitive decline in AD. However, some scholars believe that the above results may be affected by demographic characteristics, inclusion criteria and CBF measurement methods [41]. Our study showed increased thalamic perfusion and decreased basal ganglia perfusion (e.g., putamen). We believe that increased thalamic perfusion is a function of early blood flow compensation, which has been discussed in detail above and will not be repeated. Decreased perfusion of basal ganglia in AD may be a manifestation of decompensation of neurovascular units, and may be related to iron deposition (QSM values in the putamen were negatively correlated with CBF values). It is possible that vascular injury leads to the leakage of ferritin as well as deposition of hemosiderin between tissues, while the increase of free iron leads to further damage of vascular wall through peroxidation stress reaction. However, the exact pathophysiological mechanism needs to be further investigated.
Our study has some limitations. First, the results of the standardized methods that use MATLAB are more accurate and objective. In the process of image registration, manual correction was carried out, but some errors were inevitable. Second, we were unable to establish ASL and QSM correlates to clinical severity measures because of the narrow spread of severity scores for our patient cohort. Moreover, although SCD subjects were enrolled by referring to the consensus of Chinese experts, the evaluation of effective and specific neuropsychiatric scale is lacking at present. We hope that there will be special assistance for SCD enrollment in the future to improve its accuracy and specificity.
In conclusion, we found excessive iron deposition in the basal ganglia and extensive decreased CBF during progression of AD. Increased iron deposition in the putamen was accompanied by decreased blood perfusion throughout the whole course of AD, and QSM detection of iron overload in the putamen may be an imaging biomarker for the early diagnosis of AD. CBF and QSM values for the specific brain region are valuable in the predictive diagnosis of AD and in quantifying the progression of the disease. The CBF and iron deposition metabolism in the hippocampus may be related to the severity of the disease and may be used as one of the indicators for monitoring the disease progression.
Footnotes
ACKNOWLEDGMENTS
The study was supported by the National Natural Science Foundation of China (No. 81960314), the Science and Technology Foundation of Guizhou Province (QKHZC [2019]2810), (QKHPTRC[2019]5803), and (QKHPTRC [2017]5724), the Guizhou Provincial People’s Hospital Doctoral Foundation (GZSYBS [2015]02), the Guizhou Science and Technology Department Key lab. Project (QKF [2017]25), and NHC Key Laboratory of Pulmonary Immunological Diseases, Guizhou Provincial People’s Hospital.