



Abstract
Recently, many software companies have shifted to shorter release cycles from the traditional multi-month release cycle. Evolution and transition of release cycles may affect the test effort in the system. This paper analyses 25 traditional releases containing 1210 classes and 69 rapid releases containing 2616 classes of four Open Source Java systems. Correlations between 48 Object Oriented metrics and 2 test metrics were evaluated to identify the best indicators of test effort. The results show that (i) correlation between OO and test metrics remain irrespective of release models, (ii) test effort required in Rapid Release (RR) models (shorter release cycles) is slightly more as compared to Traditional Release (TR) models, (iii) Out of 18 machine learning algorithms instance based machine learning algorithms IBK and K star followed by Multi-Layer Perceptron (MLP) and additive regression are able to predict the test effort accurately in classes.
Introduction
Agile methodologies like XP instituted the notion of shorter or faster or rapid release cycles and advocate the benefits of using them for both companies and customers [13, 32]. Soaring market competition have forced many software companies to exercise shorter release cycles and release their products within a span of weeks or days [35]. Shorter release cycles cater many advantages to organizations as well as end users [32]. These shorter cycles enable faster customer feedback thereby allowing companies to schedule their succeeding releases more easily and doesn’t force the developer to complete the entire feature at one go. The components can be published in incremental releases allowing the developer to pay more attention to quality assurance [26], resulting in faster bug detection and correction [6]. Moreover, developers are not bustled to complete features because of an upcoming release date and can concentrate on quality assurance every 6 weeks instead of every couple of months. Customers are also benefited, as they can obtain new features, bug fixes and security updates faster. Consequently, shorter release cycles have been adapted in many software and embedded domains [14]. Mozilla Firefox migrated to Rapid Release (RR) concept after facing huge competition from Google Chrome. It shifted from its Traditional Release (TR) model of one year for a major release to 6 weeks from version 5.0 [34]. A recent study [32] analyzed release patterns in mobile domain and found that frequently updated mobile applications (i.e. shorter release cycles) on Google play store, were highly favored by the users, irrespective of their high update frequency [32]. In fact, updated versions were accepted more quickly by the users worldwide [26]. On the other hand, organizations lack time to stabilize their platforms resulting in increased customer support costs due to frequent upgrades [5].
However, transitions to shorter release cycles may affect the test effort of an application. Therefore, an investigation in this domain would yield new facets in research.
Related work
With the rise of agile methodologies, more and more projects are shifting to faster and shorter release cycles [4, 34]. Otte et al. [35] analyzed Open Source projects and found that more than 50 percent of the projects published at least one release per month. Kuppuswami et al. [30] and Marschall [25] both evaluated the development effort required in shorter release cycles and found contradicting results. A similar trend was observed for bug fix time. While some studies advocated faster bug fix time in shorter release cycles [5, 6], Baysal et al. [27] found median time to fix bugs around 2 weeks faster in TR systems. The current work analyzes and compares test effort required in TR and RR models using OO and test metrics. To the best of our knowledge, not study till date has analyzed release models this way.
Bruntink and Van Deursen [21, 22] and Leon et al. [24] analyzed testability using OO metrics and found positive relationship between OO and test metrics but they didn’t use the results to predict test effort in classes. Aggarwal et al. [15] and Singh and Saha [37] implemented OO metrics to predict the test effort in classes using neural networks. Badri et al. [16, 17] investigated the relationship between single OO metric, Lack of Cohesion method (LCOM) with JUnit test cases and found positive results. Badri et al. [19] used OO metrics and predicted test effort using linear regression. Later, Toure et al. [7] analyzed unit test effort using 5 OO metrics and further implemented Principal Component Analysis (PCA) to learn the orthogonal dimensions observed by their selected suite of unit test case metrics. In a recent study, Badri et al. [20] investigated the test code size using use case metrics and 6 machine learning algorithms. Toure et al. [8] analyzed test metrics derived from JUnit framework to identify test effort using 3 machine learning technologies (univariate logistic regression, the univariate linear regression, and the multinomial logistic regression).
The current study analyzes testability using 48 OO metrics, analyzes their correlation and validates results using non parametric tests. The results are further used to predict test effort using 18 machine algorithms. Use of wide range of OO metrics and machine learning algorithms gives the current study an edge over other published work in this field.
Experimental study design
This section presents the experimental study design followed in the paper.
Data collection
Initially, Apache Software Foundation [2] was explored and projects written in Java language were kept in the pool for consideration. Projects meeting the selection criteria (Section 3.2) were then shortlisted for the study. In order to eliminate bias and increase generalizability, Simple Random Sampling was applied and four datasets were finally selected for the analysis. The artifacts of the selected datasets were obtained from GitHub [9] and Jira [12] (which are source and bug repositories respectively). The characteristics of the studied projects are presented in Table 1.
Characteristics of projects studied
Characteristics of projects studied
1. www.avro.apache.org, 2. www.hive.apache.org, 3. www.jclouds.apache.org, 4. www.zookeeper.apache.org. Note: Words ‘Release’ and ‘Version’ are used synonymously in the study.
While selecting the projects following criteria and assumptions were made:
Projects must be in active state and their last activity date must not be later than February 2017 Release cycles of the projects must have evolved from longer release cycles (less than six releases per year) to shorter cycles (more than six releases per year) somewhere in their lifecycle in order to study change Projects must have a development lifecycle of more than five years Projects with less than six releases* in a year were accounted under TR model phase and projects with more than six releases a year were considered to follow RR model phase.
*The time estimation of six releases/year in the paper is an attempt made to set a standard for analysis and has been used in studies in this field [5, 6]. This can be manipulated if required for other analysis.
The study also calculated the mean time of release for each dataset. The median in the box chart that divides the box into two is the mean time of the release. It can be observed from Fig. 1 that the mean time of release for TRs is way higher than RRs. The study also presents the evolution of the releases of the Zookeeper dataset over the period of time in Fig. 2. Graphs of other datasets can be obtained likewise.
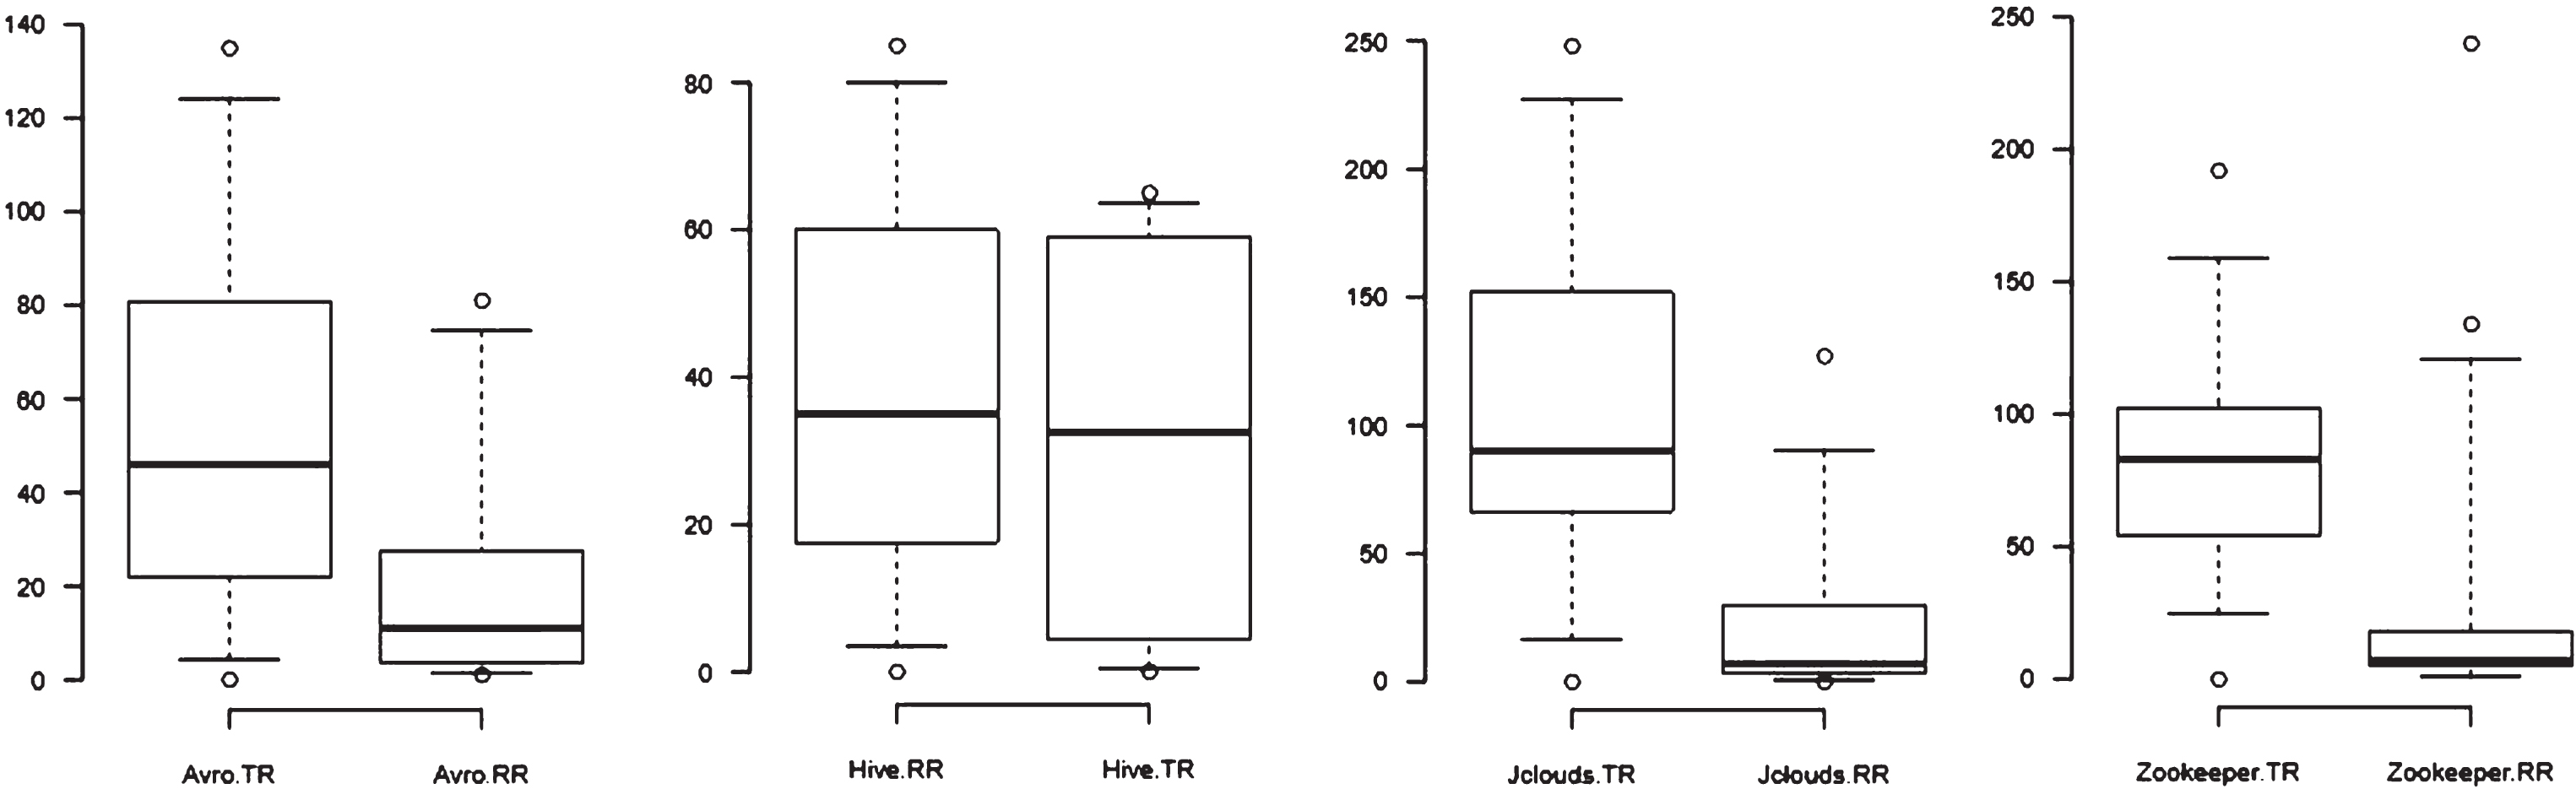
Distribution of release cycle lengths (in days) for TRs and RRs with X asis as TR and RR release and Y axis as days since previous release.
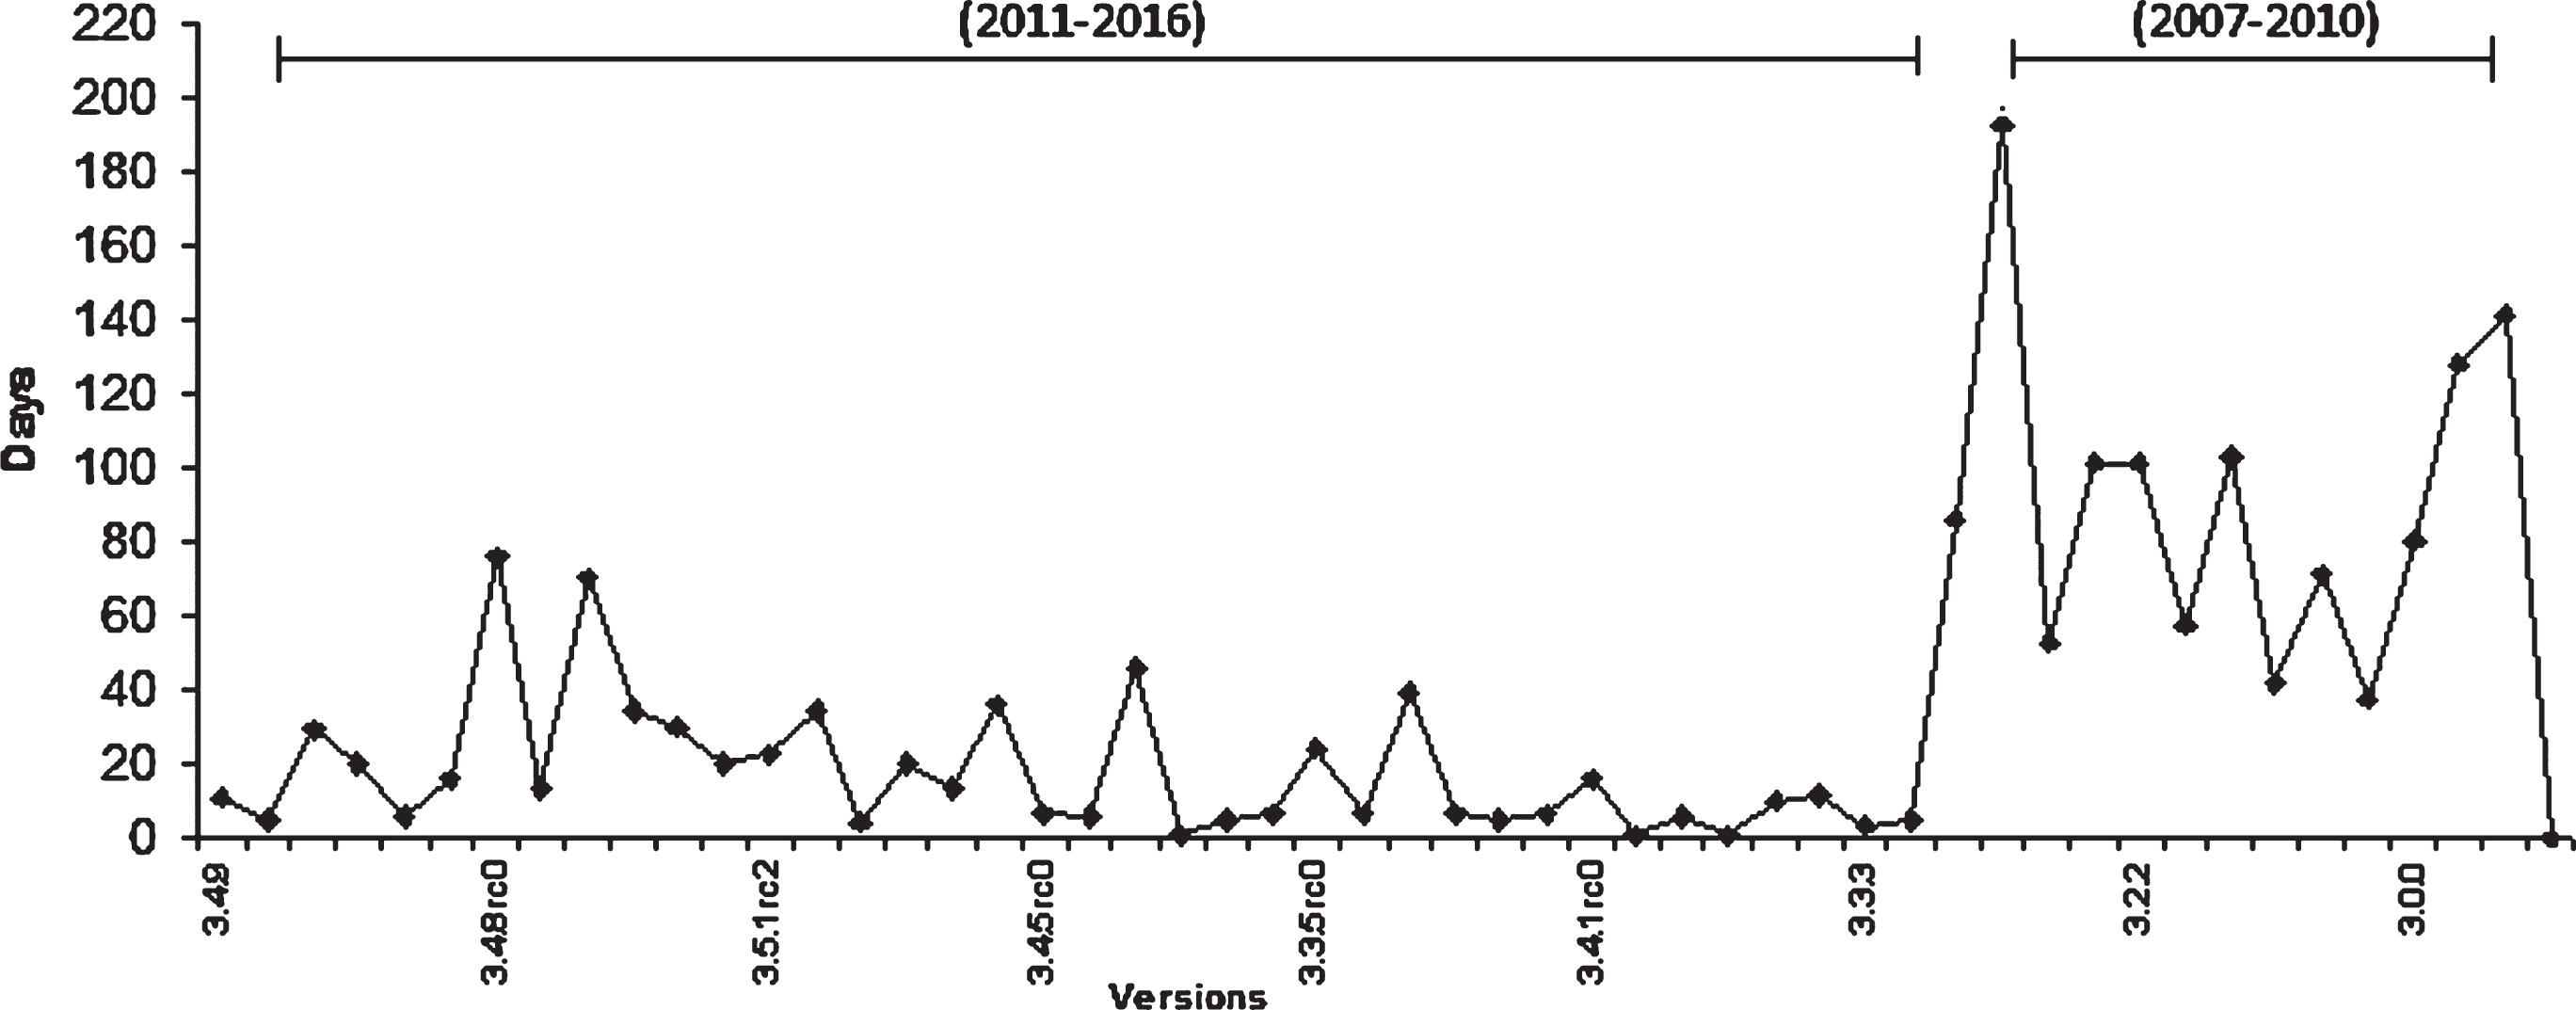
Evolution of releases in dataset ‘Zookeeper’.
The study gathered 48 OO metrics for each version of the selected dataset. These metrics were extracted using an Open Source tool – IntellijIdea [10]. This tool takes Java classes as input and produces OO metrics. Details about the tool and the metrics can be obtained from www.jetbrains.com. Table 2 presents the OO metrics used in the study.
Object Oriented metrics used in the study
Object Oriented metrics used in the study
The test metric studied in this paper includes Number of Test Cases (NOTC). This metric is computed by counting the number of times method JUnit ‘assert’ is invoked in the code of a test class. The framework JUnit enables the tester with multiple ‘assert’ methods like ‘assertEquals’, ‘assertArrayEquals’, ‘assertTrue’, ‘assertFalse’ ‘assertSame’, or ‘assertnotSame’. The functioning of this method goes as follows: the parameters which are passed to this method are checked for compliance with certain conditions depending on the particular variant. For instance, ‘assertEquals’ tests whether its parameter is equal or not. If it’s found that the parameter doesn’t meet the condition, the framework produces an exception indicating that the test has failed. Hence, counting the invocations to this ‘assert’ method helps in identifying the test cases written in the code. Therefore, the testers implement the set of JUnit ‘assert’ methods to identify the change in the expected behavior of the class. In Open Source, the naming convention followed by most of the projects for writing test classes include java class name followed or preceded by the word ‘test’. For instance, AppendFileTest, QuorumTest, TestDriver. Consequently, out of all the Java classes, only these test classes were mined for ‘assert’ methods and kept for further analysis.
Statistical analysis techniques
The current study implements non-parametric tests mentioned in Table 3 to validate the results.
Brief description of statistical tests used in the study
Brief description of statistical tests used in the study
Figure 3 presents the proposed framework for test effort estimation and prediction. This framework has majorly two sections. One is for test effort estimation for TR and RR models and the other is for test effort prediction. These are discussed in Sections 4.1 and 4.2.

Framework for test effort estimation and prediction for TR and RR models.
Test effort estimation for the TR and RR models will be obtained in the following manner
Correlation: Identify the correlation between OO metrics and test metrics (LOC, NOTC) to gaze test effort. Differentiation: Check for any difference in correlation of these metrics in TR and RR models. Filtration: Filter out metrics (OO) best correlated with test metrics for both TR and RR models. Categorization: Categorize these metrics to identify unit test effort. Repeat this step for TR and RR models individually. Compare the test effort of TR and RR models.
Correlation
The study starts the data analysis by calculating the association between the metrics using correlations. Correlations are helpful since they can reflect the predictive relationship of the variables which can be further exploited in practice. The study evaluated Spearman’s correlation since the data available is not normal (using Shapiro Wilk test [33]). The coefficient rs is computed for the dependent NOTC and LOC with 47 other independent variables gathered through IntellijIdea [10]. The coefficient rs can range from values – 1 to +1 wherein values closer to +1 indicates positive correlation while values near to – 1 indicate negative correlation. Values near to zero indicate poor correlation indicating lack of association between the variables. The study also checked the p values of the correlational results in order to confirm the significance of results. For this confidence level, 0.05 was assumed and correlations coefficient with p values>0.05 were ignored by the study. The null hypothesis thus created for Spearman correlation was
There exists no association (monotonic) among the two variables (Independent and Dependent)
In order to validate the above-mentioned hypothesis, Spearman’s coefficient of correlation was the calculated between each object oriented metrics (independent variables) with test metrics NOTC and size metric LOC (dependent variables). This step was repeated for each TR and RR version of the selected datasets. The results depicted a strong positive relationship between our test metrics and size metrics. Metrics such as STAT, SLOC, N, V, E, D, n had the highest correlation with test metric NOTC in both TR and RR models. In terms of unit testing, a larger class will bear more parameters, attributes and methods and a stronger correlational value between NOTC and size metrics points towards a greater effort during testing. A higher coupling in the class would require more testing than compared to a class with lower coupling since more classes are interdependent on each other and such classes require larger test suites. Same is the case with higher complexity and unit testing. Coupling metrics MPC and complexity metrics WMC, OSmax, OSavg, NOAC and RFC were strongly correlated to NOTC indicating that test effort would increase if values of these metrics increase. Cohesion metric LCOM was also seen moderately correlated with NOTC while Inheritance metrics were least correlated (with NOTC) category of metrics out of all the six categories (Section 3.1.3) of metrics referred in this paper. Consequently, it may be assumed that inheritance in the class though related but is not a strong predictor of test effort in the class when compared to other metrics.
Similarly, size metrics and Halstead metrics had a strong positive correlation with LOC. Complexity metrics CSOA, CSO, OCmax, OCavg, OSmax, OSavg, NOAC and coupling metrics CBO and MPC too had a significantly positive correlation with LOC. Inheritance metrics Dcy, DIT, level and Dpt were moderately correlated with average mean correlational value as 3.57 and p value < 0.05. The results are obvious since all these metrics are derived out of lines of code of the class only. A greater LOC would mean a greater coupling, complexity, inheritance and size of the application. The results indicate that there does exist strong correlation among few variables which drive the study to reject the null hypothesis and accept the alternative hypothesis indicating that there does exist an association between independent and dependent variables.
Differentiation
The variability in correlation among metrics is assessed through Friedman Test. Freidman test is a non-parametric test implemented to test for differences between groups and ranks them with best performing variable as rank 1, the next best rank as 2 and so on [11]. For the study, the Friedman Test will allocate a mean rank to all the metrics based on their correlational values which are ascertained through Spearman Correlation. The test then compares the average ranks thus provided and calculates the statistics using the Equation 1 [29]:
Where, K = number of datasets R = rank allocated to ith variable
The results will be checked at the 0.5 significance level and the null hypothesis for the test can be drawn as follows:
There exists no significant difference between correlations of the metrics
The test was run on the correlational results obtained between OO metrics and dependent test metric NOTC in SPSS. The results of TR phase and RR phase are presented separately in respectively. It may be observed that the significance values of both TR (Table 4) and RR models (Table 5) for Nemenyi test was found to be less than the threshold value, 0.05. Hence, the study rejects the null hypothesis and accept the alternative hypothesis stating that there exists a significant difference between the correlational values of the shortlisted metrics. Post hoc analysis after Friedman Test [16] is advisable if the results obtained are significant at p value. Wilcoxon signed ranks test for pairwise comparison is a commonly applied test post-Friedman test but the test doesn’t account for family wise error if the Bonferroni correction is not performed. Demsar [11] and Lessmann et al. [31] on the other hand propose Nemenyi Test for comparing pair-wise difference post-Friedman Test since it takes care of the family wise error as well. Nemenyi test is used to compare all the classifiers with each other. The performance is assumed to be significantly different of the comparing classifiers if the corresponding mean rank differs by at least the criticaldifference.
Result of Friedman’s test on traditional releases
Result of Friedman’s test on rapid releases
This Critical Difference (CD) is computed by Equation 2:
The CD of both the TR and RR models was computed and Nemenyi test was applied with confidence level 95%. If the variability between two classifiers is observed less than the value of CD, then it is assumed that there exists no significant difference in 95% confidence interval, else, the difference exists [11]. The CD for TR and RR was observed as 3.967 and 2.388 respectively. It was found in TR models, the metric LOC outperformed all the metrics in terms of correlation (with NOTC). N, E, STAT, SLOC, V stood next but all of them were statistically indistinguishable from LOC, as observed in Fig. 5. Coupling metric MPC and complexity metrics WMC and NOAC not only ranked in the top but also demonstrated statistically significant difference too. Metrics LOC, WMC, NOAC and MPC were finally observed as the statistically most distinguished and correlated set of metrics with test metric NOTC in both TR and RR models. Since the metrics following top 15 were less powerful in terms of correlation, graph displaying results of Nemenyi test in TR and RR models are presented in Figs. 4 and 5 respectively.
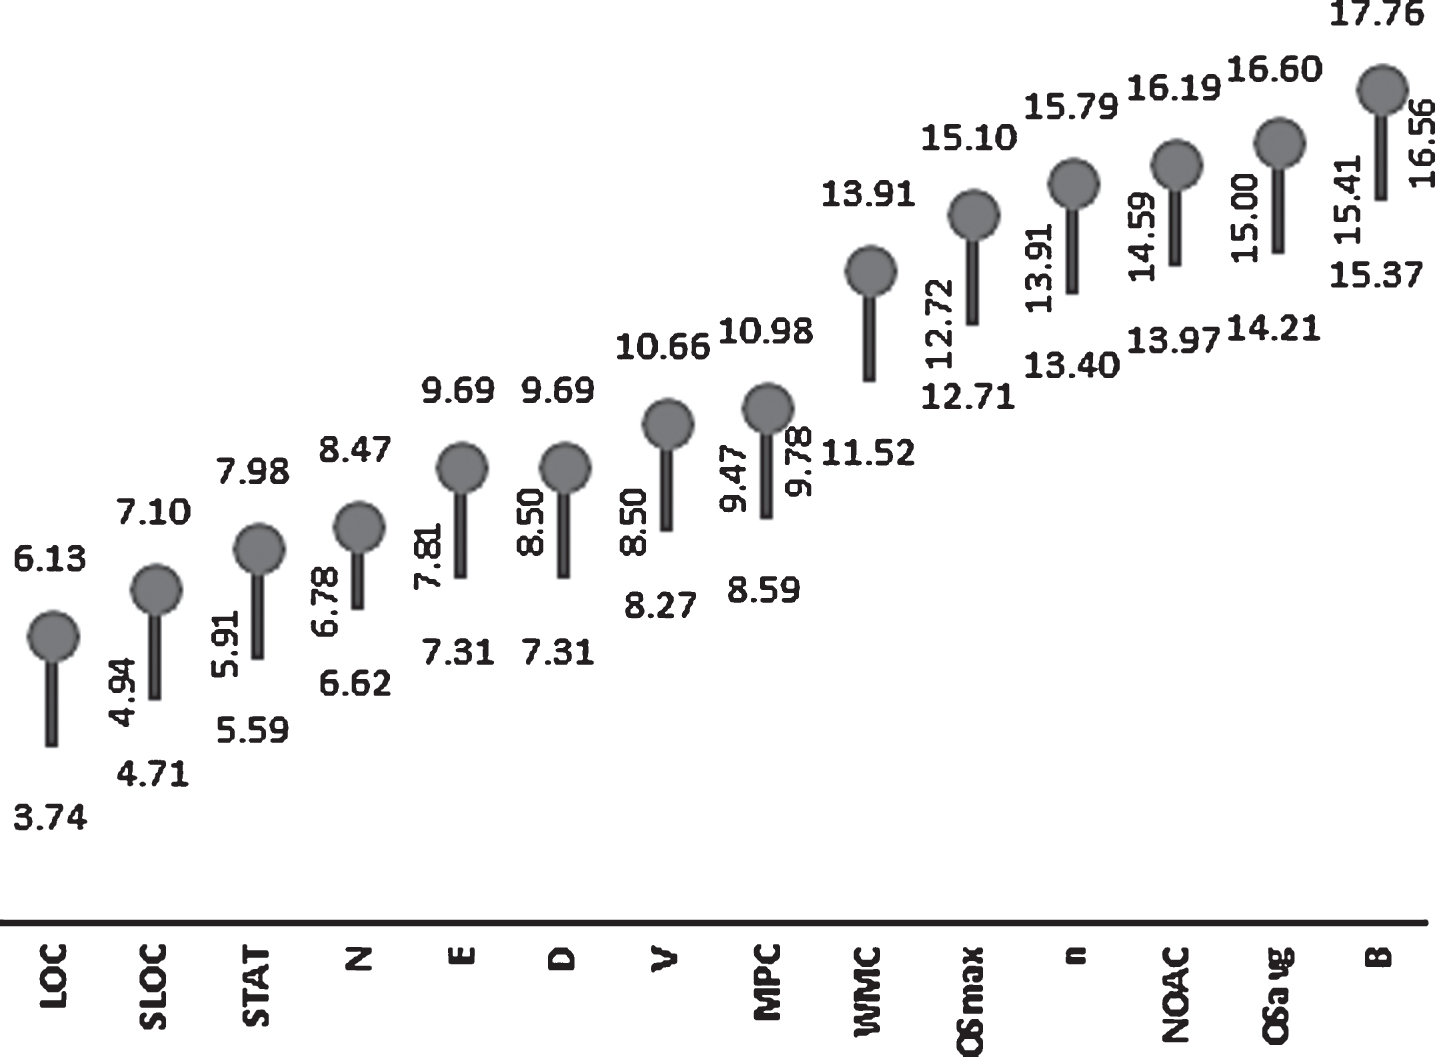
Graph displaying results of Nemenyi Test for RR.
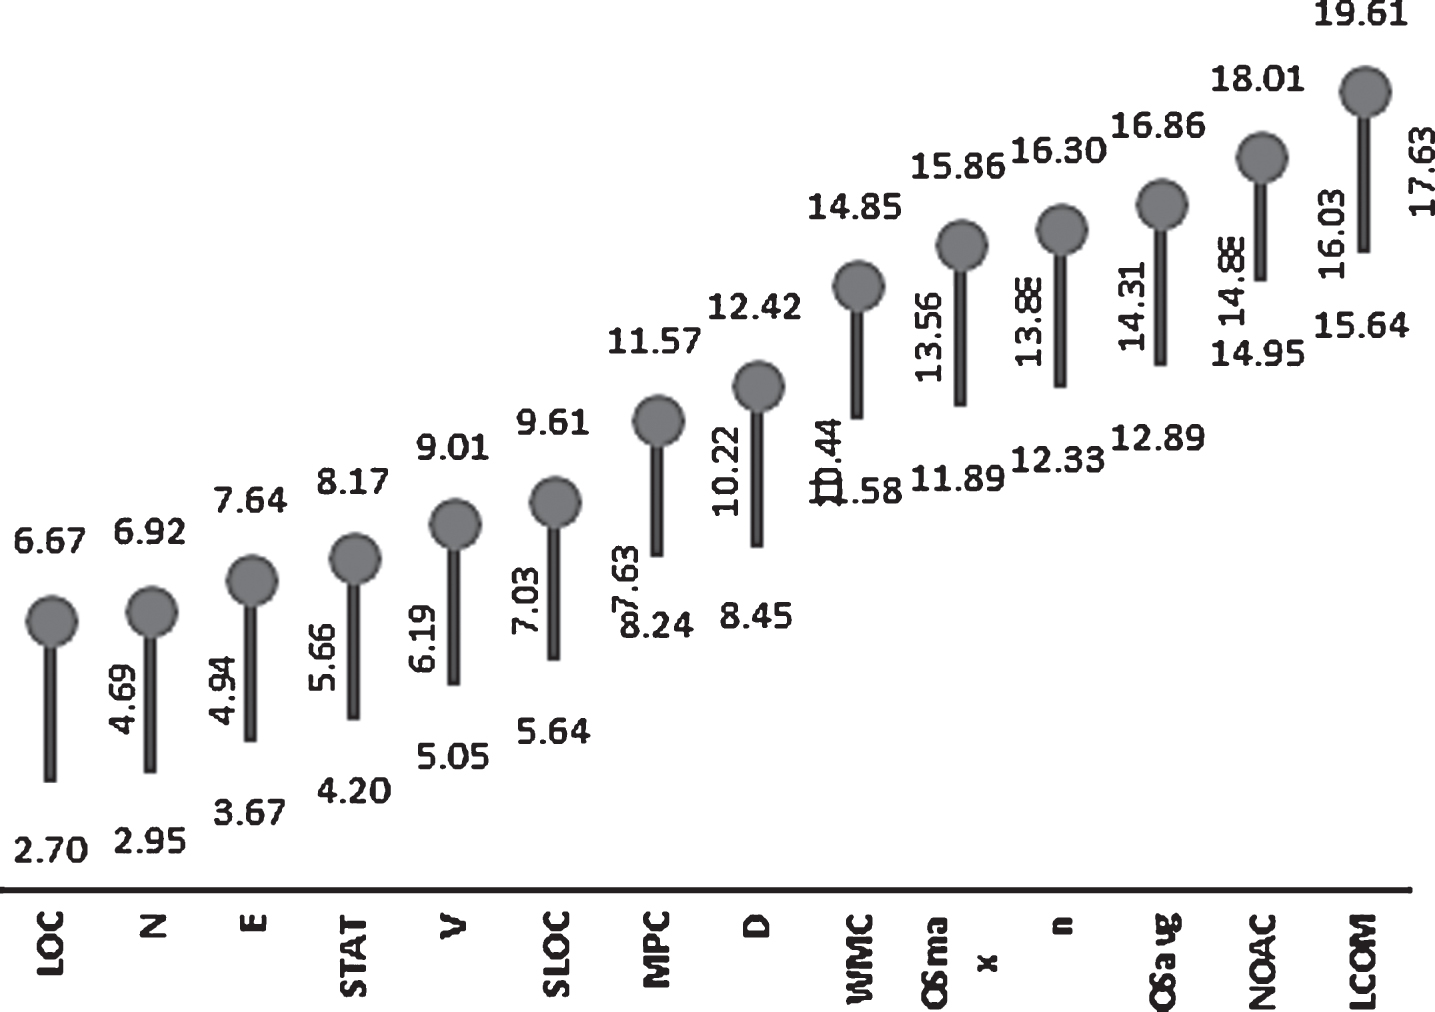
Graph displaying results of Nemenyi Test for TR.
Mean correlational values of highly correlated OO metrics (only significant value (p-value < 0.05) considered)
– Result was not statistically significant.
The results obtained after statistical validation using non-parametric tests indicate that the top correlated metrics (OO metrics with test metrics) were same in both TR and RR models indicating the insensitivity of the frequency of release cycles on metrics.
OO metrics most strongly correlated with test metrics were filtered out (obtained as result of Friedman’s test) and will be referred as ‘reduced set’ in the study. Mean correlational values of the reduced set was calculated for further analyze their correlation with test metrics.
Since rise in size (in terms of methods, parameters or attributes or one may simply call in terms of code) will affect the test effort of an application, correlation between test metrics and Halstead metrics were the highest. In fact, a larger application would require more test effort irrespective of the release cycles. Complexity metrics WMC, NOAC, OSmax and OSavg reflected a slightly stronger positive correlation in TR models as compared to RR models. This means that the complexity of an application may rise if the release cycles are lesser or in other words, the complexity of an application may reduce if the release cycles are frequent. Consequently, an increased complexity will directly affect the test effort required. Coupling metric RFC on the other hand, show stronger results in RR models indicating that frequent releases may increase coupling but the other coupling metric MPC doesn’t follow the trend. Therefore, coupling and release lengths cannot be linked in the analysis.
This study of correlation between test and OO metrics direct the study towards the best predictors of test effort in a class. The results thus obtained will be used to estimate the unit test effort TR and RRs in the next section.
Categorization
The results of Nemenyi test highlight that LOC, MPC, WMC and NOAC are statistically most significant set of OO metrics among the reduced set of 15 metrics. These four metrics and test metric NOAC, in this section of the study is used to create five categories that will help in accessing the test effort in TR and RR models. Using mean value based approach, five conditions and five categories are created. Ranging from the level very low, to very high these categories will label the classes of both TR and RR models. This approach though has been implemented earlier in the work of [19], but their work doesn’t analyze the test effort for different release models. Moreover, the set of metrics used were different.
Based on five conditions mentioned in Table 7, five categories were summarized as follows:
Shortlisted OO metrics
Shortlisted OO metrics
Category 1: Comprises of classes that satisfy all the conditions i.e. LOC greater than mean LOC (large size), NOTC greater than mean NOTC (large no. of test cases), MPC greater than mean MPC (Largely coupled) and NOAC greater than mean NOAC (highly complex) and WMC greater than mean WMC. Such a class requires a great amount of test effort and therefore, are allocated to ‘Very High’ test effort level and ranked under category 1.
Category 2: Comprises of classes satisfying any four of the five mentioned conditions. Such classes would be allocated category 4 and would be kept under test effort level ‘High’.
Category 3: Comprises of classes satisfying any three of the five mentioned conditions. Such classes would be allocated category 3 and would be kept under test effort level ‘Medium’.
Category 4: Comprises of classes satisfying any two of the five mentioned conditions. Such classes would be allocated category 2 and would be kept under test effort level ‘Low’.
Category 5: Comprises of the classes satisfying any one of the conditions indicating lesser complexity, coupling or code, therefore, requiring lesser effort to test and are kept under test effort ‘Very Low’ with category 5.
This categorization summarized in Table 8 would help in identifying the effort required in writing and testing unit test cases. Each class of the TR and RR were checked and categorized based on the conditions met. The Fig. 6, represents the percentage of classes of both TR and RR, falling under each category. It can be observed that though the trend of distribution is different in different datasets, on an average, test effort levels seem to go slightly up in RRs compared to TRs. Jclouds was the only dataset where classes falling in category 1 and 2 were considerably higher in TRs than RRs. This pattern was investigated and it was found that Jclouds had the highest LOC and a maximum number of TR and RRs resulting in rise of classes in category 1 and 2. Considering the results, it can be assumed that the test effort of releases depends a lot on the size of the application and a bigger application will always employ greater effort irrespective of the release cycles of the application. Further, it was also observed that classes falling into category 1 and 5 were relatively smaller compared to other categories indicating that there exists a lesser number of classes that employ too much or too less effort in both the release models.
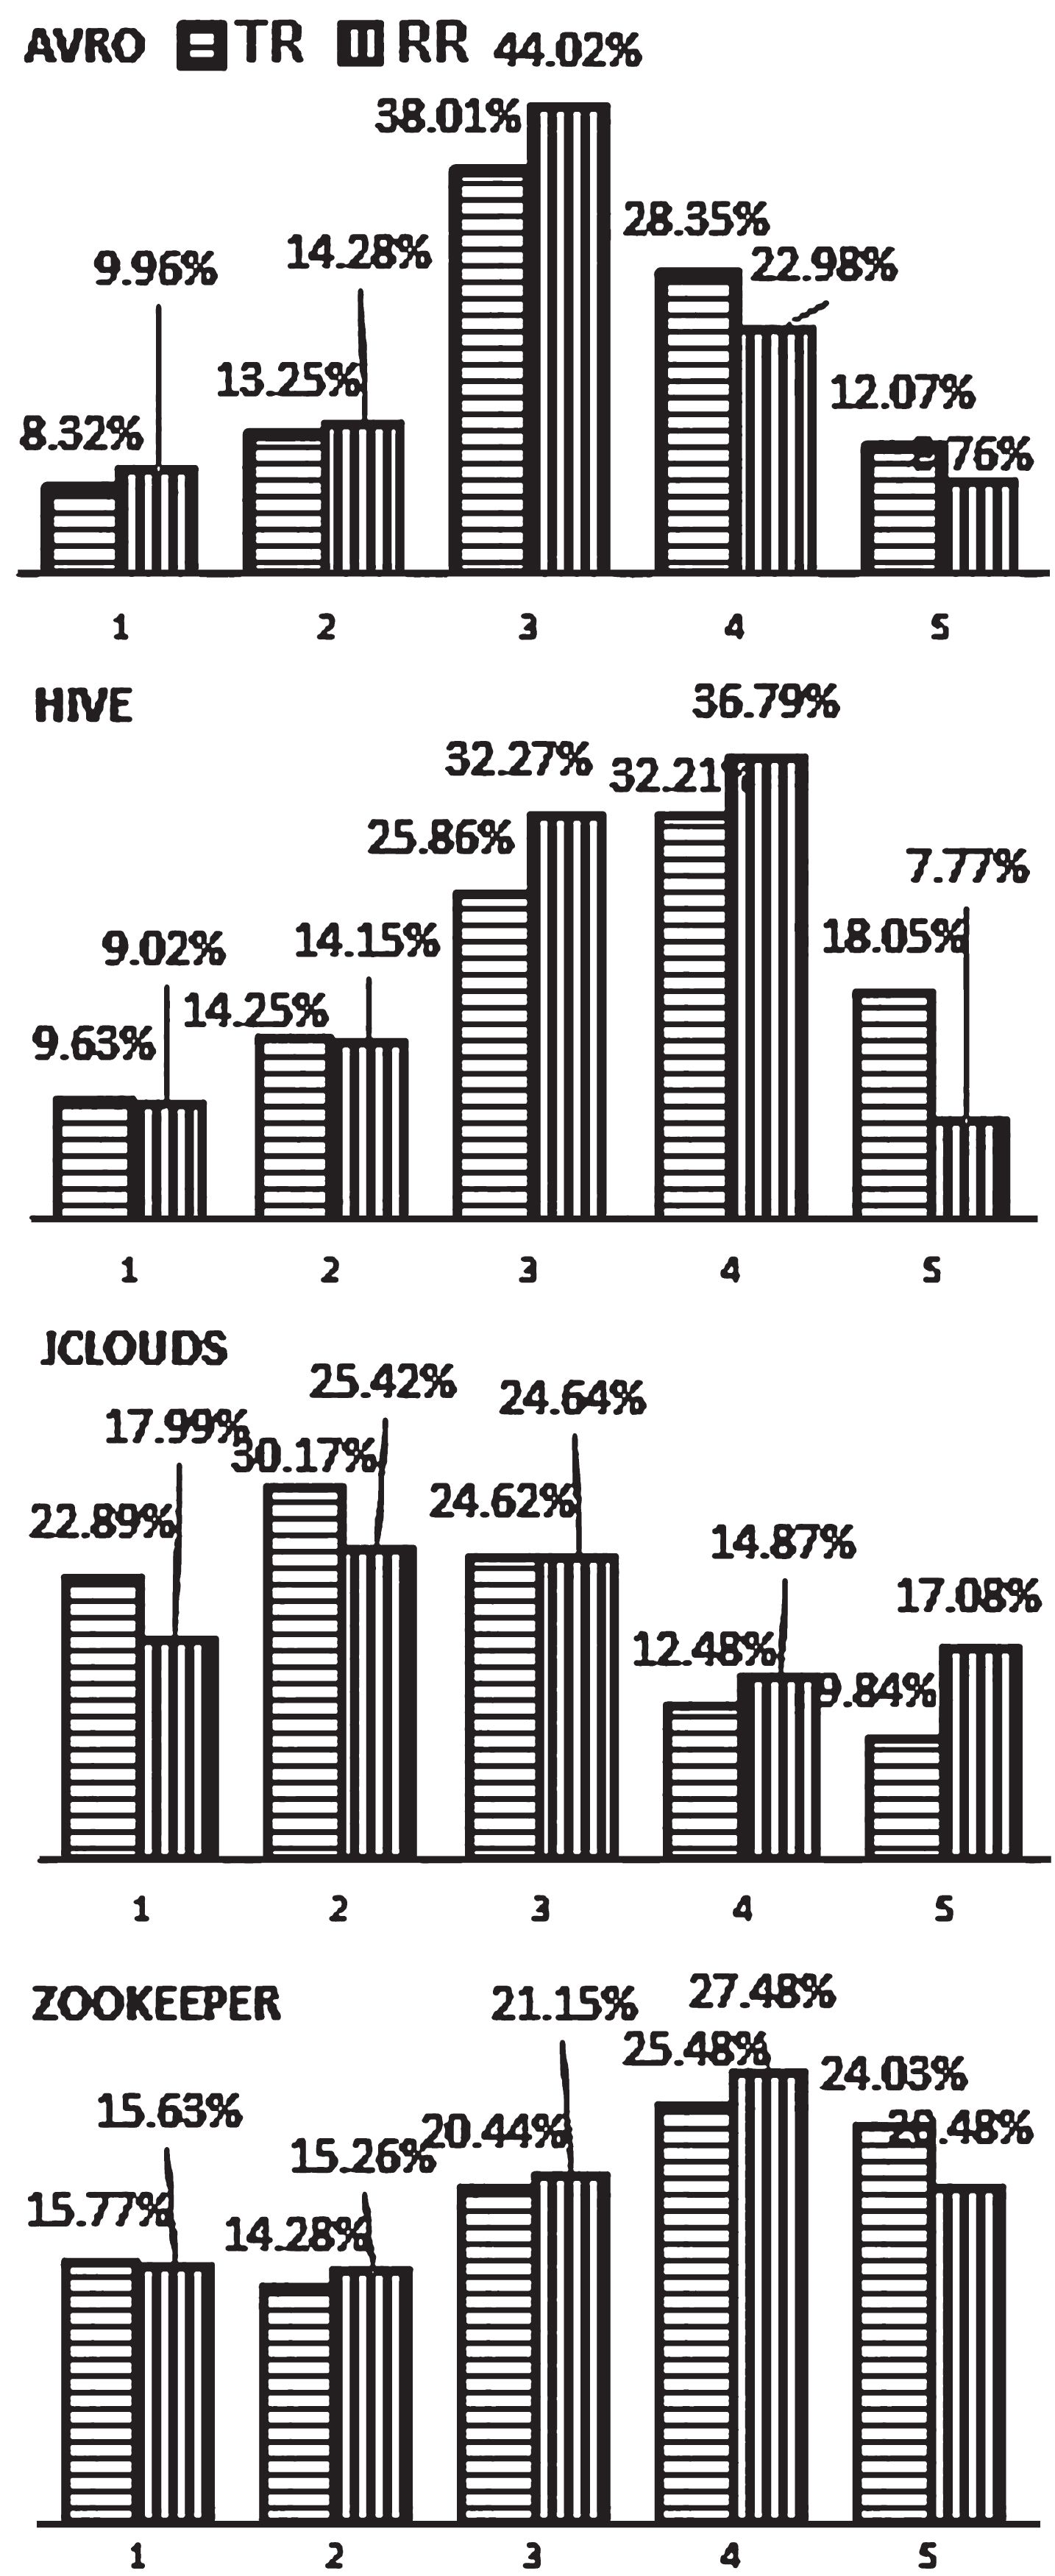
Categorization of classes into levels of test.
Test effort categorization into five classes
However, the analysis does draw the results in favor of TRs and it can be stated that TR models require relatively lesser test effort as compared to RR models.
Prediction is a computationally hard problem. Machine learning techniques can quickly andefficiently produce solutions to such problems and therefore have been used extensively by the studies in this domain [1, 37–38]. This work uses 18 machine learning algorithms to predict test effort in classes. These include seven function classifiers, two tree based classifiers, two inductive rule based classifiers, four meta classifiers and three lazy classifiers. A brief description of these algorithms is presented in Table 9. The test effort prediction was made in the following three ways:
Brief description of machine learning techniques used in the study
Brief description of machine learning techniques used in the study
Using all OO metrics (All) Using the highest correlated OO metrics (Reduced set) Using all except reduced set (Remaining set)
This three-way process will not only help in prediction but will also help to access the predictive capability of these metrics. The Coefficient of Correlation (CCOFF) and the residual errors in terms Root Mean Squared Error (RMSE) was calculated (using WEKA [36]) for the selected datasets and reported in Table 10. Residual errors generate from the difference between actually known responses and predicted responses. Models generating high CCOFF and low residual errors are desired for efficient prediction. It was observed that:
Instance based lazy learners IBK and K Star were most accurate in predicting test effort with CCOFF approximately near 1 and RMSE less than 5(using reduced set). Since the target function In lazy learners are calculated individually for every query therefore, such instance based learners can generate quality results for datasets containing few features. In MLP, existence of more than one layer between the input and the output enables complex calculations and enhances the adaptive capability of networks to train functions. The cross validation results for MLP were therefore best (CCOFF more than 0.9 and RMSE less than 10) in all the datasets and for all the metricssets. AR accumulates prediction results of estimator to improvise the base regression techniques, resulting in efficient predictions. However, the mean squared error of this algorithm increased for the Remaining set of Hive and Jclouds dataset thereby making it less accurate than MLP. Other techniques like GP, LWL, PR, M5P gave good predictions but their mean squared error were way more higher that IBK, K*, MPL and AR. RD gave the worst results among all the selected machine learning techniques.
Test effort prediction using machine learning algorithms for the selected datasets in the study
It can also be observed from Table 10 that prediction using the reduced set of 15 metrics was good as the prediction made using the all the 48 OO metrics together. Furthermore, prediction made using the remaining set of 33 metrics was found to be significantly poor. This signifies the importance and predictive capability of the reduced set ofmetrics.
Conclusion validity: This threat deals with statistical validity of results. Use of non-parametric tests such as Friedman’s test, Nemenyi test, Spearman’s test omits bias, since they are free from preconditions. Threshold value α= 0.05, which is a universally acceptable cut, father ensures confidence in the results obtained in the study.
Construct validity: OO metrics studied in the paper are extensively researched and established metrics. Moreover, they have been computed using tool IntellijIdea [10]. This reduces the threat for independent variables. The dependent variable has been calculated using JUnit framework which assures the accuracy of measurement of this variable too.
Internal validity: Since the ‘casual effect’ each OO metric on testability will be difficult to obtain and beyond the study. The threat to internal validity exists in the study.
External validity: The datasets used in the study belong to Open Source repositories which allow free access and ease of replication. The results obtained in the study are furthermore, consistent with the findings of earlier studies on release models and test effort prediction. However, to increase the generalizability, more studies on varied platforms are advisable.
Conclusions
Evolution and transition of release cycles may affect the test effort required in the system and in order to analyze this test effort required in Traditional Release (TR) models were compared to test effort required in Rapid Release (RR) models. For this, 25 traditional releases containing 1210 classes and 69 rapid releases containing 2616 classes were analyzed. On investigating the correlation between 2 test metrics and 48 Object Oriented (OO) metrics of both TR and RR models individually, it was observed that the OO metrics highly correlated with test metrics remain same for both the models and do not vary with the changing release cycles. However, the test effort was found to be slightly more in RR models indicating that shorter release cycles might require more test effort in the system. In addition to this, we empirically identified the top 15 OO metrics that were highly correlated to test metrics and used them to predict test effort.
The results of the shortlisted set of 15 OO metrics were as good as the result of all the 48 OO metrics taken together, signify the predictive capability of the shortlisted metrics. It was also observed that instance based machine learning algorithms IBK and K star gave the best results followed by Multi-Layer Perceptron (MLP) and Additive Regression for test effort prediction in classes. However, study suggests a deeper analysis on larger datasets before generalizing results.