
Abstract
Automated metering Infrastructure (AMI) is an integral part of a smart grid. Employing the data collected by the AMI from the consumers to generate accurate electricity consumption forecasts can help the utility in significantly improving the quality of service delivered to the consumer. Design and empirical validation of machine learning based electric energy consumption forecasting systems, is presented in the present study. Convolutional Neural Networks (CNN), Long Short-Term Memory (LSTM), Gated Recurrent Unit (GRU) and Extreme Learning Machines (ELM) based models are designed and evaluated. One of the major aspects of the work is that the proposed consumption forecasting systems are designed as generalized models, i.e. one single model can be used to generate forecasts for any of the consumers considered, as opposed to the conventional technique of generating a separate model for each consumer. The forecasting systems are designed to generate half-hour-ahead and two-hour-ahead electric energy consumption forecasts. The proposed systems are validated on data for 485 Small and Medium Enterprise (SME) consumers in the CER electric energy consumption dataset. Results indicate that the models proposed in the present study result in good consumption forecast accuracy are hence, well suited for generating electric energy consumption forecast models.
Introduction
Automated Metering Infrastructure (AMI) [1] is an important part of the smart-grid infrastructure. Utilizing the electric energy consumption data collected by AMI nodes to generate accurate consumption forecasts can help the electricity supply providers (also referred to as utilities) improve their service quality significantly [2]. An attempt has been made in this study to develop an accurate and reliable electric energy consumption forecasting system for AMI. Previous work [3, 4] by the authors attempted to develop electric energy consumption forecasting models for each consumer individually. Though the results were encouraging, the extremely nonlinear nature of the AMI data resulted in limited forecasting accuracy. This study presents an empirical validation of the applicability of current state-of-the-art machine learning/deep learning techniques in an attempt to improve the accuracy and eliminate the requirement for individual user-specific models for electric energy consumption forecasting. Results obtained are validated on five different performance measures to establish the effectiveness of the proposed methodology. The rest of the paper is organized as follows. Section 2 presents the system description. Section 3 describes the training and testing methodologies adopted. The results and analysis are presented in Section 4. Section 5 presents the conclusions.
System description
Unlike other prediction problems, energy consumption forecasting is a challenging problem since the data exhibits temporal sequence dependencies. Hence, Extreme Learning Machines (ELM) and other deep learning based algorithms are well suited in these cases as these algorithms can exploit these temporal dependencies effectively, as observed in [5].
Forecasting techniques proposed in this study are Machine Learning (ML) and deep learning based models as well, trained and validated on users in SME category for data in CER electric energy consumption dataset obtained from Irish Social Science Data Archive (ISSDA) [6]. The ISSDA SME category dataset comprises of half-hourly time series data from 12 am of July 14, 2009 to 11.59 pm of December 29, 2010 for 485 SME users (a total of 25632 data points per user). For modeling purposes no preprocessing other than ‘0-1’ normalization is carried out. The normalized data is then used as input to the machine learning algorithms for training the models for forecasting.
Fourteen deep learning forecasting models based on Recurrent Neural Networks (RNN), Convolutional Neural Networks (CNN) and ELM are designed and evaluated in the present study. A detailed block diagram of the proposed methodology is depicted in the Fig. 1. Previous work [3, 4] in the area involved designing and validating a separate forecasting system for each individual user in the dataset. This approach was found to be capable of generating good forecast accuracy, however, scalability was an issue since each users’ consumption forecast needed to be independently modeled resulting in one model per user. In the present study, the consumption patterns exhibited by the entire set of 485 consumers in the ISSDA SME dataset is modeled using a single amalgamated model. Consumption data from all the 485 consumers is fed in parallel to the forecasting system which then generates forecasts for all the 485 users simultaneously, thus removing the necessity of ‘n’ number of individual models in each technique for ‘n’ number of users (in this study, n= 485). The simulations are carried out with help of NVIDIA GeForce GTX 750 TI GPU. Keras API with TensorFlow backend was employed. Table 5 gives the system specification of the models developed. A short description of the machine learning algorithms considered and the parameters selected, is given below.
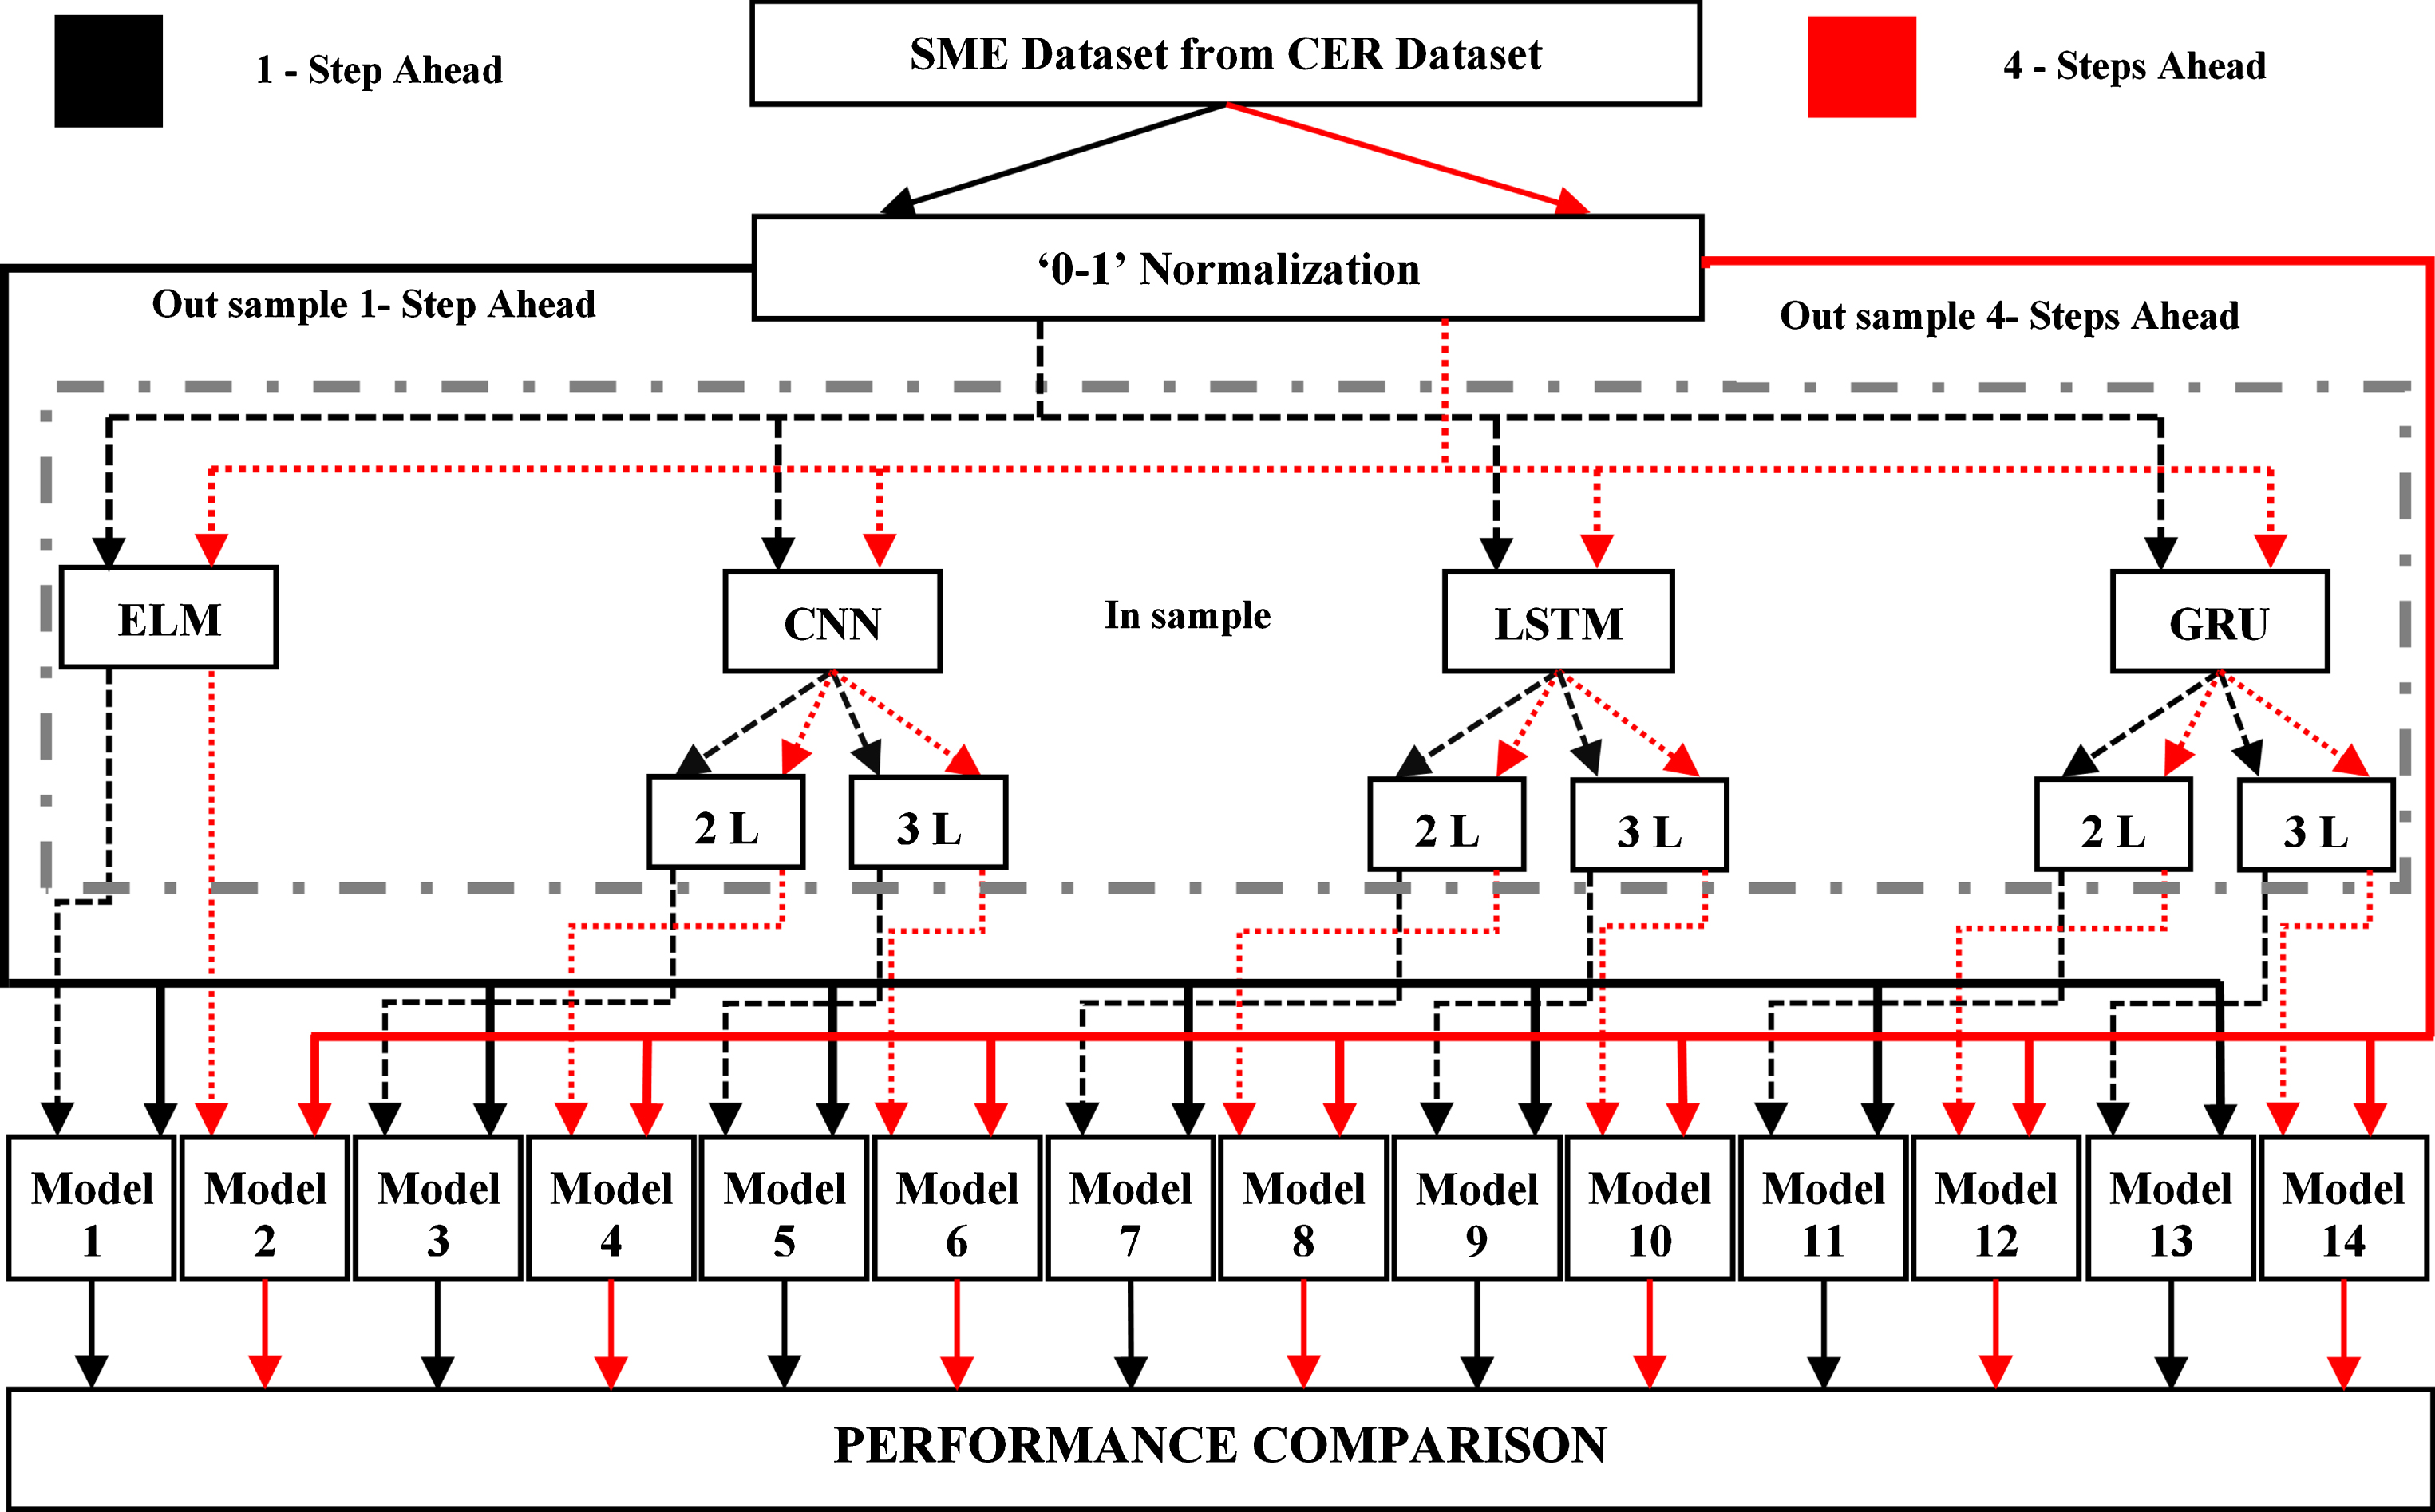
Block diagram of proposed system.
LSTM is a special type of RNN, which has a capability to learn longer dependencies in the dataset. The simple structure can be found in [7]. LSTMs have been effectively used in several time series forecasting applications, e.g. in [8]. In the current study, 2 – Layered and 3 – Layered LSTM structures are used for modeling with 64 neurons in each hidden layer. The neuron size in hidden layer is selected via trial-and-error.
The simple LSTM architecture [9] with forget gate [10] is depicted in Fig. 2.
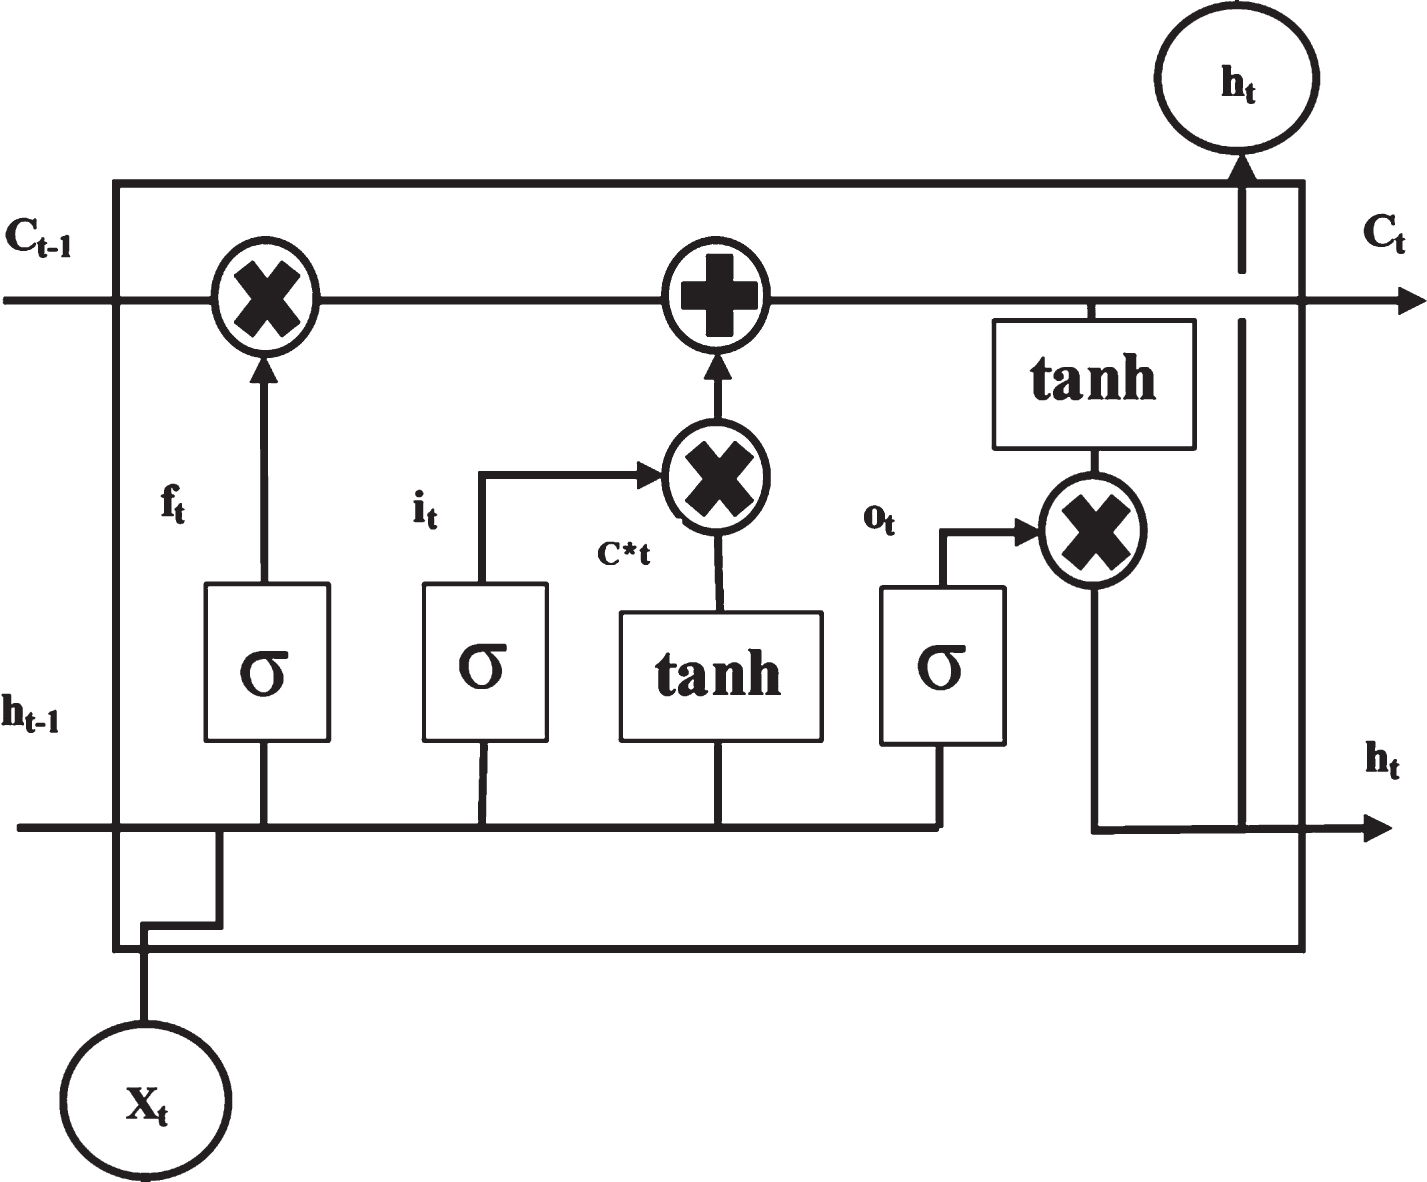
LSTM architecture [10].
The forget gate determines the unnecessary component from the previous cell state which can be computed as follows [10]
The state update of the cell is determined by the input gate and ‘tanh’ layer, which is calculated as
The output from the cell to next cell is calculated by output gate as
Where W f , W i , W c and W o are the weight matrix of the forget gate, input gate, memory cell and output gate respectively and U f , U i , U c and U o are the recurrent connections of the forget gate, input gate, memory cell and output gate respectively.
GRU [10] is a less complex RNN when compared with computations associated with LSTM. There are several experimental evaluations of both LSTM and GRU [9, 10] for their performance on different applications. In the current study, 2-Layer and 3-Layer GRU structures are used for modeling with 64 neurons in each hidden layer. The neuron count is chosen by trial and error method.
Architecture of GRU is shown in Fig. 3. GRU architecture [10].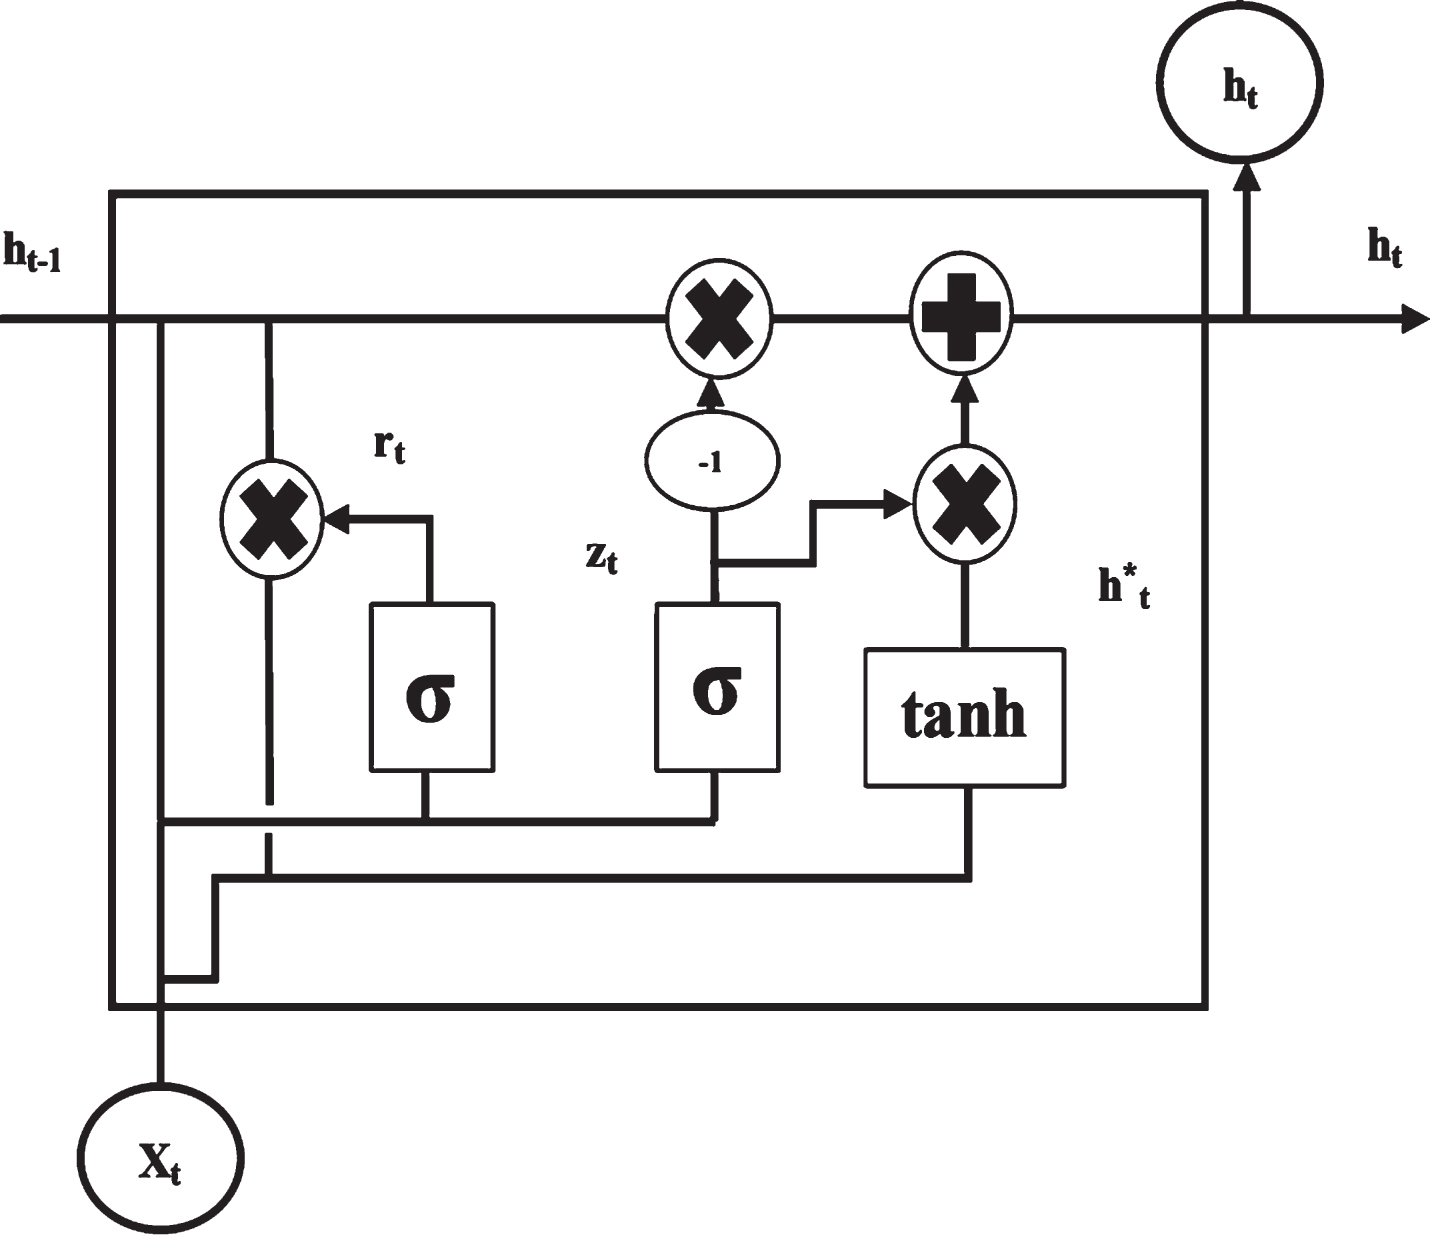
The computation for reset gate and update gate as follows [10]:
Where W z , W r and W h are weight matrix of update gate, reset gate and hidden state respectively. In the same way U z , U r and U h are recurrent connections of update gate, reset gate and hidden state respectively.
CNN is a multilayer perceptron network, which has been widely used in computer vision applications with minimal preprocessing when compared to other ML algorithms. The recent evolution in data mining algorithms has made the CNN an effective contender for time series forecasting. CNN is used in financial forecasting [8]. In the present study 2 – layered and 3 – layered CNN are used in developing the forecast models with 64 neurons in each hidden layer. The neuron count is chosen by trial and error method.
ELM based forecasting system
ELM is a variant of single layer feedforward neural network [11] with wide range of data mining applications. The performance of ELM is often comparable to many state-of-art deep learning models. The work presented in [3] makes an ELM a competitive candidate in time series forecasting. In the present study, 485 neurons are used in the input as well as the output layers and 970 neurons are employed in the hidden layer.
Training and testing approaches
The ratio of the dataset used for training and testing the ML models under consideration is maintained to be 92:8. The training and testing samples size used are 17,520 and 1,440 respectively. The samples in CER Smart corresponds to 48 samples per day.
The training and testing are done based on two different approaches as depicted by the equations given below.
The predictor variable in the current study holds the past four samples of the time series with two different types of target variables as 1 - step ahead forecast and 4 – step ahead forecast as given in Equations (12) and (13).
Where N corresponds to number of steps ahead. The forecasting models, generically represented here as mdl (·) are a function of Y, T
N
and are trained on the training dataset using the machine learning techniques to minimize the error between the actual N-step ahead consumption value and the model output. The forecasts then can be represented as:
The performance of each approach on different models developed was evaluated based on Median Absolute Percentage Error (MdAPE) and Mean Absolute Percentage Error (MAPE) (Table 1), Root Mean Squared Error (RMSE) (Table 3) and Mean Absolute Error (MAE) (in Table 4). In addition to these error metrics, the Directional Accuracy (DA) measure is also considered. DA is a useful measure in AMI forecasting since it gives an indication of how good the model is in forecasting the direction of change in electric energy consumption (increase or decrease).
A total of 14 different models were developed using the modeling techniques described in section 2. The models depicted in Fig. 1 are as follows: odd numbered models, namely, models 1,3,5,7,9,11 and 13 are 1-step- ahead forecast models and even numbered models, namely, models 2,4,6,8,10,12 and 14 are 4 – step-ahead forecast models. The training and testing data for all the models is obtained from the CER dataset with 92% of the data being employed for training and the remaining 8% being used for testing. Hence, the training and testing samples size used are 17,520 and 1,440 respectively. All the models are evaluated based on five performance metrics, namely, MAE, RMSE, MAPE, MdAPE and DA. The results are tabulated as follows: performance in terms of MAPE and MdAPE is presented in Table 1, performance in terms of DA is tabulated in Table 2 and performance based on RMSE and MAE values is tabulated in Tables 3 and 4, respectively.
For the purpose of comparison, the results reported in [3] (validated on the same CER dataset) are also presented alongside those obtained using the models proposed in this study. In Table 1, six error bands for both MAPE and MdAPE are considered: 0–20%, 20.1–40%, 40.1–60%, 60.1–80%, 80.1–100% and >100%, represented as 20,40,60,80,100 and 100 +. The values corresponding to each band indicates the number of SME users for which the forecasting error falls that range.
From Table 1, it can be observed that the ELM and CNN based approaches perform better when compared to other modeling approaches considered in the present study. The individual modeling approach reported in [3] shows that ELM based models are good candidates for forecasting energy consumption, since 90.92% of total number of users within the band of ‘0 - 40% ’ cumulative MdAPE for 4 – Step Ahead Prediction, whereas the proposed systems can accommodate only 36.88%, 37.95% and 35.18% of total number of users within ‘0 – 40% ’ cumulative MdAPE band for the techniques such as 2 – Layered CNN, 3 – Layered CNN and ELM respectively. Even though the proposed work can accommodate (59.34%, 58.24% and 61.54%) lesser number of users in a particular error band for the best techniques in the present study when compared to previous work, the proposed methodology has the advantage of requiring only one single model capable of generating independent forecasts for each of the 485 users considered.
User count on error metrics of SME dataset
1[3] with Hodrick–Prescott filter preprocessing, 2[3] without Hodrick–Prescott filter preprocessing, S – Steps Ahead.
The best and worst DA forecasting results (1-step and 4-step ahead, implying half-hour and two-hour ahead) for SME consumers is given in Table 2 as a representative for all the 485 SME consumers.
Best and worst forecast DA for SME users
RMSE Best and Worst values of the different techniques considered
MAE Best and Worst values of the different techniques considered
System specification of the models
*ADAM optimizer’s parameter is given as (η= 1e-3, β1= 0.9, ɛ= 1e-08, β2= 0.999, decay = 0, clipnorm = NULL, clipvalue = NULL).
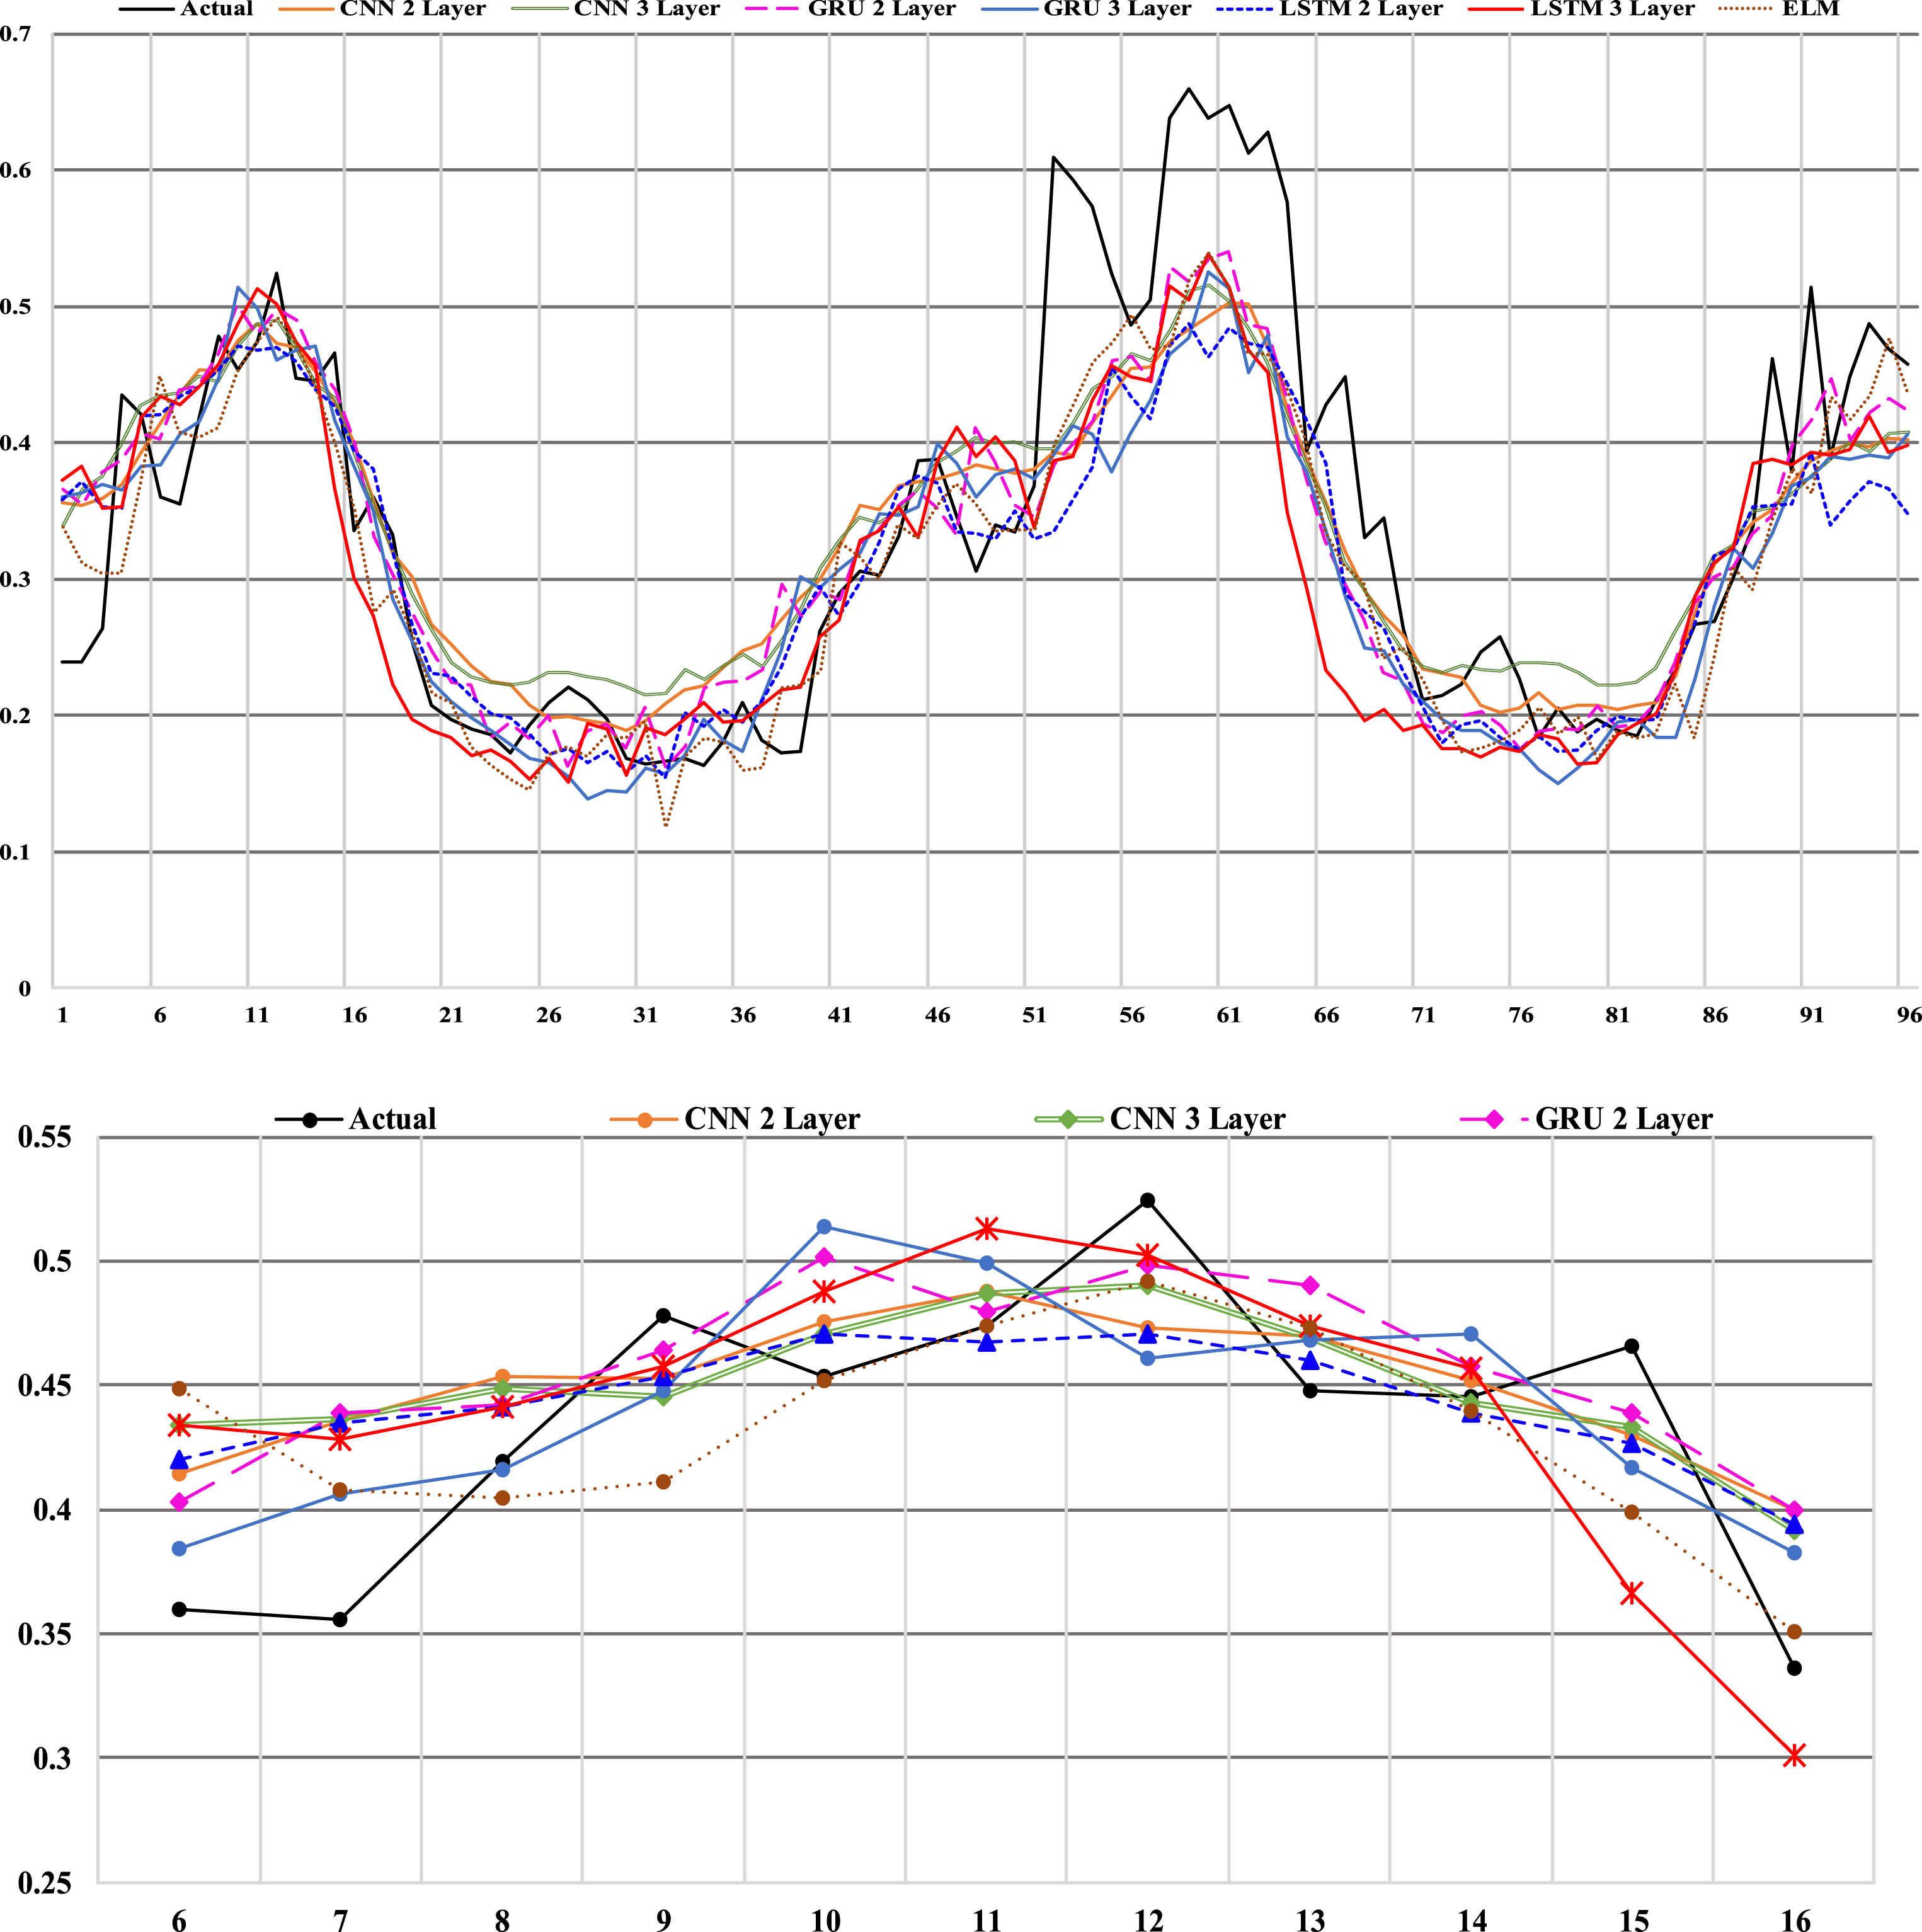
It is apparent from that ELM based forecasting system outperforms all other forecast models considered in terms of predicting the trend of the time series at least by 3.38% and 5.1% for 1 – step-ahead prediction and 4 – step-ahead prediction respectively, when compared to its CNN counterparts. A clear picture of directionally accurate forecasting can be observed from the Fig. 4 and Fig. 4a, it is also observed that the that proposed methodology can predict even the directional changes with a good degree of accuracy.
The MAPE values of 16 users out of 485 in SME dataset were found to be infinite as the actual values in the dataset approximately equals to zero for the test data (supposedly indicating no consumption or unavailability of reading from the meter). From the results obtained, it is clear that while the models developed in the current study provide as good a result as the previous work [3], the proposed models also avoid the necessity of ‘n’ individual models for ‘n’ users which in the models based on ELM and CNN architectures outperform all other models developed for the dataset considered, and a single step ahead prediction horizon provides us with minimal prediction error and good DA.
Conclusions
Accurate and reliable forecast models are essential for forecasting the electric energy consumption as this forecasting plays a vital role in grid stability and profitable resource management. Designing and managing individual models for forecasting in this kind of multi-user environment is always a cumbersome process. The proposed methodology efficiently addresses this issue. Based on the analysis of results obtained from the predictive models developed for the time series forecasting the conclusions are summarized as follows:
The proposed technique of designing a single unified model that can generate consumption forecasts for all the users under consideration simultaneously is a viable alternative to the traditional technique that requires separate model for each user.
ELM and CNN based models can be adopted as reliable candidates for electric energy consumption forecasting since the ELM and CNN based models gives consistent results for both longer and shorter prediction horizons.