
Abstract
The paper first analyzes the correlation between text sentiment values and personality traits, proves that text sentiment can have a good support effect on user personality prediction, then on this basis, a method based on CNN-LSTM is proposed, which can be used to deeply analyze the sentiment analysis capability of the model, hoping to improve the precision of sentiment classification and lay a solid foundation for the next experiment. This experiment proves that the CNN-LSTM constructed in this paper can better predict the emotional tendency of the short text of microblog, has good generalization ability, and has higher precision than other methods.
Introduction
Generally speaking, personality and sentimental expression have a positive relationship. People’s personality is formed based on many emotional experiences, which can be expressed through emotions; in turn, the expression and changes of emotions are restricted by the formed personality and sentiments. Therefore, the sentiment fluctuations obtained through learning can extract the sentiment of the text more accurately, which plays a positive auxiliary role in the prediction of the user’s personality.
The basic task of sentiment analysis is to infer the sentiment polarity (such as positive or negative) of the document and then to analyze the user’s emotions. In this regard, there are many published kinds of literature based on sentiment dictionaries or machine learning to study sentiment. Social networks, as a platform for users to express their opinions, gather a large amount of textual information, which contains rich sentiments. By mining the emotional changes conveyed by these text publishers and judging the user’s likes and dislikes, on the one hand, you can understand the user’s emotional changes, which is convenient to analyze the user’s personality characteristics. On the other hand, based on accurately recognizing emotions, users’ views and attitudes towards events can be timely grasped, to better meet their needs and improve the service quality of their products. Therefore, it has very important practical significance for the research of sentiment analysis of microblog.
The core of the text sentiment analysis task is to complete the extraction and classification of sentiment information. Sentiment information extraction can extract words or phrase elements that contribute to sentiment analysis. Common methods include information gain, expected cross-entropy, word frequency, document frequency, chi-square test, etc., while genetic algorithms and principal component analysis can be used for features extracted.
The paper pays more attention to emotion classification. Sentiment dictionary, as a tool that can easily and quickly achieve better sentiment feature selection, also occupies a pivotal position in the field of sentiment analysis. Shampa et al. [1] have combined emotion vocabulary in the field of psychology, WordNet ontology dictionary, and commonly used slang collections in the network to build an emotion dictionary. Jia-Neng Yang et al. [2] enriched the existing sentiment dictionary from two angles of emoticons and network terms and proposed a sentiment classification method based on semantic analysis and rule set for Chinese microblogs. This method built an emotion expression tree based on syntactic rules and then combined the expanded emotion dictionary to calculate the emotion intensity value, thereby judging the emotional tendency of microblogs. Xinyi Xu et al. [3] proposed the concept of text texture based on the emotional vocabulary, evaluation vocabulary, sentence pattern, and article rhetoric in the text. The experiment combined feature dimensionality reduction to improve the recall rate of emotion classification results. Chikersal et al. [4] integrated linguistic knowledge in the traditional sentiment classification, expanded a large number of rules, and used the improved N-grams model to solve the more complex sentence patterns on the morphological features of the language. Pak et al. [5] labeled the sentiment polarity on the Twitter text data set and implemented an emotion classifier based on Naive Bayes, SVM, and conditional random fields, respectively. Comparing the classification results, SVM achieved good classification results. Yang et al. [6] combined information increment, support vector machine, decision tree, and Naive Bayes algorithm for feature selection and sentiment classification and used positive and negative characteristic means to evaluate sentiment similarity. Irsoy et al. [7] treated the problem of opinion extraction as a problem of sequence labeling. Experiments show that RNN has achieved top-notch results on the problem of fine-grained opinion extraction. But it has been shown that when the interval between neurons is large, the latter neuron will lose the ability to connect to the farther neuron in front. Bhattacharjrr et al. [8] proposed a method to calculate the similarity of user comments based on cosine similarity and gave each text a sentiment intensity value of –2 (negative) to +2 (positive), the results obtained were improved compared with traditional Bayesian, maximum entropy and support vector machines.
Compared with the sentiment analysis of the long text, short text sentiment analysis is more difficult and complicated. Although the current mainstream sentiment analysis methods are very mature, the exploration of deep learning methods has just begun. To make up for the shortcomings of previous research, the paper first analyzes the correlation between text sentiment values and personality traits, proves that text sentiment can have good support for user personality prediction and then on this basis, a CNN-LSTM-based method is proposed to deeply mine the emotion analysis capabilities of the model, hoping to improve the precision of emotion classification and lay a solid foundation for the next experiment.
Quantification of sentiment value and analysis of its relationship with user personality
Personality traits determine a person’s attitude towards things to a certain extent. For example, when an extroverted individual and introverted individual face setbacks or deal with problems, their mentality, and handling methods are very different. McCrae et al. [9] believed that extroverts are naturally happier than introverts and neurotic people are more likely to have emotional fluctuations than non-neurotic people. Watson et al. [10] found that the correlation between personality traits and positive affective states was 0.64 and the correlation with negative affective states was –0.53; job satisfaction and affective states changed in the same trend.
To analyze the relationship between the emotional state of the text and the personality traits, the paper analyzes the changes in the emotional state of the text from the perspective of personality traits. Firstly, the data set of the study was manually marked to determine the emotional tendency of each microblog text. Then, the relationship between personality and emotion was analyzed by using the statistical method to quantify the change of emotion in time series.
Text polarity annotation
Collecting corpora is the basis for conducting experiments and evaluating algorithms. To verify the actual role of the model, the paper uses real Facebook data. The data set contains 250 users and a total of 9917 corpora.
Based on this corpus, the emotional polarity of the corpus was manually marked to carry out the following experiments. This labeling was completed by three labeling personnel. The specific division of labor is as follows: the first person is responsible for two aspects of the work, one is to remove punctuation, links, advertisements and other information that have no practical meaning in the text; the other is to carry out positive or negative emotional annotation on each microblog. If the emotion in the microblog is not clear, then this microblog is discarded. After processing by the first person, there are 9856 corpora. Then the 9856 pieces of data together with the label results are handed over to two other people, each of them are responsible for annotating part of the information. If the two people are marked with the same emotional polarity as the first person, then keep this message; If the polarities of the two labels do not agree, the two labelers in the second round will negotiate to determine the emotional polarity of the message. After two rounds of labeling, there are 9812 items left, which is the final data set of this experiment.
Sentiment value quantification method
After manual annotation, it has the sentimental polarity of each text. Analyzing the text sentiment information of a certain microblog published by the blogger can reflect the mood of the blogger to a certain extent from the frequency of bloggers ‘publishing of microblogs and changes in sentiments, the bloggers’ emotional changes within a certain time can be obtained and then the regular information of their personality traits can be obtained.
Therefore, this section analyzes the quantification methods of different sentiment values and selects the centralized method for the emotion quantification experiment in the next section. First of all, because of the relationship between emotional fluctuations and time, the time dimension of each blogger’s text is sorted and then the characteristics are calculated according to the time dimension ranking: The mean value of emotion. The mean value of all text sentiment features of each blogger; The standard deviation of emotions. The standard deviation of all text sentiment features of each blogger; The variance of emotion. The variance of all text sentiment features of each blogger; The percentage of positive status. The proportion of positive emotion text in the emotional characteristics of each blogger’s text exists in the form of a small tree; The ratio of positive and negative states. The ratio of the number of positive emotion texts to the number of school-level emotional texts in each blogger ’s emotional characteristics; The frequency of release status. During this period, the total number of microblogs posted by each blogger.
Experimental analysis of emotional fluctuations in user personality
All the experimental content of this paper is based on the Python language, using Pycharm as a development tool.
The data set used in the experiment in this section has been explained earlier. The statistics of the number of corpora for each user are shown in Table 2. It can be seen from the table that the distribution of user corpus is uneven, so it is necessary to adopt the measurement methods of mean and variance to remove the influence of the different number of microblogs for each user.
Part of Facebook user data
Part of Facebook user data
Average corpus statistics of users in the Facebook dataset
The paper uses the Spearman correlation coefficient to evaluate the association between the personality characteristics of Facebook users and the behavioral characteristics of the social network platform. The features are shown in Section 2.2 and the results are shown in Table 3. The percentage of positive states in all states is significantly positively correlated with conscientiousness and agreeableness, suggesting that both conscientiousness and agreeableness users usually show more positive emotions. The percentage of positive states in all states is negatively correlated with neuroticism. The ratio of positive and negative states is negatively correlated with conscientiousness. The frequency characteristics of the release status have a higher correlation with openness.
Correlation analysis of emotional characteristics and user personality
The correlation coefficient gives a reference to the relationship between the feature and the target value to a certain extent. Several features proposed in this section have a certain correlation with the user’s personality traits. These can be put into deep learning models to learn. After complex changes, it is possible to mine deeper feature relationships.
The CNN-LSTM model is a model built by CNN and LSTM. It uses CNN to extract the spatial features of the data and these features are input as time series. Then it uses the LSTM network for further feature extraction and places the finally extracted features in the fully connected network for classification. Among them, by inputting the word vector into the CNN network, the more important local features in the sentence can be extracted, so that the model pays more attention to the emotional words or the target information corresponding to the words during the training process. Secondly, the output variables of CNN are not randomly input into the LSTM model, but the output is combined in the form of time sequence. In this way, the mutual relationship between different words in the training sentence can be expressed to a great extent and the time-dependent relationship between the words and emotions in the sentence can be effectively mined, achieve the purpose of effectively distinguishing the polarity of emotions.
In summary, the paper uses a combination of CNN and LSTM models to analyze the personality characteristics of users, which is mainly composed of the following 4 parts: Input matrix. The correlation method is used to transform the words in the corpus into word vectors and splicing them into two-dimensional matrices as the input of the convolutional neural network; CNN model. The convolutional layer and pooling layer structures in the CNN network model are designed to extract and reinforce the feature information in the sentence and input it into the next neural network as the output feature; LSTM input matrix. That is the output matrix of CNN. It is necessary to pay attention to the connection between the two models and input the features learned from the CNN model into the LSTM model in a sequential manner; LSTM model. The features of the LSTM model such as the number of neurons and the number of hidden layers were designed. The activation function, classification function, and the form of fully connected layers used by the model also need to be considered.
The purpose of the paper is to explore the prediction effect of the CNN + LSTM model in the sentiment analysis task of microblogs. short text, to improve the precision of the model for such tasks. The overall framework is shown in Fig. 1 below, which is mainly divided into three parts: data preprocessing and data annotation, CNN + LSTM model construction, and experimental effect analysis.

Sentiment prediction framework.
Model structure
The first step in constructing a model in the paper is to extract text features.
The second is to build the CNN-LSTM model. Because the structure of the deep learning model is relatively complex, for a single neural network, it requires the experimenter to continuously adjust the number of layers of the neural network, the number of corresponding neurons in each layer, the activation function, and the classification function. The CNN-LSTM model used in the paper not only involves the adjustment of the parameters of a single model but also considers the problems of parameter transfer between the two models. Therefore, the paper will first build the CNN and LSTM models separately and finally adjust the parameters of the CNN-LSTM merged model.
Based on the above analysis, the construction work of the paper’s sentiment analysis model includes feature engineering, CNN model construction, LSTM model construction, and parameter adjustment. The model structure is shown in Fig. 2.
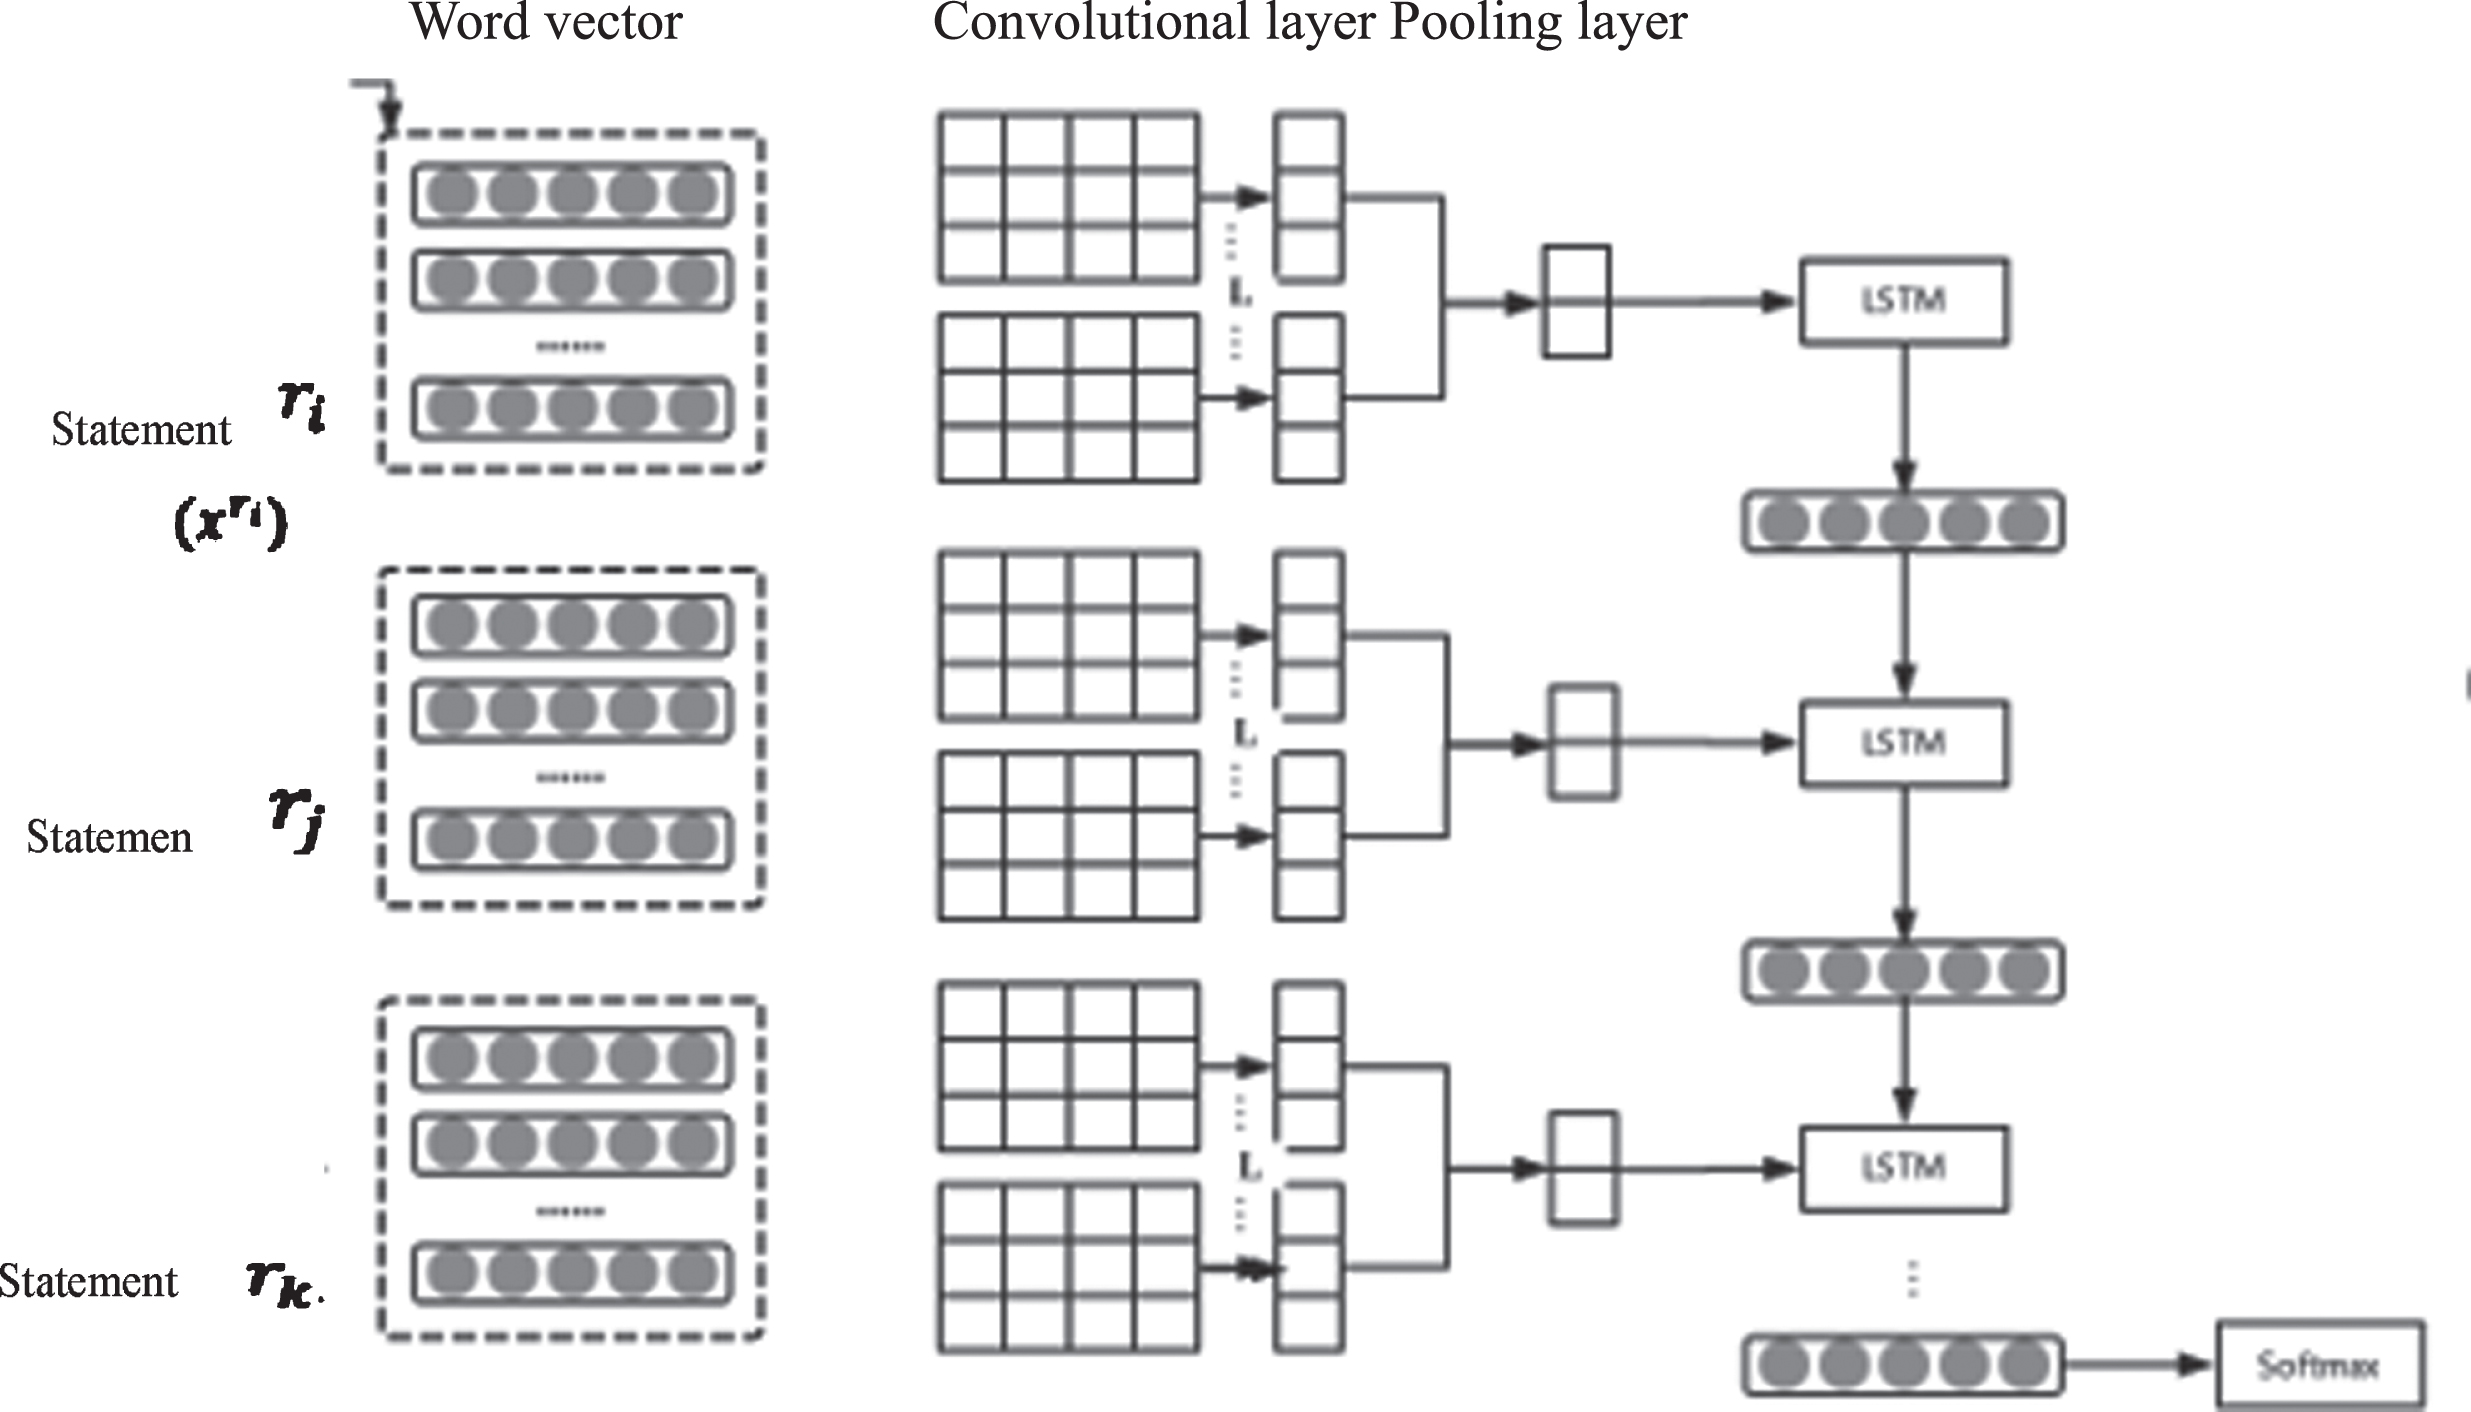
CNN-LSTM model structure diagram.
The purpose of using convolutional neural networks is to extract the emotional information in the text and give higher weight to the modules that have a greater impact on the results during the training process. Then the output matrix is used as the input vector of LSTM so that the entire model can pay close attention to certain feature information of the text during the training process, such as emotional word information and subject word information, to better identify the emotional polarity of the text.
One of the advantages of convolutional neural networks is that it can receive parallelized input of sentences. To input explicit text information to CNN, the paper divides the text according to the sentences it contains, that is if the text T contains R sentences, the text is divided into R regions T ={ r1r1 … r
i
r
j
r
k
… r
R
}, A region is equivalent to a sentence and the region contains several words in the form of
In this way, in the CNN learning process, the regions that have a greater impact on the emotional polarity will have greater weight. After determining the input of the model, the convolutional Layer and max-pooling Layer of the CNN model should be determined. If L filters (convolution kernels) are used for training in the convolutional layer, the convolutional layer operates on the input data by formula (1).
In formula (1), l refers to the lth filter, w is the size of the filter, W l is the weight matrix of the l th filter and f represents the activation function. The Relu activation function is used in the CNN convolutional layer, which will be introduced together with the activation function of LSTM in the next section.
When the filter l learns from position x1:w-1 to position xN-w+1:N, that is, learning a sentence is completed,
Max-over-time pooling method is adopted in the pooling layer of the convolution network and the calculation of the most important features is shown in formula (2).
For a window with L convolution kernels, the eigenvectors available are
Among them, the output matrix of the convolutional neural network is the eigenvector
To capture the long-distance dependence of cross-region sentences, each region vector needs to be integrated into a text vector sequentially. By inputting the word vectors into the LSTM network in order, the dependence relationship between different words in the sentence can be mined, so that the emotional dependence information of different noun subjects in the sentence and other words can be mined. The input of an LSTM unit is composed of the input eigenvector and the output of the previous neural unit. In this way, more complete sentence feature information can be retained. After the LSTM network has learned all the regions in order, the output of the last hidden state is used as the result of emotion prediction.
Based on RNN, LSTM introduced the concepts of input gate, output gate, and forget gate. In the data conversion process of these three gates and the different layers of the CNN-LSTM model, the use of activation functions needs to be considered. Which can transform linear problems into non-linear problems so that neural networks can learn complex changes. Therefore, if the activation function is not used, the input of each layer in the model is a linear function of the output of the upper layer. A neural network without an activation function will be just a linear regression model. No matter how many layers the model has, the output is a linear combination of inputs, so it is necessary to choose a suitable activation function.
This section will introduce several activation functions and their application in CNN-LSTM. Formula (3) is the definition of Sigmoid activation function. For many neural networks with binary classification problems, the output layer is usually the Sigmoid function, which is caused by the output mapping range of this function in (0, 1). This function value can be used as the probability of category selection in the binary classification problem. With the deepening of applications, scholars have noticed that when the value of the Sigmoid function is 0 or 1, the gradient is almost 0, which makes it difficult for the neural network to update the weights during the backpropagation process, resulting in “failure” in the training process. Secondly, the Sigmoid function is not symmetrical about the center of the origin, this characteristic will affect the calculation of gradient descent. Combining the advantages and disadvantages of the Sigmoid function, it is widely used in the forget gate of LSTM and the output value range is (0, 1), which can be used to explain the degree to which historical information is retained.
Formula (4) is the definition of Tanh activation function, which is also known as the double tangent function, with the value range of [–1, 1]. The Tanh activation function works well when the features are significantly different and it will continuously expand the features during its cycle. The difference with the Sigmoid function is that the Tanh function is 0-mean, so in most cases of practical application, Tanh will be more consistent than Sigmoid. In this model, the Tanh activation function is used in the input gate and output gate, the purpose is to perform a non-linear transformation of the data [–1, 1].
Formula (5) is the definition of the Relu function. It is not difficult to find that the convergence speed is much faster than the Tanh / Sigmoid function. Most importantly, the use of Relu makes the neural network introduce the feature of sparsity. This approach, equivalent to pre-training for unsupervised learning, will greatly shorten the learning cycle. Combining speed and efficiency, many activation functions in machine learning select the Relu function. The paper also uses the Relu function in the CNN network for data conversion between layers.
Formula (6) is the definition of Softmax function. When LSTM is used for classification, it will generally be followed by the Softmax layer, which is used to calculate the output of the model, establish the mapping of sentences to labels and obtain the sentiment polarity classification of the sentences to be classified.
Among them, W
s
represents the weight matrix, b represents the offset, and SN represents the output of the hidden layer of the last neural unit of the LSTM network. In the model training process, a loss function is needed to judge the precision of model classification. Intuitively, the greater the difference between the output of the function and the actual result, the greater the output of the loss function and vice versa. The algorithm used to train the network model in this paper is the back-propagation algorithm and the model is optimized by minimizing the cross-entropy of each output of the full connection layer. The calculation of cross-entropy is shown in formula (7).
Among them, y represents the predicted value of the sentence to be classified,
Corpus collection and evaluation indicators
The paper uses the data set in Section 2.1 to make a detailed introduction, including the emotional annotation of the data set and the user’s five personality scores. On this basis, the user’s microblog text data is processed and personality judgment is made according to the score of the five major personalities. Because Facebook data has more symbols, its random features are more in line with people’s daily habit of using words, so the paper carried out operations such as symbol deletion, magnetic annotation, word form restoration, removal of stop words, and punctuation, etc. Word2vec tool is used to process the word vector and the processed result is used as the input value of the sentiment analysis model.
To determine the five major personalities of the user, this section makes a statistical analysis of the user’s personality characteristics and uses the mean method to divide them. For each personality, if the user’s feature score is higher than the mean value, it is determined as the type of personality. If the feature score is lower than the mean value, it is determined that it does not belong to the type of personality. As shown in Table 4, the division result is the correct output value of the paper experiment.
User’s label information
User’s label information
The experiment of the paper adopts precision, recall, and F1 score to evaluate the performance of the sentiment classifier. The calculation method is shown below. Table 5 shows the classification matrix.
Classification matrix
Among them, TP represents the number of positive examples that are classified correctly (true examples), FN represents the number of negative examples that are classified incorrectly (false negative examples), FP represents the number of positive examples that are classified incorrectly (false positive examples), TN represents the number of positive examples that are classified correctly (true Counterexample).
According to the values of TP, FN, FP, TN, the corresponding precision, recall, and F1 Score can be calculated.
Formula (8) to formula (10) shows the calculation method of recall rate, precision rate, and F1. In the binary classification system, precision refers to the proportion of correctly classified samples to the total number of samples, which reflects the classification performance of the classification model to the overall sample and the value range is [–1, 1]. The larger the value, the better the classification performance of the model. The specific calculation is shown in Equation (8). The recall rate is the evaluation of the overall data prediction of a category and its calculation is shown in formula (9).
F1 is the harmonic mean of recall and precision. The recall rate reflects the classification model’s ability to recognize positive examples. The higher the recall rate, the stronger the model’s ability to recognize positive examples. The precision rate reflects the model’s ability to distinguish negative examples. The higher the precision rate, the stronger the model’s ability to distinguish negative examples. F1 measurement is a combination of the two, with the value range of [0,1]. The higher the F1 measurement is, the more robust the classification model is. The specific calculation is shown in formula (10). In the sentiment binary classification problem mentioned in this article, the comprehensive evaluation of precision and recall rate F1 value is more important.
(1) Parameter setting
In the CNN-LSTM model, the convolutional neural network extracts the important feature information in the sentence through multiple convolution kernels and regularizes the matrix parameters to prevent the gradient explosion of the model. Based on constructing the model, the paper experimented and adjusted some model parameters, including the length of the word vector, the number of convolutional layers, the number of LSTM hidden layers, etc., so that the model results get the optimal value. Finally, the detailed parameter configuration of some CNN-LSTM experiments is shown in Table 6.
CNN parameter setting table
CNN parameter setting table
(2) Results analysis
The evaluation of a classifier is mainly to examine its generalization ability. Simply put, the training set and the test set should be separated when testing the performance of the model. Therefore, the paper uses a ten-fold cross-validation method, randomly classifying the data set by 7:3 each time, training the training set ten times, testing the test set ten times, and taking the average result of it as the final result of the model. To compare the performance of this model, this paper builds a random forest, support vector machine, and LSTM model for comparison. The results of the experiment are shown in Table 7.
classification results of CNN-LSTM model and the other machine learning
Table 7 shows the mean values of negative and positive tweets calculated by each classifier. It can be seen that the CNN-LSTM model has better performance than other models, which is 13% higher than the worst support vector machine model. It can be seen that only the precision of the CNN-LSTM model in forwarding microblog prediction is slightly lower than that of the Bayesian network. Besides, CNN-LSTM shows the best performance.
This experiment proves that the CNN-LSTM constructed can better predict the emotional tendency of short texts on microblogs, which has good generalization ability and higher precision than other methods.
The paper mainly described the process of constructing the CNN-LSTM model for short text sentiment prediction. To more directly show the model’s ideas and processes, the paper introduced the CNN-LSTM model from four aspects, namely the feature engineering method of the model, the convolution and pooling methods in the CNN model, the data transfer between CNN and LSTM and the determination of the activation function and other parameters in CNN-LSTM ...
After comparing it with other classification models, the paper proved the validity and rationality of the CNN-LSTM model. Besides, the research of text sentiment analysis in the field of personality prediction is gradually deepening. The next research will introduce the attention mechanism into the model constructed by LSTM.
Footnotes
Acknowledgments
This work was supported by the National Natural Science Fund (71701099) and National Key Research and Development Program of China (2018YFC0830400).