
Abstract
For the logistics transshipment center, it can combine historical data to compare performance vertically to clarify its own performance level and development trend, and clarify its own development shortcomings, and finally improve its own shortcomings to improve its performance. In order to study the performance evaluation methods of logistics enterprises, this paper builds a logistics enterprise performance evaluation system based on the non-radial and non-angle network SBM model based on machine learning algorithms. Moreover, this paper combines the idea of balanced scorecard to comprehensively analyze the operating efficiency of my country’s listed logistics companies through data envelopment analysis model, Malmquist index model and Tobit regression model. In addition, this paper uses the network SBM model to conduct a static analysis of vertical comparison of listed logistics companies in different stages and different industries and combines the Malmquist index to dynamically analyze the operating efficiency of listed logistics companies in my country from a dynamic perspective. Finally, this paper analyzes the company’s operating efficiency with examples. The results show that the model constructed in this paper has a certain effect.
Introduction
With the rapid development of new-generation information technologies such as the Internet of Things, cloud computing, and mobile Internet, China’s logistics industry has undergone transformation and upgrading. In addition, due to the decline of China’s demographic dividend, the logistics industry is again dominated by talents, and the logistics industry has begun to transform from labor-intensive to technology intensive. At the same time, the “new retail” and “last mile” put forward new requirements for the logistics industry. Smart logistics is born in this new era. Smart logistics uses big data, artificial intelligence and other high-tech applications to transform the logistics industry from the traditional model of carrying hands on one’s shoulders to a new logistics era driven by technology. With the advancement of science and technology and the state and enterprises’ support for technological innovation, the concept of smart logistics has gradually integrated into the logistics industry. Recently, my country has become the world’s largest logistics market, and the efficiency of social logistics has entered a period of rapid improvement. Moreover, a group of leading logistics companies lead the development of the industry, the logistics infrastructure has strengthened interconnection, and smart logistics has become a new driving force for transformation and upgrading. Therefore, in the “13th Five-Year Plan”, it is required to strengthen the application of modern information technology, increase the application of data and information integration, and promote the integration of business platforms and the intelligentization of operation units and routing management and control. At the same time, it also requires improving transportation and safety guarantee capabilities, improving service levels, and realizing automatic dispatch and rapid transfer of express mail, such as robots, drones, and unmanned vehicles. Driven by smart logistics, my country’s logistics industry has entered a new era of development, and the research on logistics has also entered a new stage [1].
The logistics industry has become an important part of the national economy, and we must focus on reducing logistics costs, strengthening logistics infrastructure network construction, and strengthening logistics standardization. Moreover, it is clearly stated that e-commerce logistics engineering is one of the twelve key projects for the medium and long-term development of the logistics industry, which indicates that the development of my country’s logistics industry has entered a new stage, with quality and efficiency becoming the focus. Various ministries and commissions have also issued a series of guiding opinions and development policies for the development of the logistics industry, which has greatly promoted the development of my country’s logistics industry [2].
For a logistics company, by carrying out performance evaluation activities in each transfer center, it can grasp the operation and development of each transfer center, and can analyze which transfer centers need more investment, and which transfer centers should be upgraded or eliminated based on the results. For the logistics transshipment center, it can combine historical data to compare performance vertically to clarify its own performance level and development trend, and clarify its own development deficiencies, and finally improve its performance based on the deficiencies[3].
Related work
Related logistics performance evaluation can be roughly divided into four directions: country (region) logistics performance evaluation, industry logistics performance evaluation, enterprise logistics performance evaluation and logistics node performance evaluation. The literature [4] ‘s research on national logistics performance is based on the LPI indicator system released by the World Bank. This research explored the relationship between LPI and variables such as GDP, logistics costs, and international trade. Moreover, the research pointed out that there is not much domestic research on industry logistics performance, and most of them focus on the logistics performance benchmarks of a certain industry to help companies in the industry identify their own strengths and weaknesses, and improve their competitiveness by comparing with industry leaders. The literature [5] proposed five dimensions of logistics performance evaluation indicators by establishing a three-dimensional structure of the retail enterprise logistics performance evaluation index system. When studying the logistics performance of production enterprises, the literature [6] used the four aspects involved in the balanced scorecard, namely, finance, customers, process, learning and growth, to establish a performance evaluation index system. The literature [7] combined the characteristics of self-operated logistics and the characteristics of equipment manufacturing enterprises to construct an evaluation index system that fully reflects and reflects the performance of equipment manufacturing enterprises’ self-operated logistics from transportation, inventory, information, and comprehensive aspects. The literature [8] introduced the external environmental elements of port logistics and combined the four elements of port natural conditions, port economic foundation, port logistics infrastructure, and port logistics development scale to finally determine the performance evaluation index system of port logistics. Based on balanced scorecard theory, key performance indicators and other theories, literature [9] established a set of performance evaluation index system for railway logistics center with development potential, service capability, and operation level as indicator dimensions. Moreover, it used the logistics centers of the Shanghai Railway Administration as the evaluation objects and put forward 12 practical suggestions. According to the characteristics of chain supermarket distribution activities, literature [10] constructed a distribution center performance evaluation index system from the operation process level, support level, and result level. This indicator system not only considers performance output, but also introduces elements that affect performance output (information activities, equipment level, management capabilities). Based on the comprehensive consideration of the influencing factors of the logistics park, the literature [11] constituted the performance evaluation index system of the logistics park from the aspects of logistics park facilities and equipment level, scale level, operation level and service level.
On the basis of considering the correlation between indicators, the literature [12] proposed an improved fuzzy comprehensive evaluation method, namely DEMATEL and fuzzy comprehensive evaluation method, to evaluate the performance of science fund projects. The literature [13] used network analysis method and fuzzy comprehensive evaluation method to evaluate the performance of logistics enterprises and pointed out that the weights obtained by this method are more reasonable, and the evaluation results are more scientific and reasonable. The literature [14] decided to use matter element analysis to construct a performance evaluation model after comparing and analyzing commonly used performance evaluation methods. The matter element analysis method is not limited by the number of evaluation objects, but it is highly subjective. The literature [15] used the efficiency coefficient method to evaluate the logistics operation performance of a tobacco company, and pointed out that the efficiency coefficient method can objectively and accurately calculate the true performance level of the enterprise by virtue of its advantage of not being interfered by subjective factors, which is suitable for the current enterprise situation
The literature [16] evaluated the correlation between the evaluation index vector of the fresh food processing distribution center (evaluation plan vector index) and the relatively optimal fresh food processing distribution center index vector (relatively optimal plan vector index) to evaluate the logistics performance of the distribution center inferior. The literature [17] used the entropy weight-TOPSIS model to calculate the cold chain transportation and distribution performance levels of four enterprises. The literature [18] constructed a CRITIC-TOPSIS model on the basis of considering the relevance and conflict of indicators, and comprehensively evaluated the construction service performance of 40 college libraries directly under the Ministry of Education. Based on the analysis of the shortcomings of commonly used evaluation methods, the literature [19] pointed out that DFS-SVM and PROMETHEEII can provide references for the multi-objective human-computer interaction performance evaluation of complex projects. The literature [20] introduced the “mutual evaluation” mechanism to optimize and improve DEA to form cross-efficiency data envelopment analysis (DEA), and combined this method with the fuzzy comprehensive evaluation method to evaluate the performance of each indicator separately. The literature [21] used the PCA-DEA combination method to evaluate the ecological welfare performance of 35 major cities in my country during the “Twelfth Five-Year Period” and used the DEA-Malmquist index analysis method to dynamically analyze the urban ecological welfare performance. From the evaluation methods adopted by scholars, we can see that scholars are not limited to using a single method but take a combination of multiple methods or improve methods to achieve more scientific, reasonable and accurate results.
The literature [22] found that enterprises are more inclined to systematically evaluate the internal elements of enterprise logistics, not limited to performance evaluation of logistics costs. The literature [23] used delivery time, delivery safety, delivery convenience and inventory capacity to evaluate logistics performance. The literature [24] believed that the logistics performance evaluation system includes index layer, tactical layer, strategic layer and logistics operation layer. Moreover, it divided the indicators into financial indicators and non-financial indicators, proposed that the evaluation indicators are mainly cost-based, and introduced indicators such as customer satisfaction, production quality, output rate, and asset utilization. The literature [25] advocated using perfect order rate, unit logistics cost, picking error rate, and order completion cycle as the core indicators of logistics performance evaluation. The literature [26] believed that indicators such as punctual delivery, warehouse capacity, transportation capacity, and purchase order time can evaluate the logistics performance of enterprises and ranked these indicators through the ANP method.
Data envelopment analysis method
The DEA model takes the research object as the decision-making unit, and comprehensively analyzes the input and output ratio of the decision-making unit to judge the effective production frontier. At the same time, it finds the reasons for the failure to be effective based on the ratio analysis and clarifies the direction in which invalid decision-making units should be improved to reach the effective state.
(1) CCR model based on constant returns to scale
The research on DEA method thus kicked off. The CCR model is a model that measures the “technical efficiency” and “scale efficiency” between different units under the condition of constant returns to scale. Since this model is established under the premise of constant returns to scale, it is also called CRS (Constant Returns to Scale) model.
If we assume that there are K decision-making units, the decision-making unit is MDU j (j = 1, ⋯ , k), these decision-making units are relatively comparable, and each decision-making unit has m kinds of inputs (which represent the consumption of human, property, etc.) and s types of outputs (which represent the effects of inputs), the input vector is X j = (x1j, x2j, ⋯ , x mj ) T and the output vector is Y j = (y1j, y2j, ⋯ , y sj ) T . In order to make the input volume and output volume have unity, we give weight to input indicators and output indicators. We set v and u to be the weights of input and output variables respectively, among them, X i > 0, Y i > 0.
x ij , y ij represents the input and output of the j-th decision-making unit, x ij , y ij > 0.
v i represents the weight of the i-th input, and u r represents the weight of the r-th output;
Then, the comprehensive value of the input of each decision-making unit is
In the calculation of the efficiency rating index, we can always choose the optimal weighting coefficients u and v to make h j ⩽ 1, j = 1, 2, ⋯ , k. If h k = 1 is assumed, it means that the efficiency of this decision-making unit is higher than the production efficiency of other decision-making units, that is, this system is relatively effective. If h k < 1, the production efficiency of the k-th decision-making unit is lower than other decision-making units, that is, this system is not relatively effective and needs to be improved. Therefore, the larger the value of h j , it means that the decision-making unit gets as much output as possible with as little input as possible.
Through the above analysis, with the goal of finding the maximum efficiency index of DMU
j
0
, the optimal CCR model (as shown below) can be constructed:
The above programming model is a fractional model, which needs to be transformed into a linear programming model to be solved. To this end, the model is used Charnes-Cooper transformation, we assume:
The obtained equivalent linear programming model P
CCR
is as follows: (x0 = x
j
0
, y0 = y
j
0
).
Duality theory is a very important theory in linear programming. The establishment of duality models will help to further analyze the theory and economic significance. Dual programming model D
CCR
In view of the convenience of calculation and discussion and application, we take slack variables and residual variables into the formula, and also consider non-Archimedean infinitesimal variables to realize the conversion from inequality constraints to equality constraints. The above formula is converted as follows:
Among them, λ j represents the weight coefficient of the input and output indicators, s+ and s- are the slack variables in the model, which represent the redundancy and deficiency of input and output respectively. In order to evaluate the effective value of DMU j 0 , we judge the effectiveness of DEA according to the following criteria.
In this model, if it is assumed that θ*, s+, s-, and λ* are the optimal solutions, there are three situations as follows:
The first case: θ* = 1, s+ = 0, s- = 0 represent DMU0 is invalid DEA. The meaning of its economics means that in an operating system composed of multiple decision-making units, the output of the decision-making unit has reached the relatively optimal output, that is, the technical efficiency and scale efficiency of the decision-making unit have reached effective;
The second case: if there is θ* = 1, DMU0 is called weak DEA effective. Its meaning in economics means that in the operation of a system composed of multiple decision-making units, technical efficiency and scale efficiency have not reached the same time. Then, the output s+ can be increased while keeping the input constant, or the input s- can be increased while keeping the output constant, so that DMU0 can reach DEA effectively;
The third case: if there is θ* < 1, DMU0 is called non-DEA valid. At this point, we need to adjust the economic structure of the decision-making unit, that is, adjust the input and output according to the redundancy.
(2) BCC model based on variable returns to scale
Because the prerequisite of the assumption of the CCR model is that the scale return of the production technology remains unchanged, or all the decision-making units DMU are in the optimal production scale stage. However, in actual situations, many decision-making units are not completely in the state of optimal production scale, so the technical efficiency obtained by the CCR model includes scale efficiency. Facing the problems of the CCR model, the technical efficiency obtained by this model does not consider the impact of scale efficiency, so it is called “Pure Technical Efficiency” (PTE). This model is mainly used for the relative technical evaluation of the evaluated unit. The expression of BBC is:
Among them, μ < 0 represents increasing returns to scale, μ = 0 represents constant returns to scale, and μ > 0 represents diminishing returns to scale.
The dual programming model D
BCC
is:
Slack variables and residual variables are taken into account in the formula, and the dual programming model for non-Archimedean infinitesimal variables is:
In the above formula, if the optimal solutions θ*, s+, s-, and λ* satisfy θ* = 1, s+ = 0, and s- = 0, DMU0 is technically effective, otherwise it is non-technically effective. If the technology is effective, the three situations corresponding to its return to scale are as follows:
Since the traditional DEA model regards the entire internal production and operation system of a logistics enterprise as a “black box”, this method does not fully consider the operation and integration of internal resources in the “black box”, and only uses “input resources-output products” or to measure the operating efficiency of the enterprise from the perspective of profit, it is easy to cause the overall efficiency of the system to be overestimated, and it cannot effectively reflect more information to guide managers in management and decision-making. Aiming at the shortcomings of the traditional DEA model, the model decomposes and refines the business operation process of the enterprise into several consecutive sub-phases and analyzes and evaluates the efficiency of each sub-phase, and then explore the impact of each node or sub-phase on the overall efficiency. However, this model is a radial model, and the input-output improvement must be proportional, that is, it does not consider the impact of input and output slack variables. Tone and Tsutsui (2009) proposed a network SBM model. This model has the characteristics of non-angle and non-radial, which overcomes the limitation of “input-output” equal ratio (non-equal ratio). To a certain extent, it makes up for the defects of network DEA, thereby making the measurement value of enterprise operating efficiency more accurate and reasonable. The basic model is as follows:
We assume that there are n DMUs, and each DMU consists of K subsystems. m
k
and r
k
are the input and output quantities of the k-th stage of the subsystem, respectively. The link between stage k and stage h is denoted by (k, h) and (h, k) ∈ M. Among them,
Among them,
The measurement of the network SBM method is a measurement of the relative efficiency of different decision-making units in the same period from a horizontal perspective, and it is a static measurement of the efficiency of different decision-making units. However, the Malmquist Total Factor Productivity (TFP) is developed on the basis of DEA, which is a dynamic state of total factor productivity in different periods of different decision-making units. Since the network SBM model used in this paper cannot compare different DMUs in different periods, this paper chooses to combine the SBM model with the Malmquist index analysis method to reflect the changes in the time series of different decision-making units. The Malmquist Total Factor Production Index reflects the changes in enterprise productivity in periods t and t + 1. When the total factor productivity index is greater than 1, it means that the productivity level of the decision-making unit in the interval has increased, and the overall efficiency has increased. When the total factor production index is equal to 1, it means that the total factor productivity has not changed during the period. When the index is less than 1, it indicates that the productivity level of the enterprise during the period is in a downward state, and the overall efficiency has declined. According to the research of Fare et al., the total factor productivity index can be decomposed into production technology progress index (TC) and technical efficiency change (TEC). The production technology progress index reflects the dynamic changes in the technological progress of the decision-making unit from t to t + 1. The change index of technological progress greater than 1 indicates that the overall technology is progressing. If the technological progress index is less than 1, the production technology of the decision-making unit in the period t to t + 1 is degraded, and technical input needs to be strengthened. The change in technical efficiency reflects the dynamic changes in the appropriateness of the management method of the decision-making unit during the period. If the technical efficiency change index is greater than 1, it means that the technical efficiency has improved, and the management and decision-making methods of the enterprise are correct. The technical change index is less than 1, indicating that the technical efficiency is not good, and the management mode and decision-making method of the decision-making unit are insufficient and need to be improved.
The basic model of super efficiency network SBM
We assume that there are n DMUs, and each DMU is composed of K (k = 1, 2, , k) subsystems. m
k
and r
k
are the input and output types of the k-th stage of the subsystem, respectively. The link between stage k and stage h is denoted by (k, h), (h, k) ∈ M. Among them,
From the solution of the above model, it can be obtained that the decision-making unit
In order to confirm the feasibility and operability of the research results of this paper, this paper selects the Zhejiang Transshipment Center of Y Company for empirical analysis. Y company is a comprehensive logistics enterprise focusing on providing customers with cost-effective products and services. It is mainly engaged in large ticket business and small ticket business, with a network covering 31 provinces. Select Y company’s transshipment center as an example to conduct an empirical analysis of the performance evaluation of the logistics transshipment center, so as to demonstrate the feasibility and applicability of the performance evaluation index system and method of the logistics transshipment center proposed in this paper. Table 1 and Fig. 1 show the volume of Y company’s transshipment center.
Cargo volume of each transshipment center (10,000 tons)
Cargo volume of each transshipment center (10,000 tons)
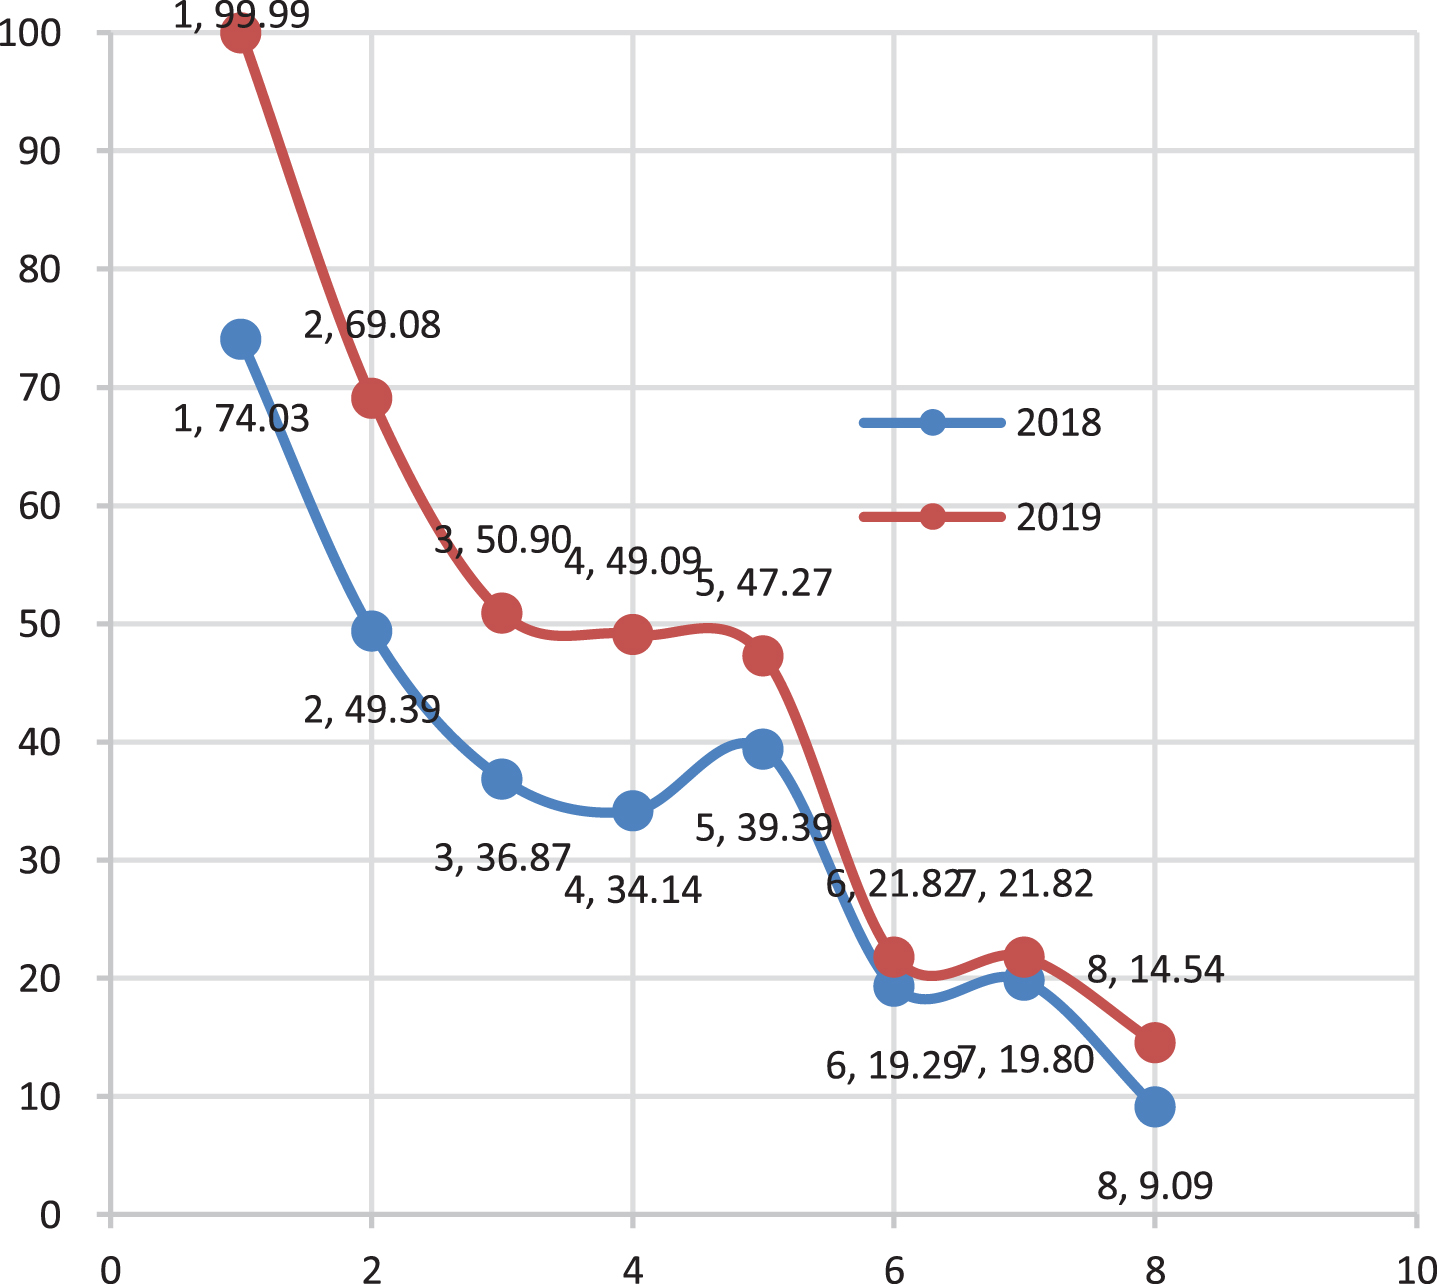
Statistical diagram of cargo volume in each transshipment center.
The first-level index judgment matrix calculated by comprehensively processing the opinions of experts is shown in Table 2, and the corresponding statistical diagram is shown in Fig. 2.
Judgment matrix of first-level indicators

Statisticaldiagram of the judgment matrix of the first-level indicators.
The judgment matrices of the indicator layer are shown in Tables 3 9, and the corresponding statistical diagram are shown in Figs. 3 9.
Single hierarchical arrangement of development potential
Single hierarchical arrangement of service capabilities
Single hierarchical arrangement of operation level
Single hierarchical arrangement of the overall quality of employees
Single hierarchical arrangement of handling capacity
Single hierarchical arrangement of operating timeliness
Single hierarchical arrangement of service quality
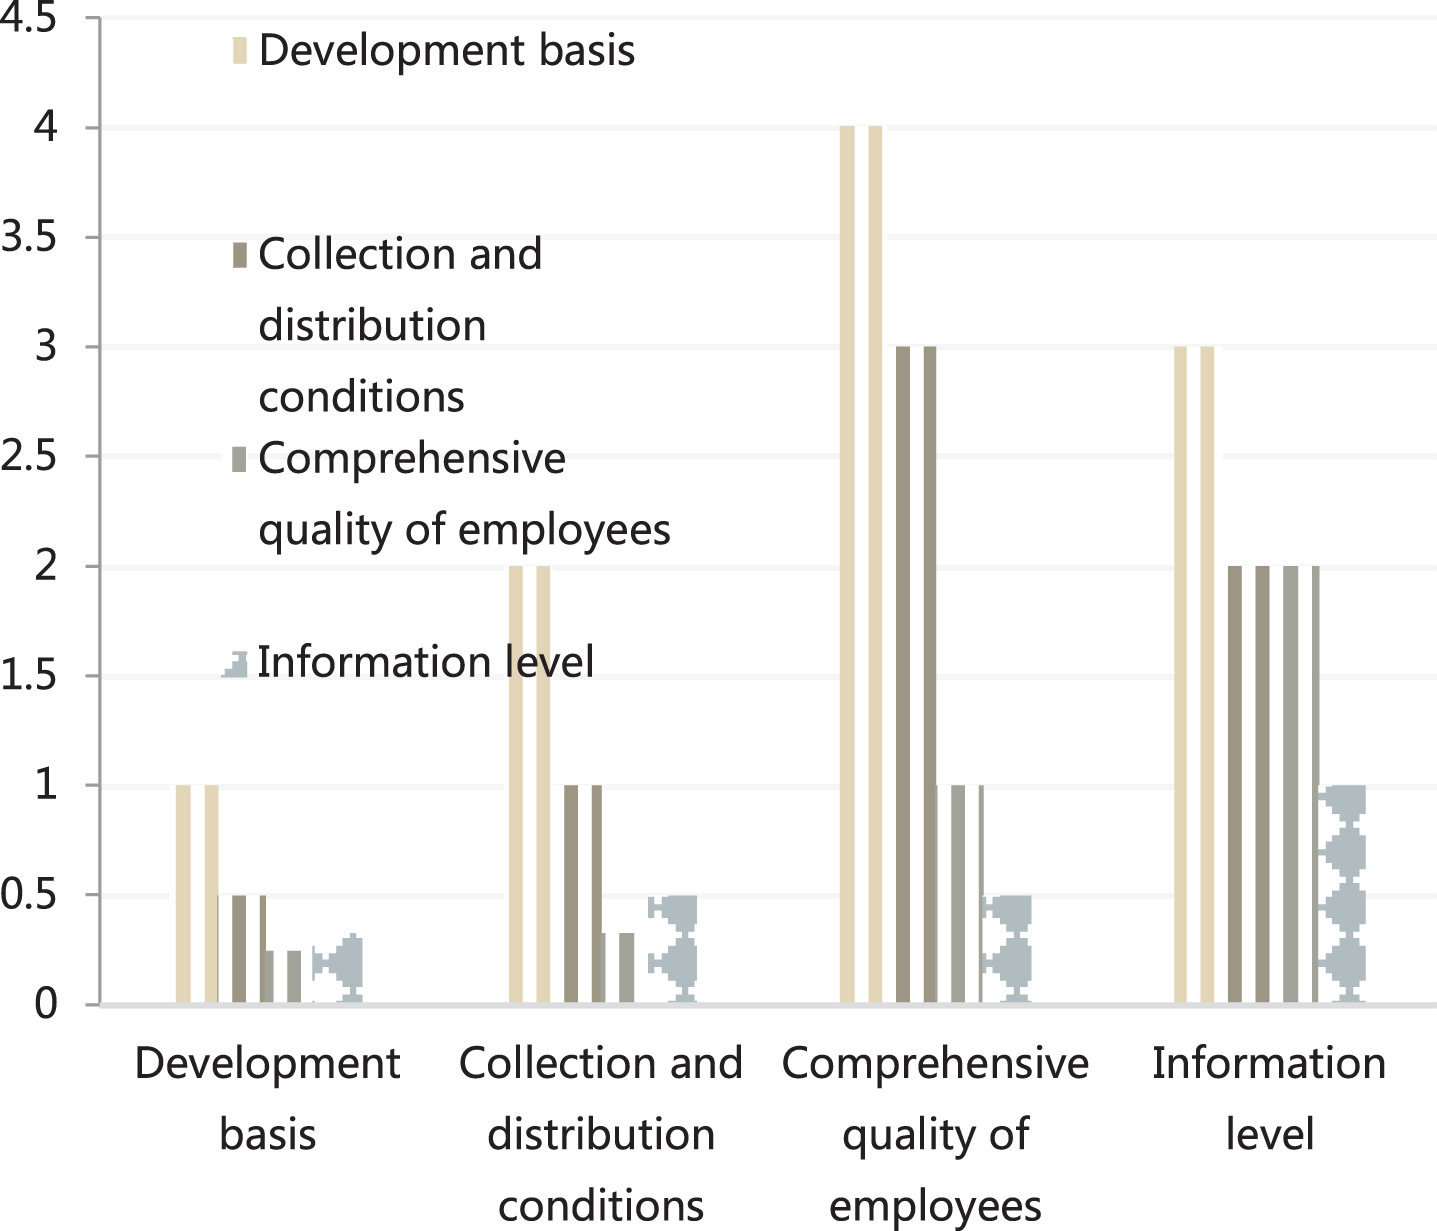
Statistical diagram of single hierarchical arrangement of development potential.

Statistical diagram of single hierarchical arrangement of service capabilities.
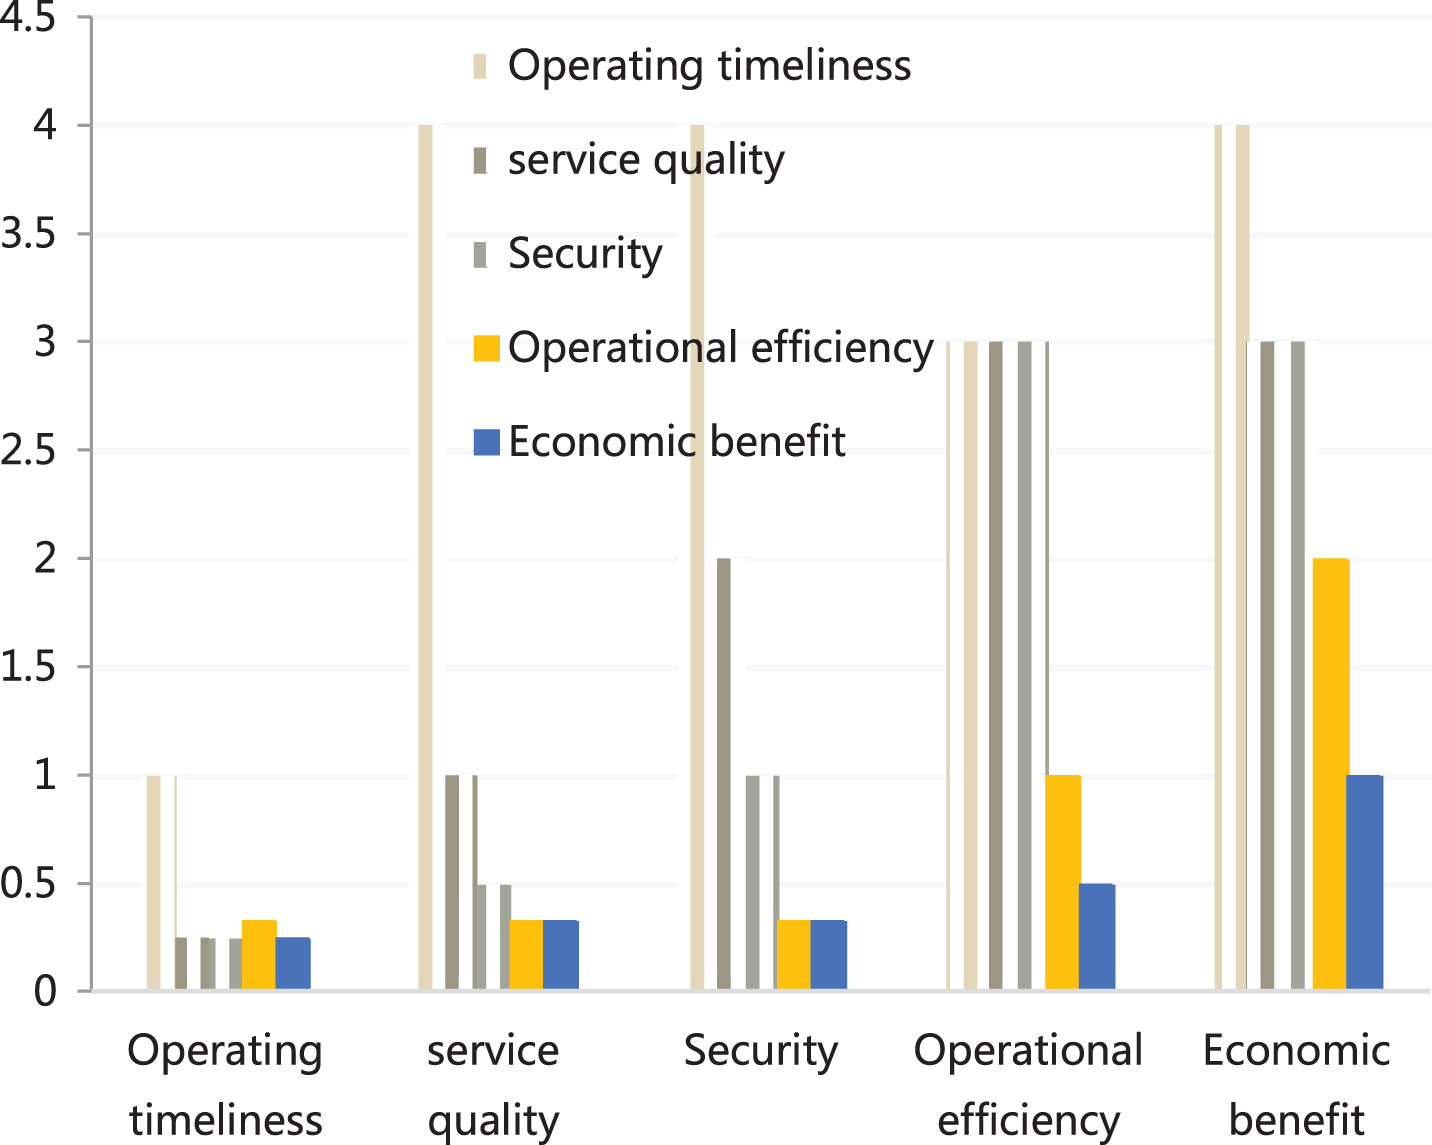
Statistical diagram of single hierarchical arrangement of operation level.
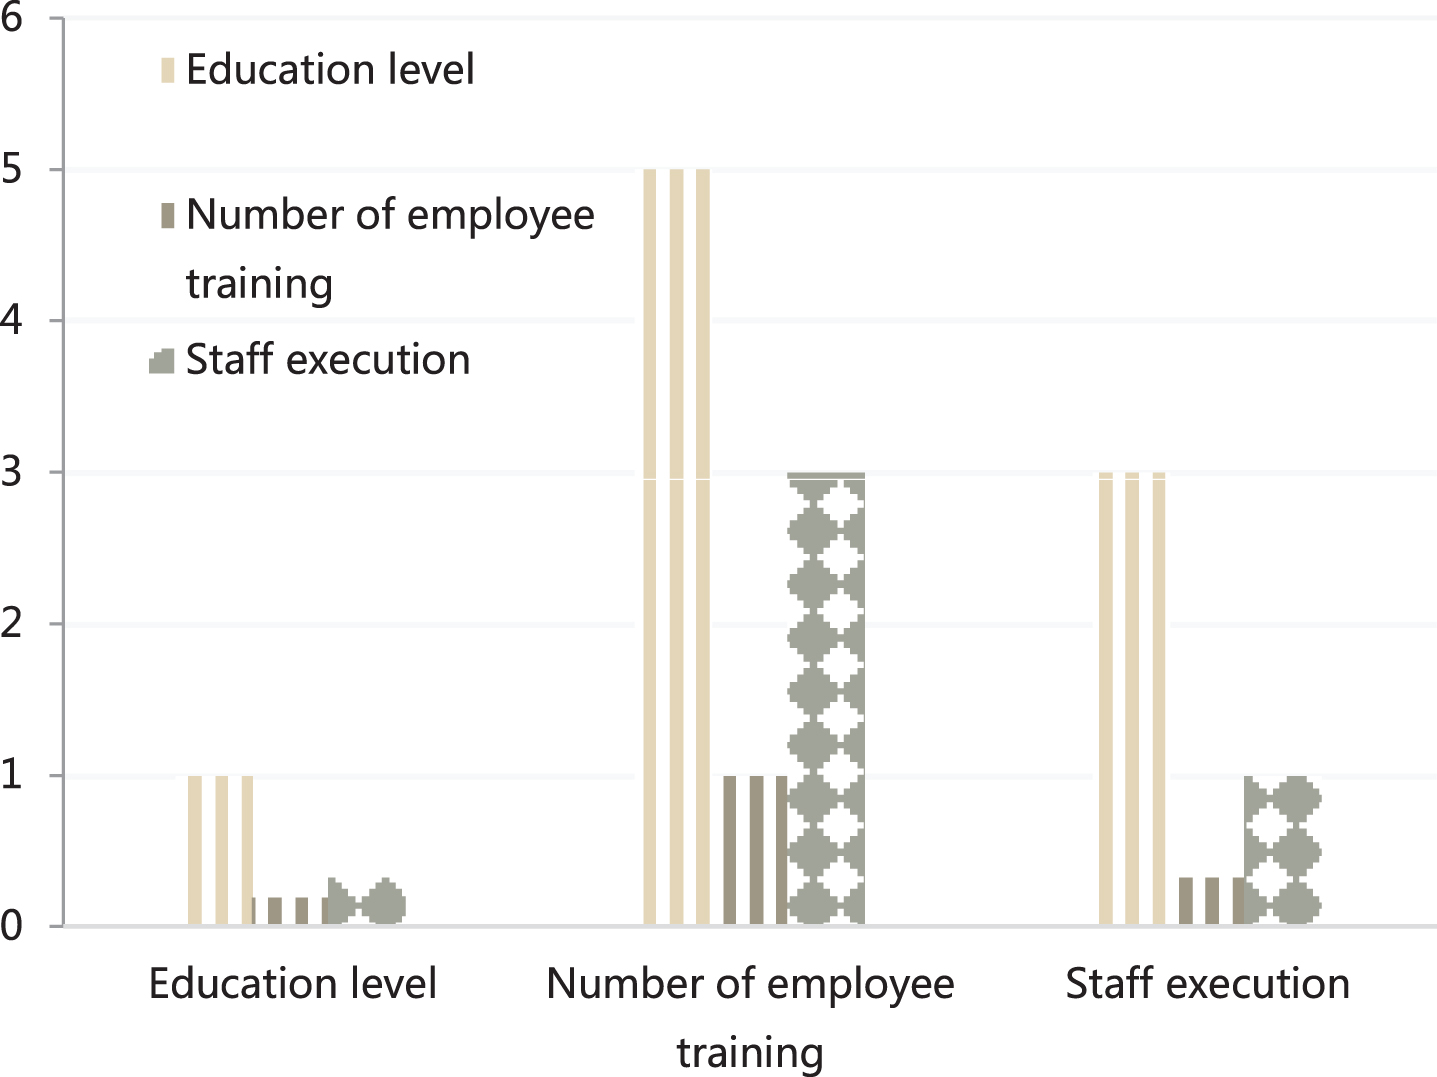
Statistical diagram of single hierarchical arrangement of employees’ comprehensive quality.

Statistical diagram of single hierarchical arrangement of handling capacity.
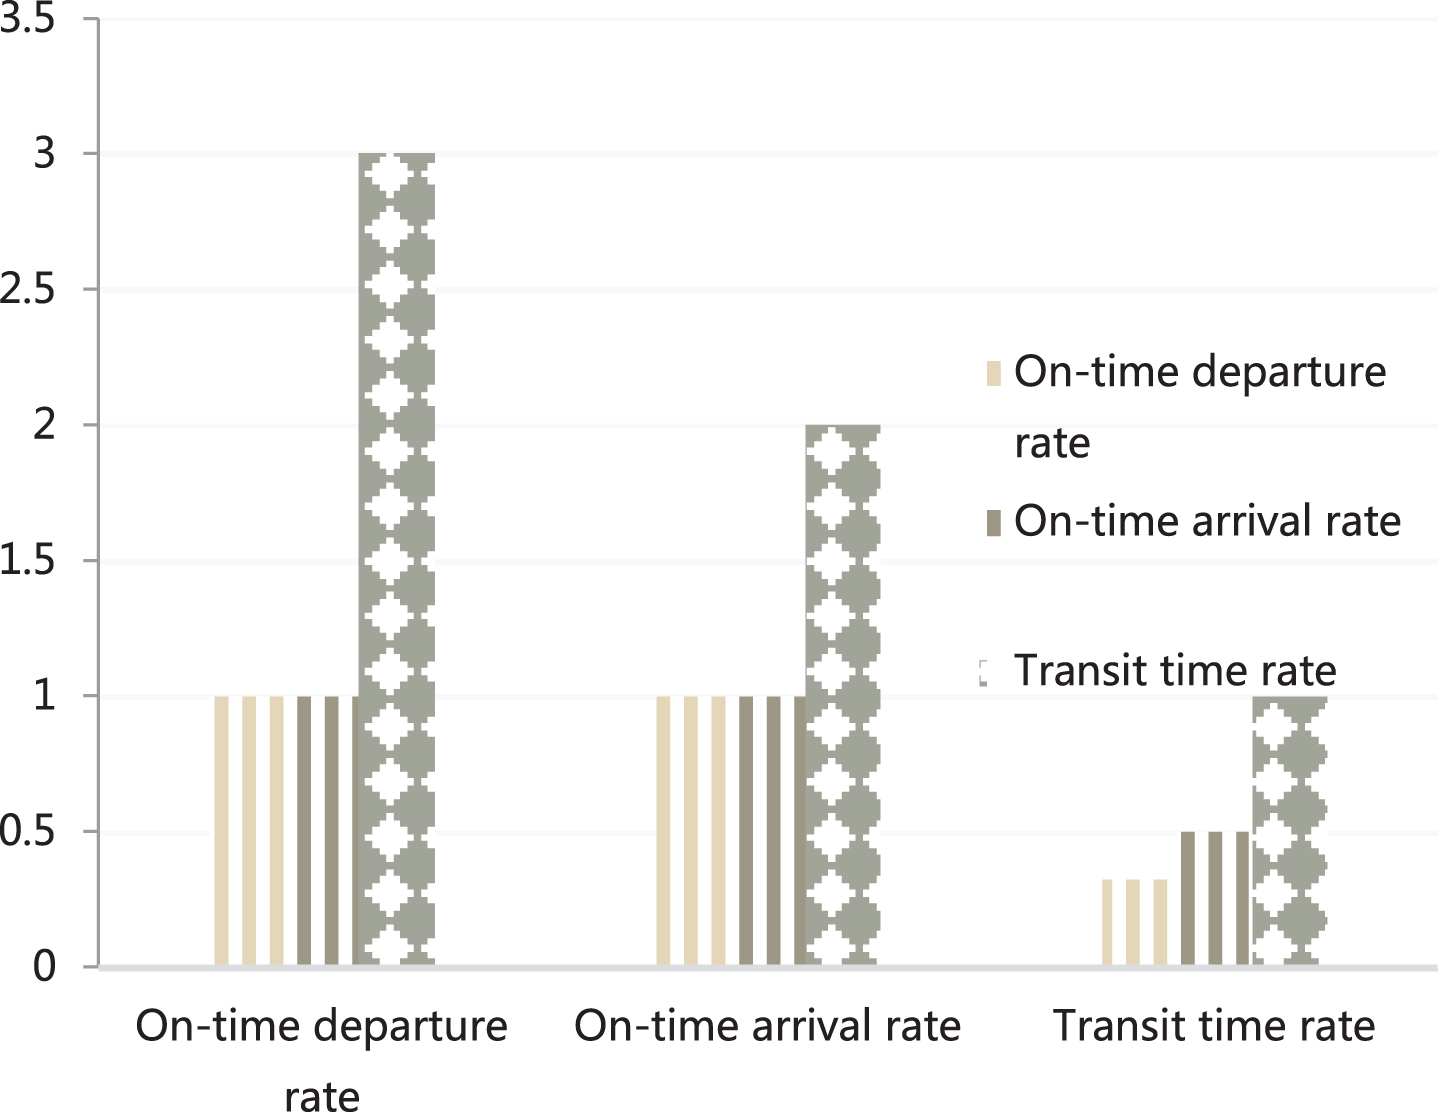
Statistical diagram of single hierarchical arrangement with timeliness.

Statistical diagram of single hierarchical arrangement of service quality.
The combination weights of the performance indicators of the transfer center are shown in Table 10 and Fig. 10.
Combination weights of performance indicators of transshipment center
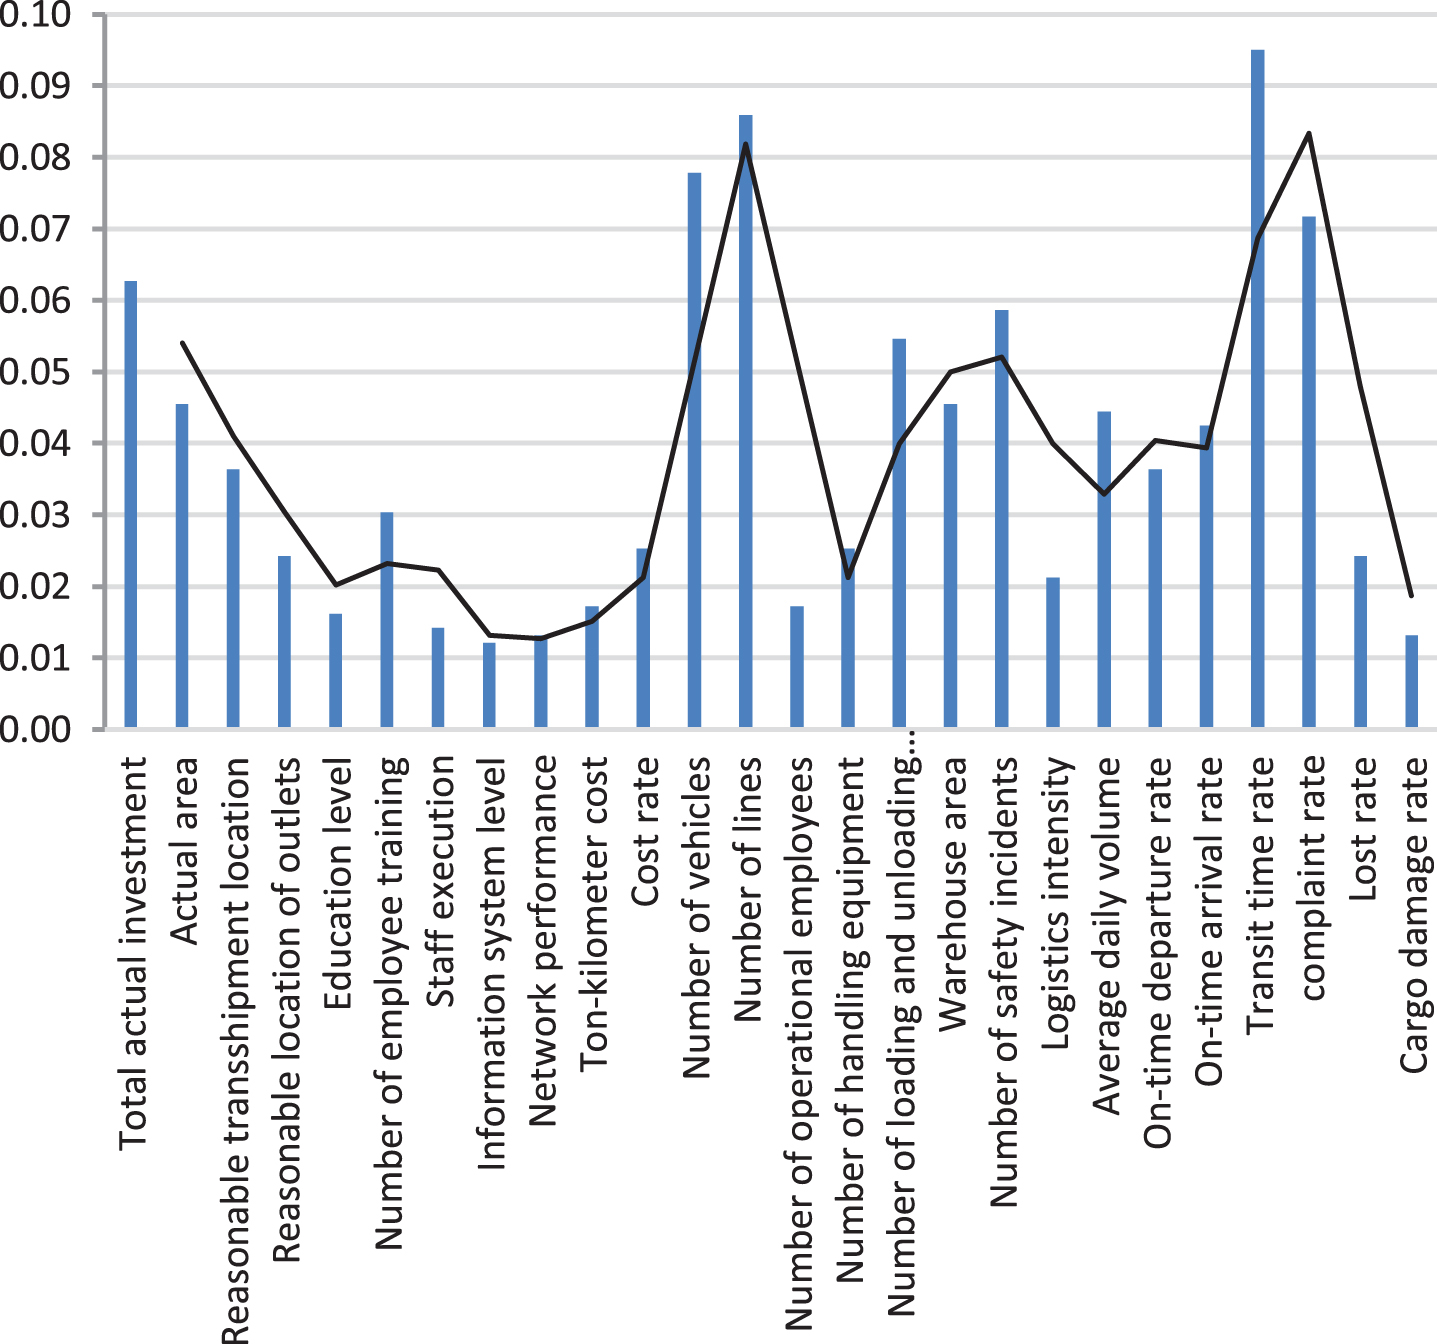
Statistical diagram of combination weights of performance indicators for transfer centers.
The results of the performance analysis show that the comprehensive quality of employees of Jinhua Transfer Center ranks seventh, and the comprehensive quality of employees needs to be improved to promote its long-term development. Logistics talents are the foundation of the sustainable development of logistics transshipment centers and the creators and inheritors of core competitiveness. Logistics talents must organize and collaborate through effective platforms, channels and mechanisms to create greater and more social value and life value. In the final analysis, the difficulty in the development of logistics transshipment centers is the lack of a professional talent team, so logistics should focus on selecting, educating, and retaining people.
The current development of logistics transshipment centers is mainly based on transportation and warehousing services. The service content and scope are relatively narrow, and the development of value-added services based on information technology is relatively slow, such as logistics information services, order management, inventory management, and cost control. Value-added services based on information technology are obviously lagging behind developed countries. The backwardness of information technology has severely restricted the automation and intelligence of information technology collection, management and decision-making.
When planning the storage area, it is necessary to adapt to the logistics operation process to facilitate the optimization of operations, to achieve one-time operations, reduce the number of transportations, shorten the transportation distance, and avoid unnecessary transportation links. Generally, when planning a cargo area, it is not advisable to plan a route with a large volume of goods to an adjacent cargo area to avoid warehouse explosions and roundabout operations. Lines with large volumes should be close to the loading and unloading ports, shorten the picking and handling routes of these items, and maximize operating efficiency. It is also possible to arrange large quantities of goods in storage areas close to the entrance and exit according to the size of the incoming and outgoing goods, shorten the picking and transportation routes of these items, and maximize the use of plane and space. The channel generally needs to plan the main channel and the auxiliary channel. The main channel can drive two forklifts normally, maintain straight operation, avoid roundabout and reverse operations, and improve operation efficiency. The parking space planning corresponding to the cargo area mainly considers the size of the vehicle, and the parking space corresponds to the corresponding cargo area. When the number of exits in the warehouse is not large, the planning should be based on the departure time of the route, and the vehicles near the exit should be sent in advance to avoid congestion.
The main function of the logistics transshipment center is transportation and storage, so the planning of the route is particularly important. The planning of the route should fully consider the cost, distance of the route, and the size of the vehicle based on the cargo volume, and temporarily optimize and adjust the route according to the changes in the cargo volume of the real-time route. By adjusting the route, it is possible to solve the situation of warehouse explosion and suspension of delivery in the logistics transshipment center, and to ensure the timeliness of the goods and reduce operating costs.
With the increase in cargo volume, increased investment, and expansion of service network coverage, the logistics transshipment center has been further upgraded and expanded. The logistics transshipment center is the node connecting the upstream and downstream in the multi-level supply chain, and its operational fluency is directly related to the operational fluency of the entire supply chain. The reasonable and scientific evaluation of its performance is a prerequisite to ensure its normal operation, and it is also a prerequisite to ensure the smooth logistics of the entire supply chain. Most companies pay attention to the location of logistics transshipment centers and ignore their performance evaluation. Moreover, the performance evaluation of the logistics transshipment center only focuses on the actual operation process, and often ignores its development potential and economic benefits, and it is difficult to meet the needs of enterprises and the market. Therefore, it is necessary to comprehensively consider the overall performance level of the logistics transshipment center from the internal process and external influencing factors. This paper creates a set of performance evaluation index system that can reflect not only the volume and efficiency of the logistics transshipment center, but also its short-term benefits and long-term development strategy, and provides appropriate evaluation methods to provide management directions for the decision makers of the logistics transshipment center. The logistics transfer center can better allocate resources, save costs, and improve the comprehensive competitiveness of its affiliated enterprises.