
Abstract
Neural decoding is a technology to analyze intentions produced by neural activities, which has important applications in military, medical, entertainment and so on. As a typical application, decoding electromyogram (EMG) signals into corresponding gestures is an important content. In order to improve the accuracy of EMG signals recognition, researchers often extract effective features from EMG signals and classify gestures by constructing a reasonable classifier. However, because of the stochasticity of the signals, this method is not robust enough. This paper proposes a convolutional neural network (CNN) based on feature fusion, which can automatically learn and classify features from time-domain(TD) and frequency-domain(FD). To make full use of information, two fusion methods are used and compared. Experiments show that the proposed fusion methods are superior to the traditional algorithm for both normal people and amputees, and have better performance compared with CNN method using only one kind of information.
Keywords
Introduction
Recently, human-computer interaction (HCI) plays an increasingly important role in human life. As a key point of HCI, neural decoding is a technology interpreting recorded signals from neural population into a specific instruction [1, 2]. It is of great value in many aspects of life, and helps researchers understand neural activity.
As a signal with strong stochasticity, electromyogram (EMG) signals can be inferred by extracting effective features and constructing an appropriate classifier. Time-domain (TD) features, frequency-domain (FD) features and time frequency features are common methods for feature extraction [3–8]. Jiang et al. [9] analyzed 8 different hand gestures with 2 different forces by zero crossing, slope sign changes, waveform length and mean absolute value in TD. However, these features are not robust enough for non-stationary signals. Hence, researchers pay attention to FD analysis methods and time-frequency domain analysis methods. Abdelouahad et al. [10] took median frequency, mean power frequency, and some TD features to seek the relationship between surface electromyogram (sEMG) signals and muscle contraction. Duan et al. [11] extracted time-frequency information with discrete wavelet transform and utilized wavelet neural network (WNN) algorithm to improve the performance of sEMG signal recognition. Further, they extended the work with WNN ensemble to analyze signals changing over time [12]. Khezri et al. [13] investigated an adoptive neuro-fuzzy inference system to analyze zero crossing in each level of the wavelet, and classified six gestures.
Besides feature extraction, many researchers focus on finding proper classifiers. Subasi et al. [14] optimized SVM with Particle Swarm Optimization (PSO) algorithm to classify EMG signals into normal, neurogenic and myopathic. Al-timemy et al. [15] concentrated on reducing training periods according to the classification score, conducting linear discriminant analysis for short latency.
Though these traditional methods based on TD and FD features are effective, they are usually used in the situation where gestures are not so many. Due to the difficulty in distinguishing handcraft features, the performance will drop with increasing number of gestures. This inspires researchers whether a feature learning method can be used for neural decoding.
With the progress of deep learning, convolutional neural network (CNN) has been widely used in various fields [16–19]. Instead of a feature projection before classification, CNN can learn a more proper feature set, which obtains higher recognition accuracy through end-to-end learning methods [20–22]. Considering these advantages, researchers use CNN for EMG analysis. Geng et al. [23] analyzed patterns inside the instantaneous values of high-density sEMG with a CNN. Du et al. [24] extended this work by employing a Siamese architecture for sEMG-based gesture recognition, and improved the recognition accuracy by training two auxiliary tasks. Wei et al. [25, 26] explored several multi-stream frameworks by taking different sEMG electrode or feature set combinations as input and fused streams with fully connected (FC) layers. Hu et al. [27] investigated a method to extract inter-channel information of sEMG signals, then proposed a structure associating CNN with attention mechanism and recurrent neural network to boost the performance, which reached state-of-the-art results in many datasets. Zhai et al. [28] took principle component analysis (PCA) on spectrogram to form a feature matrix, and then demonstrated a CNN for datasets from both intact subjects and amputees.
The sEMG signals in multi-electrodes represent how channel information changes through space and time. In order to solve the similar problems in action and expression classification, Refs. [29, 30] used CNN to extract and classify temporal and spatial information respectively, and fuse them in the softmax layer. Inspired by the scheme, this paper first proposes two kinds of methods to extract relevant information in both TD and FD. Rather than a low-pass filter with cut-off frequency of 1 Hz for data preprocessing in Ref. [23], the information in high frequency band is also concerned as supplementary information in the strategy. Then, two types of information are fused in the feature layer and softmax layer respectively to improve the accuracy.
This paper is organized as follows. Section 2 briefly describes materials information and the CNN model. Section 3 introduces the preprocessing methods and classifiers on different data information. Section 4 shows the effectiveness of two proposed fusion methods. Section 5 discusses the experimental phenomena. Finally, conclusions and future work are given in Section 6.
Materials information and CNN model
Materials information
This work uses Datasets from Ninapro project. Seven publicly accessible datasets are published in this project that many researchers take them as benchmark databases [31–33]. As the statement in Ref. [28], EMG signals in FD mainly range in 0-700 Hz. According to the sampling theorem, to obtain complete FD information, sampling frequency should be higher than twice the maximum frequency of EMG signals. So two datasets named DB2 and DB3 are selected for experiments. Both of them are at a sampling frequency of 2000 Hz, and represent intact subjects and amputees respectively [34, 35].
In DB2 dataset, a total of 12 electrodes are used for 40 intact subjects. Including eight electrodes equally spaced around the forearm, two were placed on the main activity spots of the flexor digitorum superficialis and extensor digitorum superficialis, and two were on the main activity spots of the biceps brachii and of the triceps brachii (see Fig. 1). During the collection, subjects were asked to seat at a desk to make arm comfortable. For visual guidance, a laptop showing performed gestures is placed in front of subjects. There were totally 50 groups of gestures recorded in the dataset, each group of gestures was repeated 6 trials and lasted for 5 seconds. Between each two trials, a period of 3 seconds was arranged for rest in case of muscle fatigue. Specific information of DB2 and DB3 is shown in Table 1.
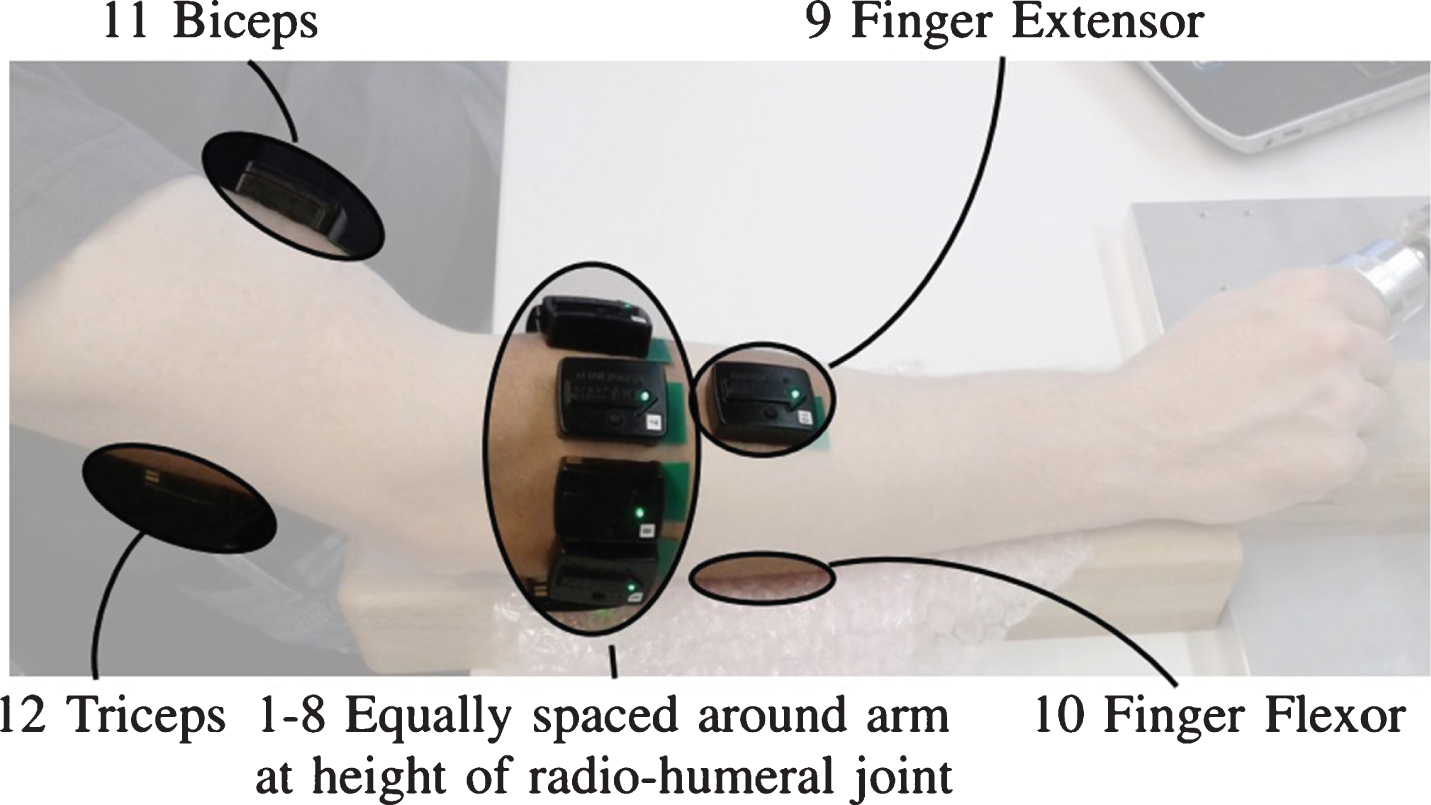
The placement of electrodes [34].
Subjects summary in DB2 and DB3
The DB3 dataset is similar to the DB2 except that signals were collected from 11 amputees, which requires robustness of classifiers. Specific amputees’ information is shown in Table 2. Because there exist missing performed movements in subjects 1, 3 and missing electrodes information in subjects 6, 7, datasets from rest subjects are conducted in experiments.
Subjects information in DB3
As most works do, a 49-classes intra-subject classification is performed in all the experiment progress (rest gesture excepted). Following the protocol in Refs. [26–28, 33], the second and fifth trials of each gesture are used for testing, while the rest are for training. The accuracy of subject i is calculated as follows:
The common CNN architecture consists of convolutional layers, max pooling layers and FC layers.
The convolutional layers extracting features with kernels are represented by k.
By calculating maximum on part of features, the pooling function can reduce model size, increase computation speed and improve the translation invariance of features.
As for FC layers, classification can be finished by the weight matrices and bias vectors.
Then the probability distribution of each class is calculated by inputting the final output score
Since DB2 collects the sEMG signals from normal people, it has more obvious patterns relative to the DB3 from amputees. At the same time, considering computational complexity, the first 10 subjects of DB2 are chosen as a subset to determine the parameters and structure of CNN. Although this cannot obtain a global optimal network structure, the results can provide guidance for network design while balancing the computational cost and performance. According to Refs. [36–38], a delay less than 300 ms can make subjects imperceptible in real life. So EMG signal is divided into segments with length of 200 ms (400 data points). To make sufficient number of training data, the data is double augmented with an overlap of 100 ms. For gestures classification based on sEMG signals, when gestures are executed, different parts of muscle will produce different degrees of contraction. As is discussed in Ref. [10], there is a positive correlation between muscle contraction and the activity intensity of sEMG signals detected from various electrode placements. In this paper, sEMG signals are preprocessed in a proper way to evaluate the activity intensity in TD and FD respectively.
TD method
For TD information, the amplitude of sEMG signals directly reflects the signal intensity. However, due to the stochasticity of the signal, it is common to get ideal amplitude estimation by reasonable preprocessing.
In previous works, a combination of the preprocessing methods including root mean square (RMS), low-pass filter, full-wave rectification and down-sampling in TD is leveraged to evaluate the amplitude of sEMG and eliminate noise [39]. Ref. [40] has proved full-wave rectification after low-pass filtering is a standard amplitude estimation method. Given these experiences, four methods are adopted to explore the appropriate preprocessing method.
Method1: low-pass filter, RMS.
Method2: RMS, low-pass filter.
Method3: full-wave rectification, low-pass filter, down-sampling.
Method4: full-wave rectification, down-sampling, low-pass filter.
These methods mean that the raw EMG signals are successively processed by the described preprocessing progress before segmentation. Function down-sampling turns the sample rate into 100 Hz. RMS is conducted with a window size of 20 data points, which is equal to the overlap between windows. The low-pass filter means a first-order Butterworth filter with cut-off frequency of 1 Hz. To be noticed, Method4 is the similar preprocessing methods mentioned in Ref. [27], and Method1 is the way used in Ninapro DB1 dataset.
In Ref. [23], Geng et al. proved an effective preprocessing method by using low-pass filtering on DB1 dataset, which has been processed by the acquisition device as stated above. Inspired by the method, there is a low-pass filter behind all four methods for comparison. In this situation, parts of methods 2 and 4 may be replaced by a higher order filter, but this is not the focus of this work. In addition, as DB2 collects raw signal, the magnitude value is so small that CNN parameters must be adjusted carefully during experiments. To solve the problem, data in DB2 is digitally amplified before four methods for comparison, and the magnification is 1000.
In summary, four preprocessing methods are proposed. In each preprocessing method, whether to use the digital amplification and whether to conduct low-pass filter behind are discussed. The dimension of preprocessed data is 12 * 20 * 1 (channel number * height * width).
Referring to Ref. [25], a multi-stream CNN structure which consists of 1D convolutional layers in TD is shown in Fig. 2. Preprocessed information in each electrode channel is used as one stream input of the network. Each stream consists three kinds of layers, batch normalization (BN) layers (yellow), convolutional layers (blue) and locally connected layers (green). A Relu non-linearity function is chosen as the activation function. The number of kernels in the first three layers are 64 while the last layer has only 32 kernels. All the kernels share the same size of 1*3. TD feature network constituted by 12 streams will converge to three FC layers (red), in which the nodes are separately 1024, 512 and the number of gestures. The dropout in the first two FC layers is 0.5.
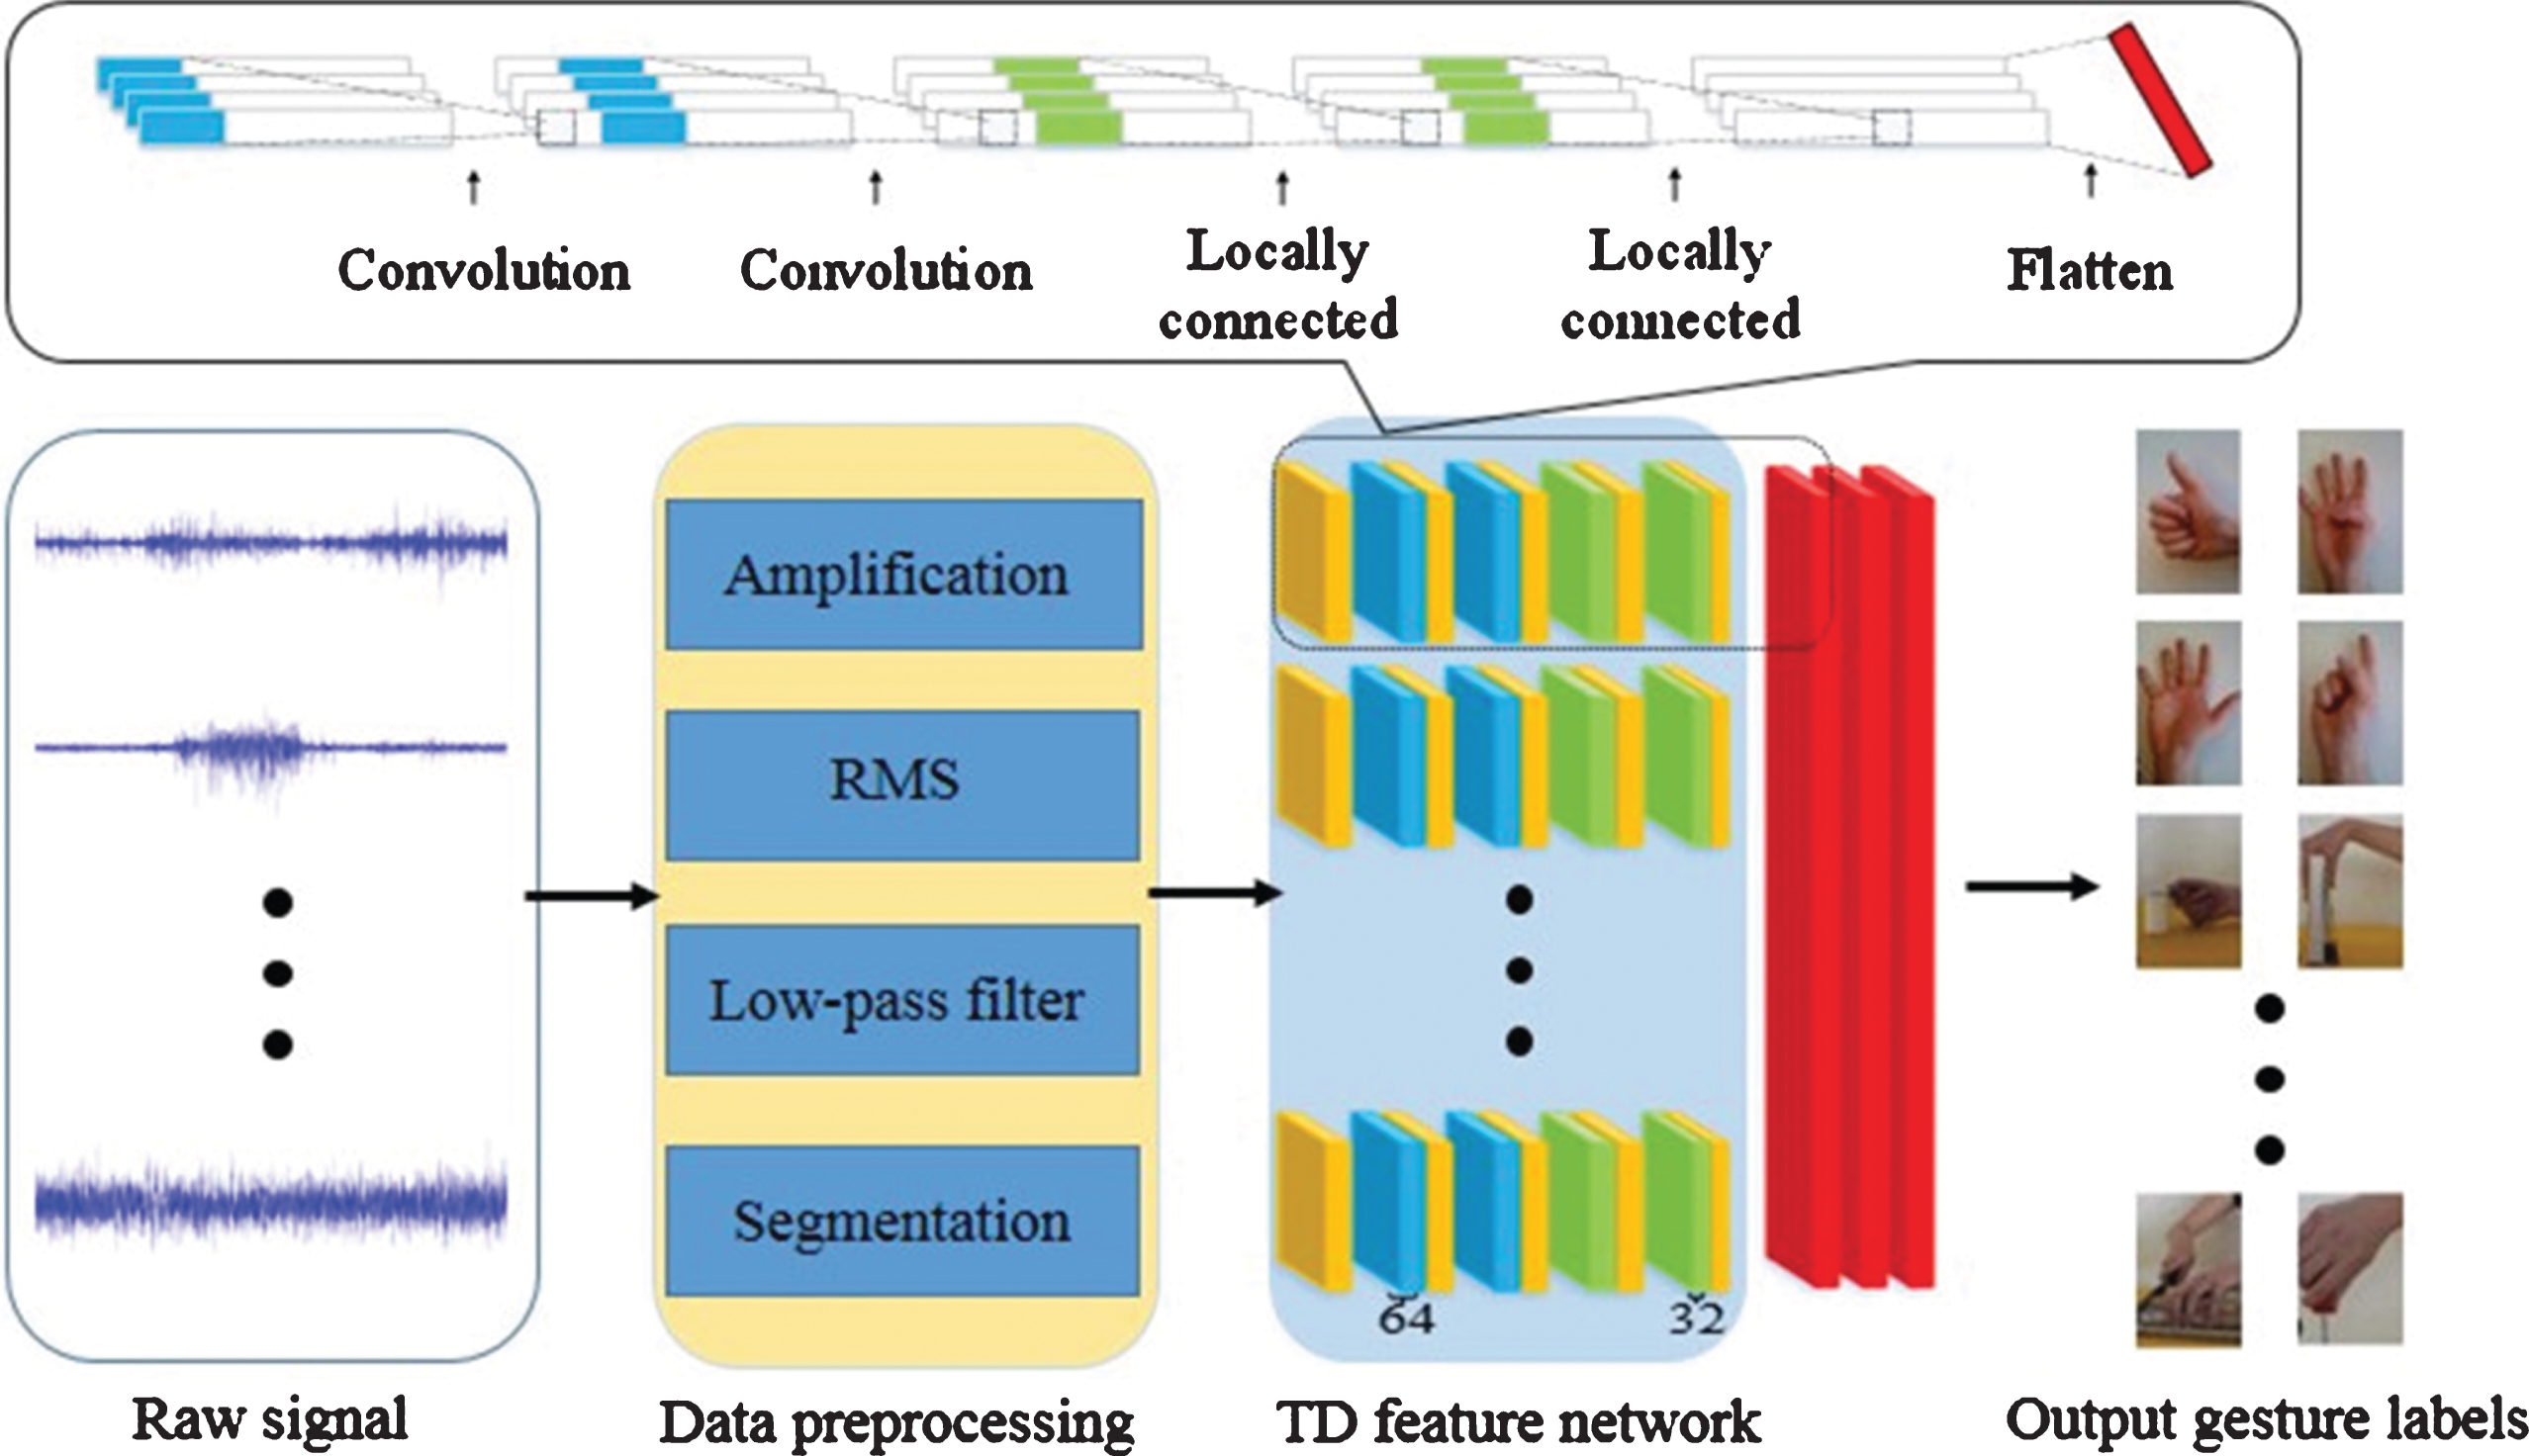
TD network structure.
Table 3 gives the recognition results of different preprocessing methods. In all situations, method2 with both amplification and filter makes the best result, so it is chosen as the preprocessing method in latter experiments. Compared with preprocessing on the raw signal, amplification can effectively increase the sensitivity of the neural network (about 3% increment in accuracy). Besides, conducting filters can better eliminate noise disturbance (83.71% VS 84.36% in the proposed method). At the same time, because of an additional smooth function, RMS performs better in signal smoothing and amplitude evaluation than the combination of rectification and down-sampling.
Recognition accuracy in different preprocessing methods (%)
Suppose the preprocessed dataset with N samples in TD is
For FD information, spectrogram is one of the information that directly reflects the signal intensity. However, there exists redundant information in the conversion process. So it is necessary to filter out the useless information in the spectrums.
According to Ref. [28], spectrogram is calculated by short-time Fourier transform (STFT) with a Hamming window sized 256 data points and an overlap of 184 data points. Then L1 normalization and PCA are adopted for dimension reduction. To eliminate redundant information, the first 25 principal components are selected to form a 5 * 5 feature matrix. Then the dimension of input will be 12 * 5 * 5 (channel number * height * width).
The FD network is shown in Fig. 3. In this method, slow fusion architecture is employed, which has shown strong performance in video recognition [41]. Different from video classification, each sub-stream represents an electrode channel rather than a video frame. It cannot merge streams at a distance of few frames apart as Ref. [41] does. So the fusion methods are still valuable to be discussed in EMG signals. As seen in Fig. 3, the information of the electrode channel is fused by slow fusion, early fusion and late fusion, respectively.
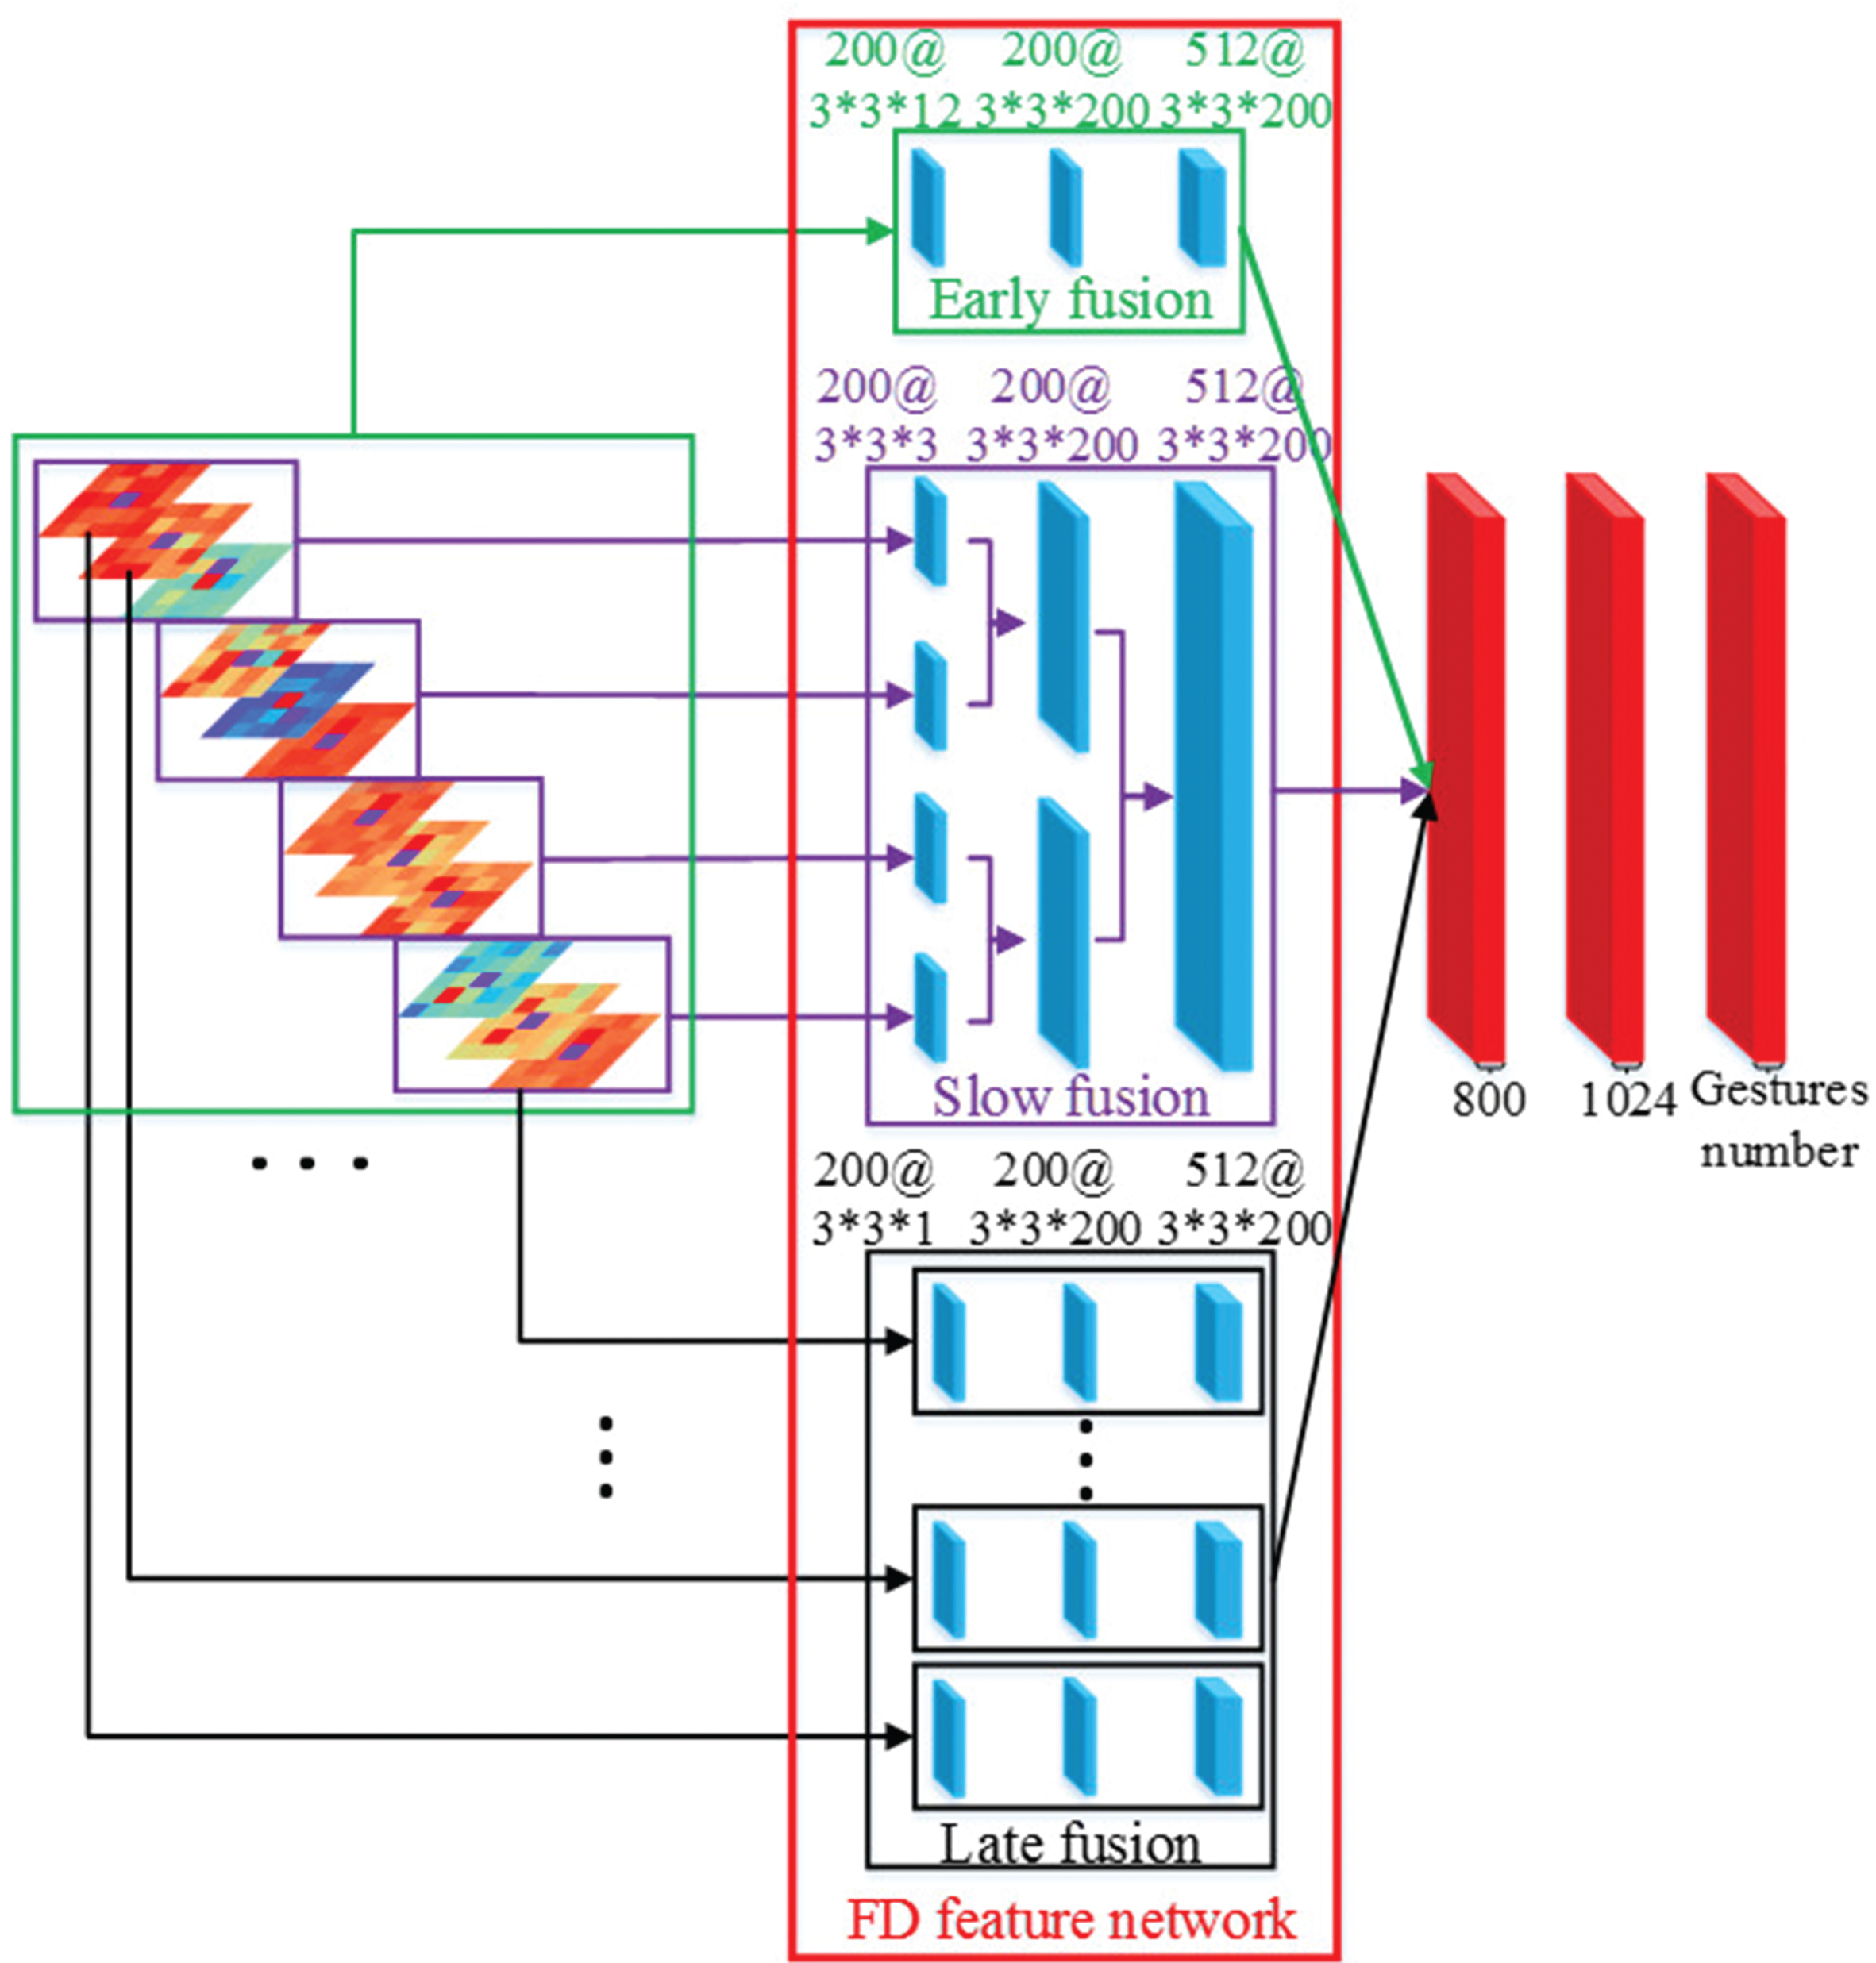
FD network structure.
All fusion methods include only convolutional layers (blue) and the FC layers (red). A Relu activation function is followed by each convolutional layer. For sake of comparison, the kernel number of convolutional layers in all fusion methods is a structure of 200, 200, 512, and the node numbers in FC layers are separately 800, 1024 and the number of gestures. Besides, all convolutional layers share the same filter size of 3 * 3. The dropout is equal to 0.5. The early fusion method combines information across all the electrodes. The late fusion first extracts features in each electrode channel, and then fuses them in FC layers. The slow fusion method combines each three channels as a group to input the network, then fuses them progressively to get valuable information.
In Ref. [42], the author used the idea of slow fusion in the classification problem of EMG signals. Different from that, the network in this paper does not contain any pooling layers because of the small size of preprocessed data sample. Besides, BN layers are not used as they are with no help to the result (about 1% drop).
Similarly, donating the dataset with N samples in FD as
The extracted features and the final output score in FD are separately:
The loss function is calculated by:
For a classifier, accuracy, precision, recall and F-score are the common methods to measure its performance [43]. The precision and recall are conducted as follows:
Results of different fusion methods are illustrated in Table 4. It can be seen that because slow fusion method combines information in electrodes more effectively, the accuracy and F-score in slow fusion (0.9% and 0.54% higher in accuracy, and 0.92% and 0.56% higher in F-score) show better performance. So the features from slow-fusion method will be used for fusion in the future work.
Results in different fusion methods (%)
Apart from determining the models and preprocessing methods, data augmentation is also discussed. As described above, this paper mainly uses the ‘sliding window’ method for data augmentation. In order to find proper amount of data, the overlap between windows is adjusted, resulting in data doubled, tripled, quadrupled and quintupled separately.
Accuracy results are shown in Fig. 4. It can be seen that when data is tripled, the best performance is obtained in TD, and it gets highest growth in FD. As a result, the data is tripled in latter experiments. In addition, accuracy in both two methods firstly increased, and then dropped. It is a trade-off problem. Like discussion in Ref. [20], too little data cannot reasonably characterize the data space, while too much data may lead to high similarity among data samples, resulting in over-fitting.
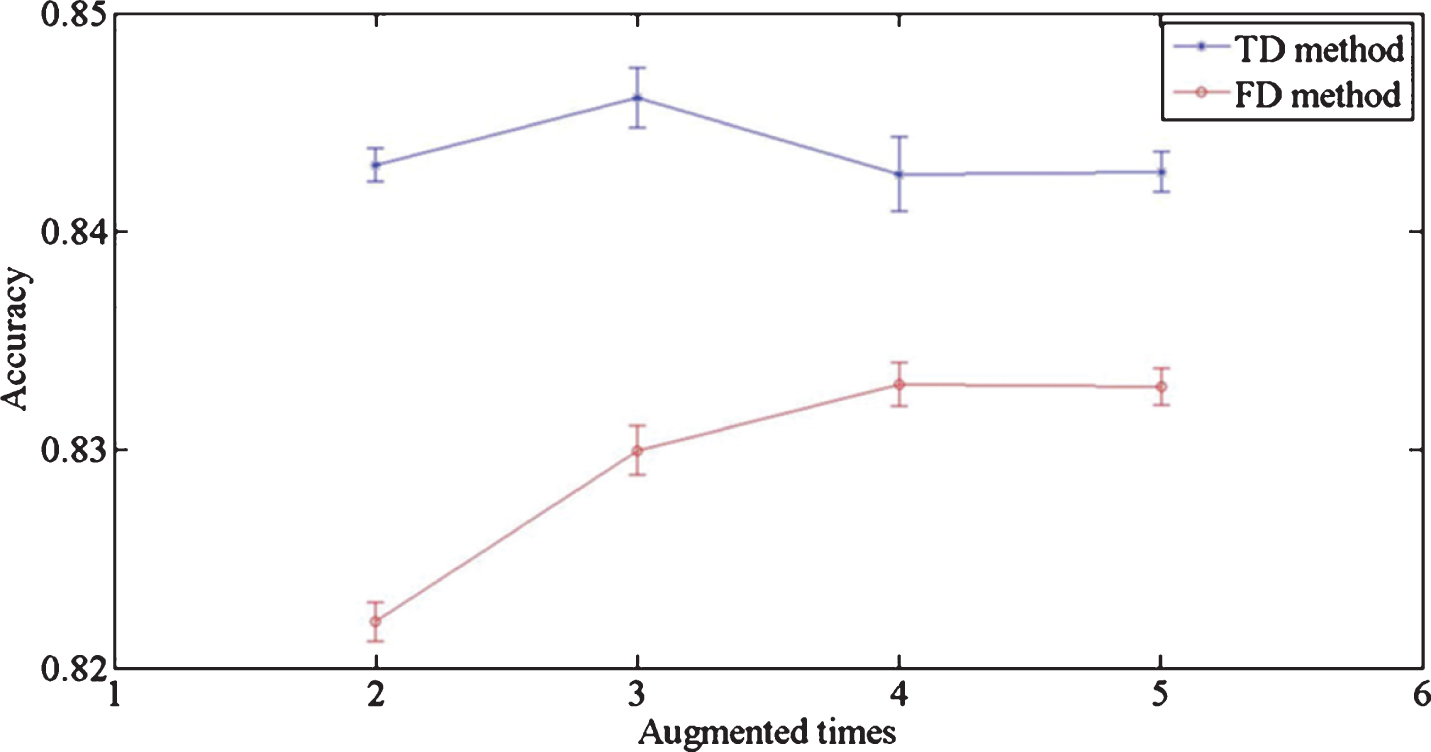
Accuracy comparison between different augmentations.
The results of all subjects obtained in TD and FD methods are shown in the Fig. 5. The black bar demonstrates accuracy in TD method and the yellow represents FD method. It is seen that there exists some complementary information between these two methods, which means in some subjects, the TD method has a higher accuracy, while in others the FD method prevails.
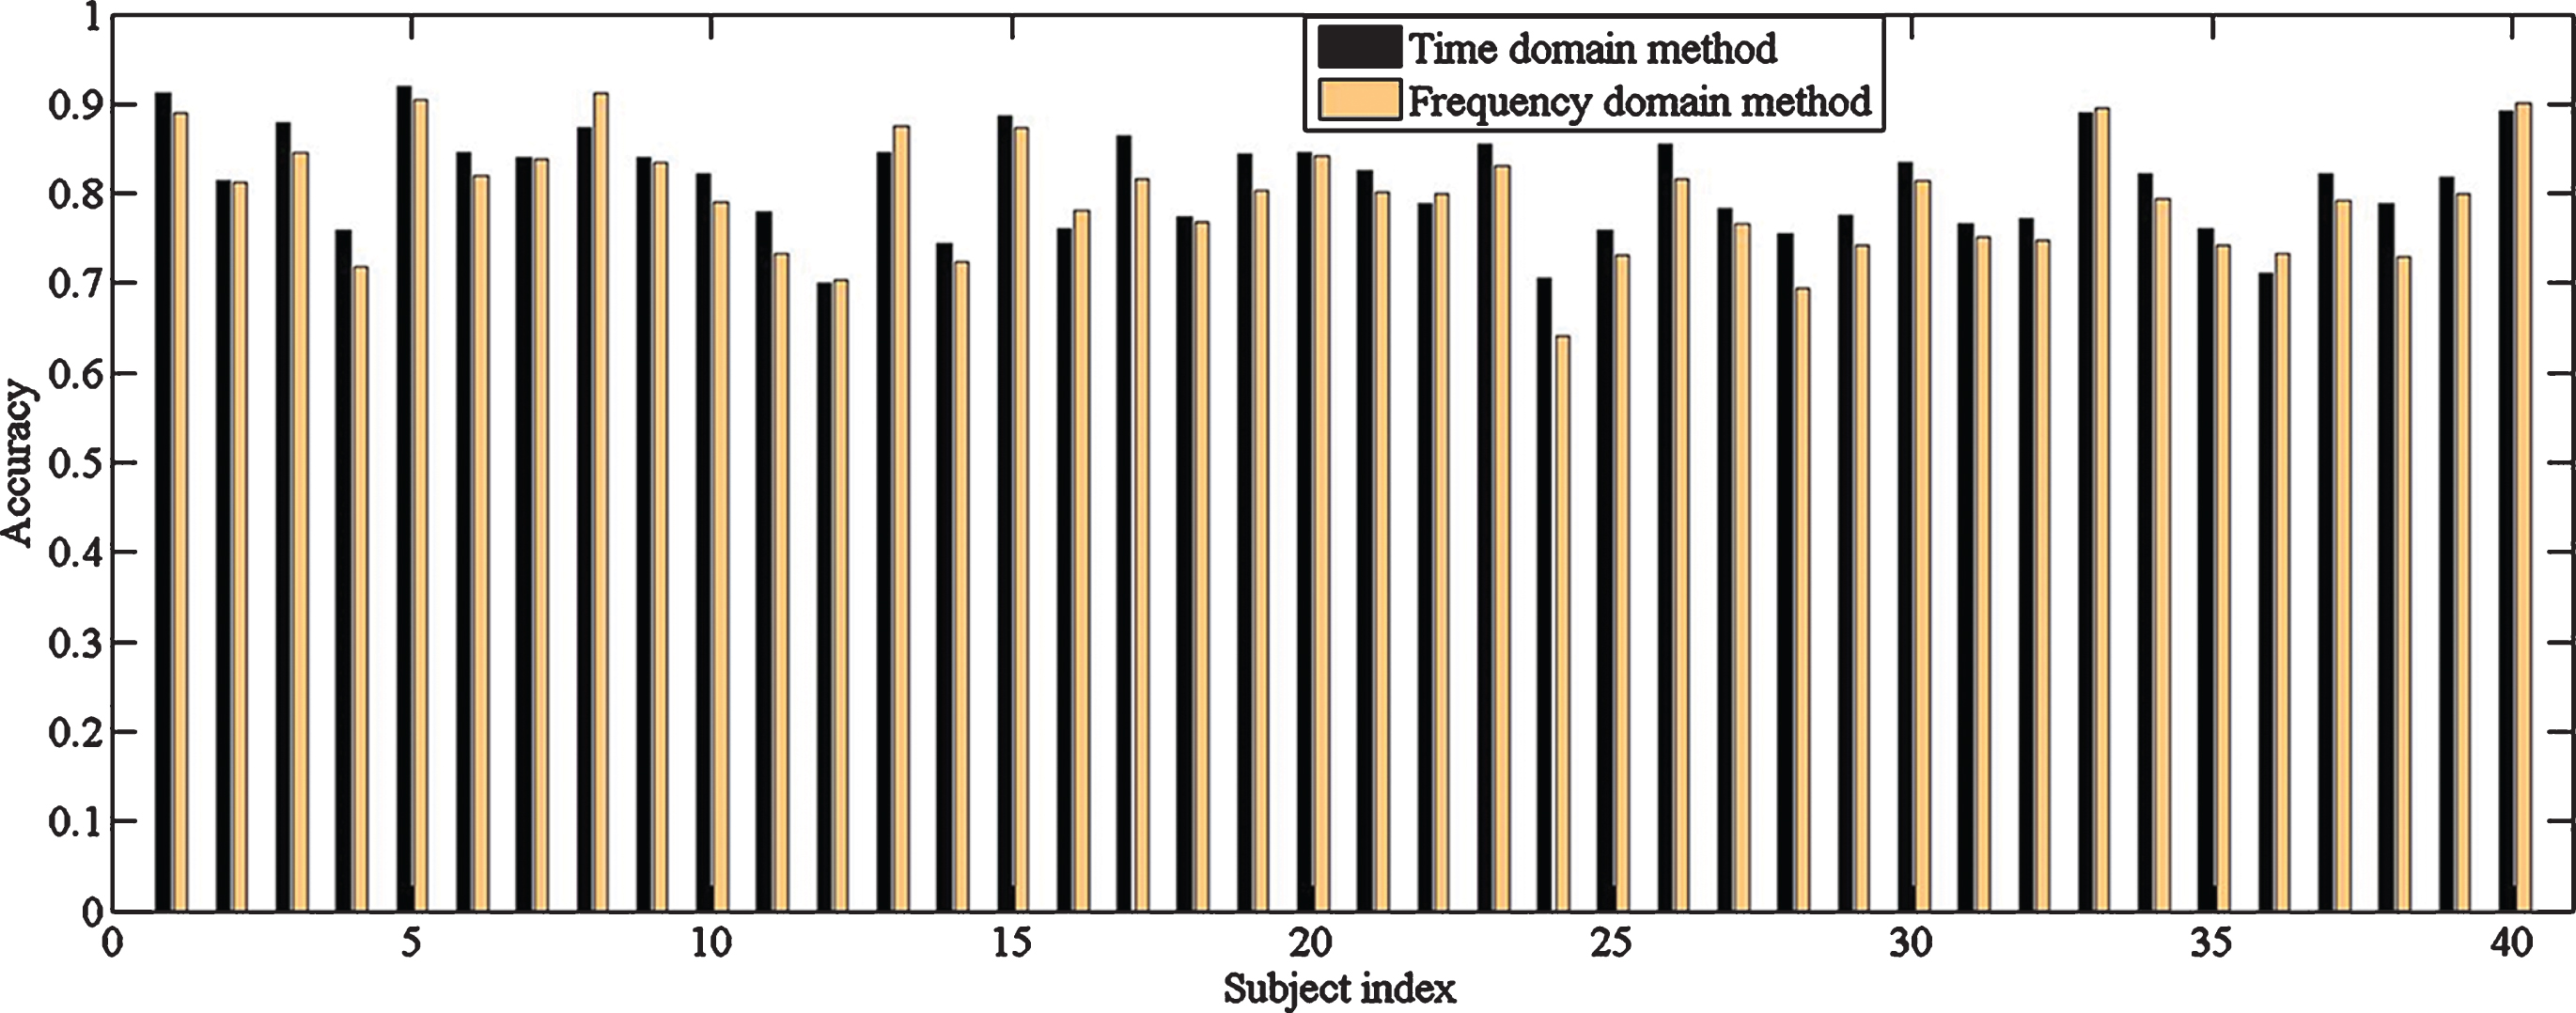
Accuracy comparison between methods and subjects.
From the discussed TD and FD methods, it is seen that they either obtain effective information via low-pass filters, or get frequency features with STFT. However, both methods lost information in sEMG signals. This produces a thinking whether they can be combined in a proper way to make performance gains.
First of all, to validate the complementarity of the two methods, a representative subject, subject1 is selected to calculate confusion matrix in both methods (both methods make high accuracy). As seen in Fig. 6, the X-axis represents the true labels index of gestures, and Y-axis represents the predicted labels index. For facilitating comparison, the difference of the confusion matrix (DCM) is made as follows (see Fig. 7).
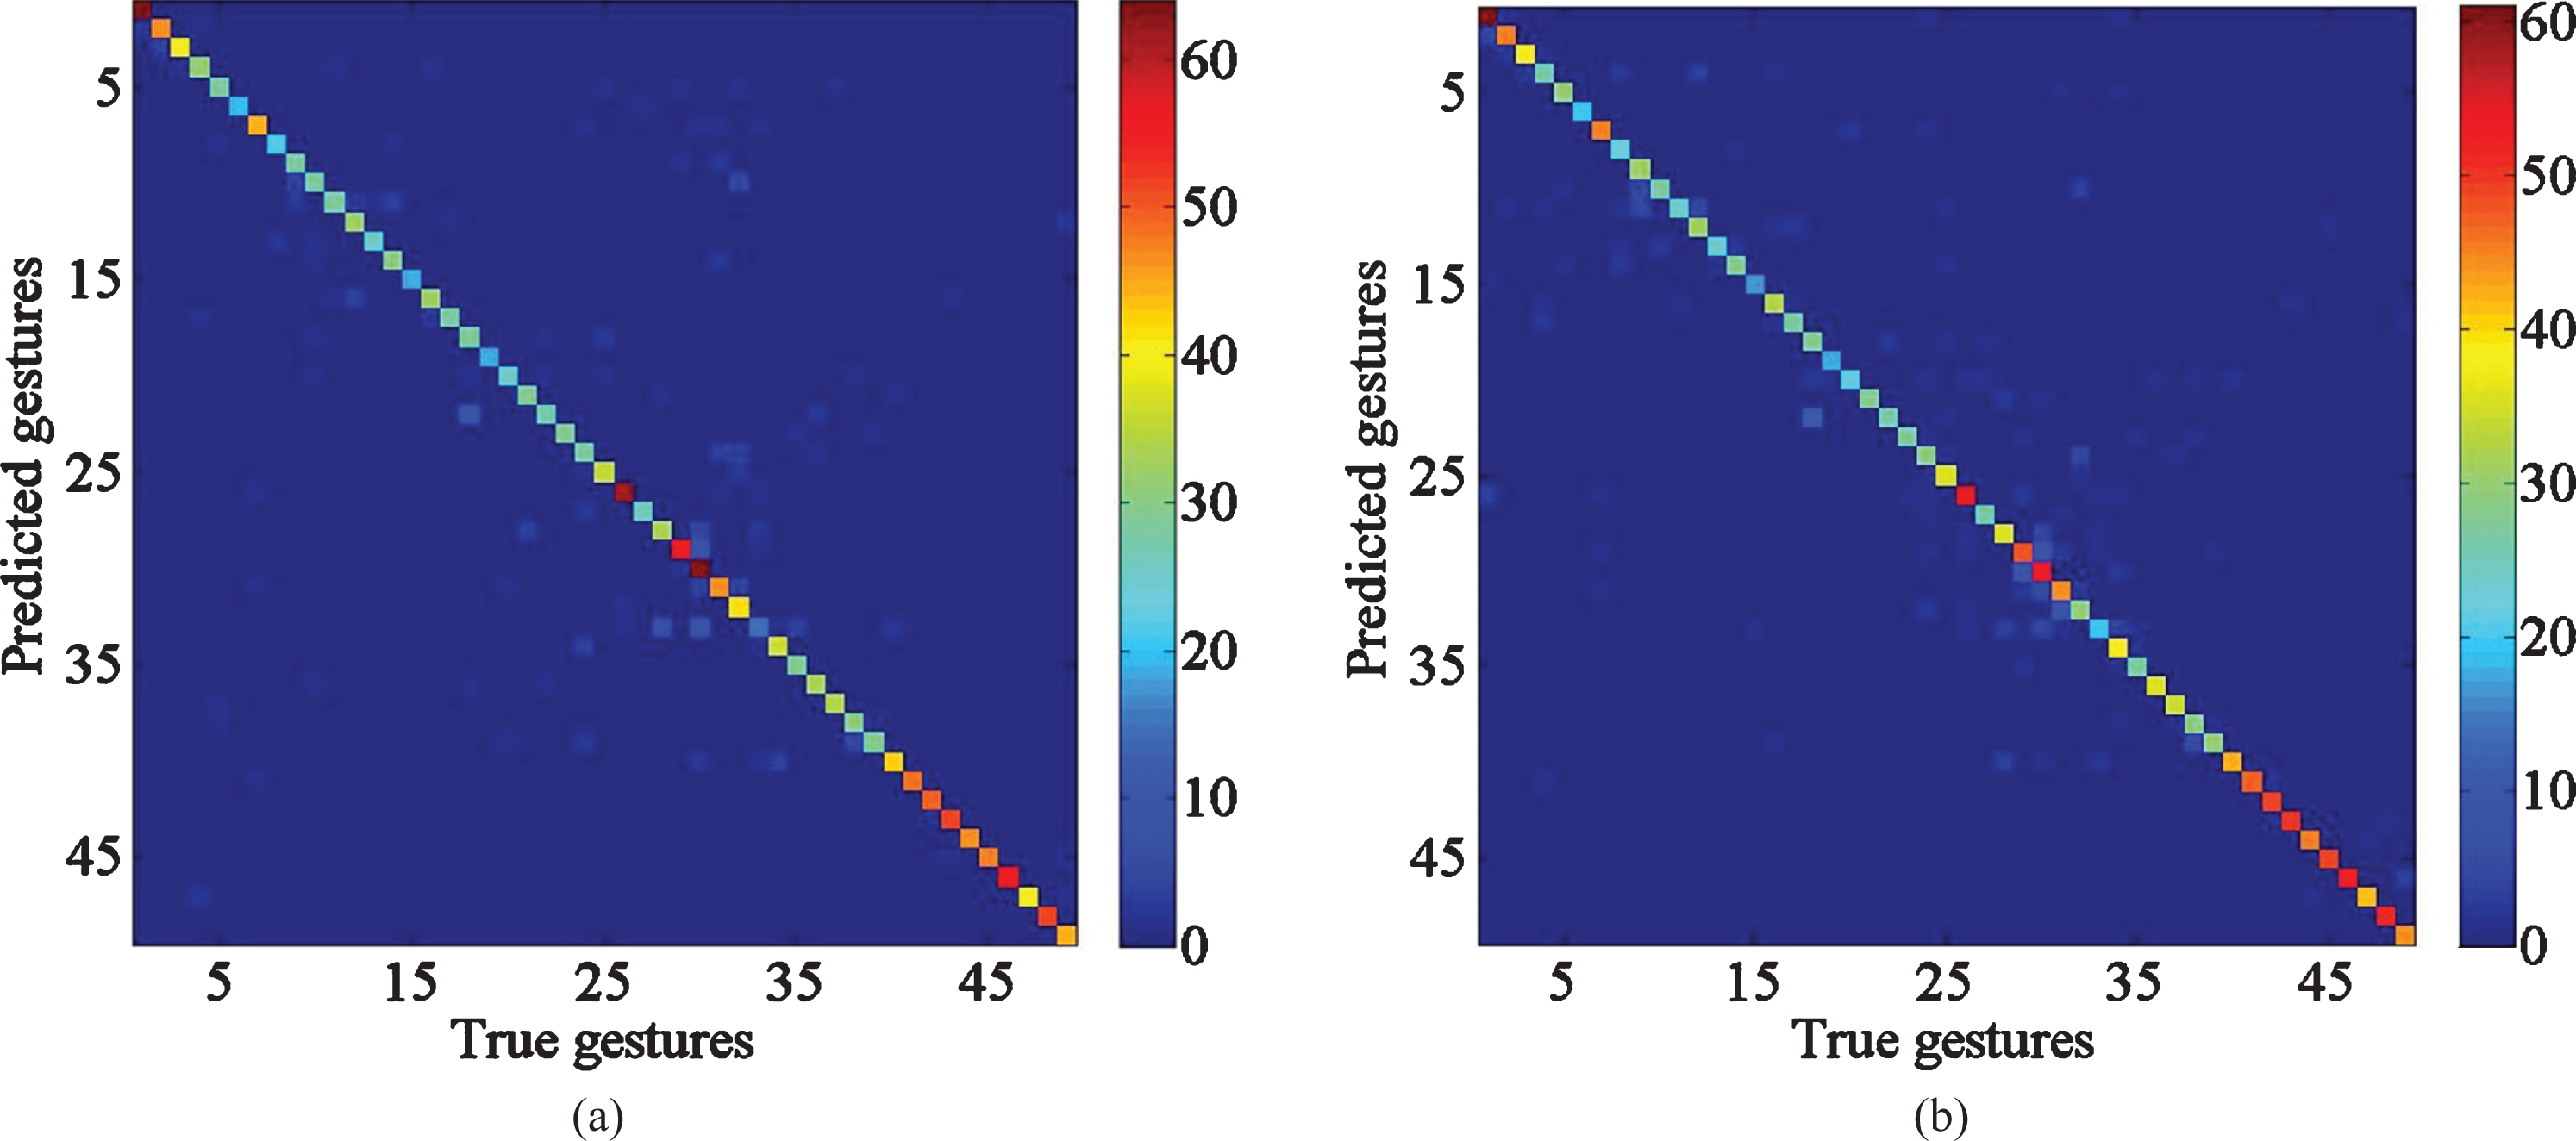
Confusion matrix of subject1 (a) TD confusion matrix (b) FD confusion matrix.
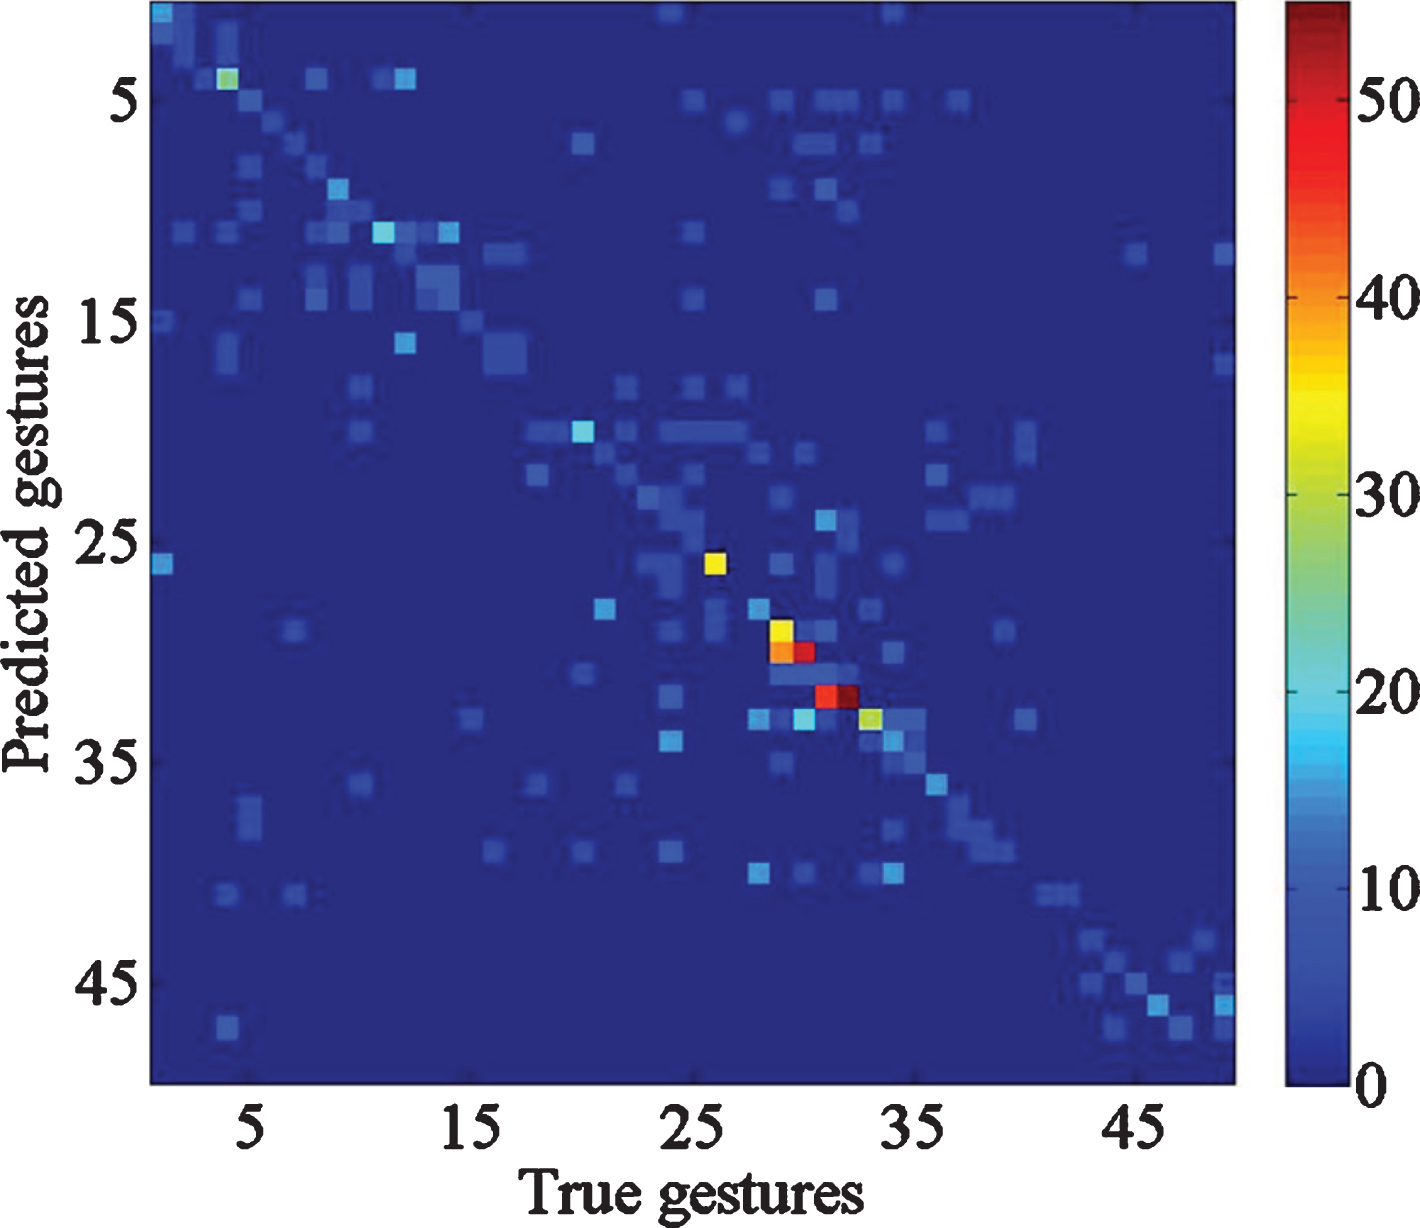
Accuracy comparison between methods and subjects.
The confusion matrices demonstrate the mode classifier works. For example, the number of TD C M (i, j) means that for the dataset in TD, how many data samples are classified as index i, while the true gestures label index should be j. It is obvious that the larger sum of diagonal values (where predicted labels index is equal to true labels index), the more accurate of the classifier. Then, the difference of confusion matrix proves that for a specific subject, the two methods have different judgment norms, which means there exists complement to some extent.
Inspired by Refs. [29, 30], two methods are conducted to fuse TD and FD information. The average fusion algorithm takes softmax scores in TD and FD methods as input, and averages them as the final predict score (see Equation (16)). It is always used as a baseline of the fusion method.
Suppose the final output score is donated as:
The loss function for back propagation is:

Analytical procedure of fusion methods.
Table 5 compares the results with the state-of-the-art researches, which also explore the matches of data preprocessing and classifier structure. In TD and FD, our methods achieve the best results, demonstrating rationality of data preprocessing and model building. As opposed to using TD or FD information alone, the fusion method achieves a higher accuracy, proving the proposed method can integrate information efficiently. Specifically, the trained models were tested on a workstation with one NVIDIA 1080Ti GPU and one Intel W-2123 CPU.
Comparison of recognition accuracy (%)
Table 6 shows the runtime of different trained models. Because the feature fusion method has less parameter than average fusion method, the runtime performs better. It is seen that the maximum runtime is 21.41 ms, which means the proposed methods are acceptable for practical application, such as myoelectric prostheses control and rehabilitation.
Runtime of methods (ms)
Considering the practical application of rehabilitation, Zhai et al. [28] adopted 10 common gestures as a subset in DB3 dataset to verify the effectiveness of the algorithm, namely abduction of all fingers, wrist supination, wrist pronation, wrist flexion, wrist extension, small diameter grasp, index finger extension grasp, tip pinch grasp, quadpod grasp and lateral grasp. Similarly, the feature fusion method is adopted on these ten gestures. The accuracy of 76.74% verifies availability of the feature fusion method, which is 2.41% higher than FD method and 4.87% than TD method. While, it is lower than the accuracy of all gestures classification in DB2, following the same conclusion of Zhai’s work.
In this paper, two methods based on TD and FD information are proposed for gestures classification. The results shown in Fig. 5 indicate that different methods have advantages on different subjects. The main reason is thought that the absolute position of the acquisition device on arm will be deviated among subjects. Besides, strength and diameter of arm might differ from subjects even though they are asked to maintain a same gesture during the acquisition process. All the factors will influence the signal fluctuation intensity. In addition, the duration of each gesture is also slightly different among subjects according to the relabeled data (for example, some gestures have only 1935 sets of data, while others have 2400 sets of data). This makes the signals of some subjects are more sensitive to TD information, while others are more sensitive to FD information.
In terms of fusion methods, it can be seen that both fusion methods demonstrate better performance than TD and FD method. This is because the complement between the two domains. Furthermore, the best effect is achieved by fusing features in feature layers, which is about 0.8% increment compared with the average fusion method. It is the reason that feature fusion leads to a more reasonable feature combination. The learned features can be selected according to the sensitivity to different subjects.
Besides, from Table 5, it is notable that CNN methods are superior to traditional methods. This verifies the assumption that the feature learning method is more adoptable compared with feature projection, which generates a proper feature set for classification. Specifically, feature learning method learns features according to the characteristics of subjects, showing the robustness of proposed method.
As for 10-classes gestures subset in DB3, the accuracy is lower than the all gestures classification in DB2. It’s probably because signals are more unstable on account of physiologically nerve injury. Notably, this might be a meaningful technology to judge degree of injury in the future.
Conclusions and future work
In this paper, the suitable match for data preprocessing and CNN structures is explored in TD and FD respectively. During the progress, data augmentation is also discussed for better performance. Experiments show that proposed preprocessing methods can effectively complement each other. In addition, two fusion methods are conducted to connect the information and make a better performance. Besides, experiments carried out on the DB3 dataset show great significance for neural decoding with nerve injury subjects. In the future, transition between rest gesture and other gestures will be studied for a better recognition result.
Footnotes
Acknowledgment
This work was supported by the JiangSu Provincial Key Research and Development Program of China (Grant No. BE2016757) and The Open Funding Project of National Key Laboratory of Human Factors Engineering (Grant No. 6142222190310).