
Abstract
Accurate and efficient recognition of Parkinson’s disease is one of the prominent issues in the field of healthcare. To address this problem, different methods have been proposed in the literature. However, existing methods are lacking in accurately recognizing the Parkinson’s disease and suffer from efficiency problems. To overcome these problems faced by existing models, this paper presents a machine-learning-based model for Parkinson’s disease recognition. Specifically, a hybrid feature selection algorithm has been designed by integrating the Relief and ant-colony optimization algorithms to select relevant features for training the model. Moreover, the support vector machine has been trained and tested on the selected features to achieve optimal classification accuracy. Additionally, the K-fold cross-validation technique has been employed for the optimal hyper-parameters value evaluation of the model.The experimental results on a real-world dataset, i.e., Parkinson’s disease dataset is revealed that the proposed system outperforms baseline competitors by accurately recognizing the Parkinson’s disease and achieving 99.50% accuracy on the selected features. Due to high performance is achieved our proposed method, we are highly recommended for the recognition of PD.
Keywords
Introduction
Parkinson’s disease (PD) is a dangerous sickness after Alzheimer ’s disease in the world, and many people around the world have been suffered from it [62]. The PD is a progressive and long-term degenerative disorder of central nervous system, which badly affects old people. The major symptom of the PD is movement impairment, such as tremor, slowed movement, rigid muscles, impaired posture and balance, loss of automatic movements, speech changes and writing changes [56]. The cells suffering from PD do not have a consistent flow of dopamine with motor system. The disorder in vocal is the initial symptoms of the PD patient [18]. Such patients have an issue in speaking, such as abnormality in volume level and pronunciation [57]. These vocal issues of disorders can be assessed for early PD diagnosis. The Diagnosing and managing PD by speech signals is more accurate as well as effective way. The outcomes data are often used to diagnose PD through the voice recording methodology by a neurologist to assist the patients and reached conclusive remarks. The new diagnostic criteria for Parkinson’s disease have been published, and constitute the first Parkinson’s disease diagnostic criteria of the Movement Disorder Society. Their goal was to support standardized clinical research [56]. Recognition of Parkinson’s disease is typically conducted by some techniques such as empirical assessment and examinations of patient’s medical records [12]. The methods, such as the invasive method to detect the PD, is not reliable in terms of accuracy and efficacy. Institute of Medicine reported that existing diagnosis systems are not correctly identified the Parkinson’s diseases yet [2]. To overcome these limitations we need a reliable method which can be used for recognition and provide help to prevent PD. In this connection, the role of machine learning methods is vital in the recognition, prevention, and treatment of the PD [4]. In literature [15, 70], different machine learning-based methods have been developed to diagnosis patients of PD. Little et al. [42] proposed a method to identify Parkinson’s disease using voice signals data. They identified 23 PD patients and eight healthy subjects. SVM was used for classification of Parkinson’s disease, and healthy people. The proposed method was recorded accuracy 91.4%. In another study [70], 132 features were selected based on the signals of speech by dysphonia. Algorithms of feature selection (FS) such as the LASSO, Relief, MRMR, and LLBFS were utilized [70]. Additionally, the model selected 10 features out of 132 using feature selection algorithms, and these features were used for the classification of Parkinson’s disease and healthy people. In contrast, Sakar et al. [57] collected multiple recordings of voice from 40 subjects, in which Parkinson’s disease subjects are 20, and Non-Parkinson’s subjects are 20. Recording of 26 speech signals containing daily life pronunciation, words, numbers, and vowels was collected for each subject. They used Praat acoustic analysis software for the speech recording [30]. Additionally, leave one subject out (LOSO) and S-LOO techniques of validation were used to check the performance of K-NN and SVM classifiers [31]. The research work [7] proposed a method based on ML algorithms using speech signals for diagnosing Parkinson’s disease. The algorithms for the features selection, such as relief, LLBS, LASSO, and mRMR, were deployed, and the proposed method achieved high performance in terms of accuracy. Sakar et al. [58] developed a diagnostic system using SVM and achieved 92.75% accuracy. Similarly, Der et al. [40] proposed a model for diagnosis of PD by utilizing fuzzy-based non-linear transformation techniques integrated with SVM and achieved 93.47% accuracy. Andre et al. [63] proposed a diagnostic system for PD detection by using evolutionary-based methods and optimal path forest classifiers. The system achieved 84.01% accuracy. Chai et al. [6] designed a new intellectual architecture to detect PD. SVM and relief algorithms were integrated with a bacterial-foraging-optimization algorithm and obtained significant accuracy. Emary et al. [19] developed a technique using fuzzy logic, K-NN, PCA for diagnosing the PD and achieved 96.07% accuracy. Duffy [18] designed the diagnosis method for the detection of PD using PSO and enhanced FKNN and obtained 97.47% accuracy. To this end, Gok [23] proposed the PD diagnostic system by employing the Rotation Forest Ensemble (RFE) KNN classifier results 98.46% accuracy. In this direction, Das [15]compared the classification performance of ANN, logistic regression (LR), and (Decision Tree)DT. The classification performance of ANN in terms of accuracy was excellent as compared to other LR, DT and obtained 92.9% accuracy. In [51] proposed a PD diagnosis system using the mRMR feature selection algorithm along with a complex valued ANN classifier. The proposed system has been obtained 98.12% accuracy.
In light of the explored literature, we concluded that for the successful diagnosis of PD, a highly intelligent diagnosis system is mandatory. In designing of PD diagnosis system, current studies [10, 62] have been used different classification algorithms such as logistic regression [74], supports vector machine [13], k-NN [74], DT [73], NB [53], and ANN [74] for detection of PD. Among these classifiers, the support vector machine performance was excellent as compared to other classifiers. The classification performance of a classifier is improved by choosing an appropriate feature selection method because sometimes, irrelevant features affect the classification performance as well as the computational complexity of the model. The well-known feature selection and parameters optimization algorithms including: relief [71], mRMR [52], LASSO [68], LLBFS [64], Genetic-Algorithm (GA) [33], Particle-Swarm-Optimization [41], Whale-Optimization-Algorithm (WO) [67], fruit fly optimization (FFO) [60], differential flower pollination [29], and bacterial foraging optimization (BFO) [6] have been used for feature selection in existing works to select a list of features. However, these methods are limited in terms of choosing the list of appropriate features and therefore suffer from inadequate PD detection and efficiency problems. n the literature, the proposed PD diagnosis techniques, limitation and advantages have been summarized in the Table 1 for the better understanding as well as the importance of our proposed method.
Summary of the previous methods
Summary of the previous methods
To overcome the aforementioned problems, this paper proposes an integrated novel method based on relief and ant-colony-optimization (ACO) to select a list of appropriate features. Relief algorithm has been used to compute weights of features and rank them accordingly. Then, the model uses ACO to select the list of best features. The integration of both algorithms gives excellent performance as compared to the individual performance of relief and ACO. Then, we train and test the SVM classifier employing the selected features to predict the PD patients. The contributions of this paper are given as follows: Firstly, a hybrid method based on Relief and ACO has been proposed for the selection of appropriate features. That is the Relief algorithm which assigns appropriate weight to each feature in the features set, and based on that weight, the features are ranked, and finally, relevance is determined. Then, the ACO algorithm optimizes the feature weight and chooses the best relevant features for accurate classification. Secondly, the performance of the SVM has been evaluated using the selected features. The results reveal that SVM has produced significant results on the ACO-based features compared to the original feature set. Additionally, the performance of the SVM with Relief-ACO outperforms the relief and ACO algorithms. We performed extensive experiment on real-world datasets which demonstrate that the proposed diagnosis method (Relief-ACO-SVM) is achieved significant results in terms of high accuracy, low computation cost compared to its counterparts.
The rest of the paper is organized into four sections. Section 2 briefly discusses dataset, Relief, ACO, SVM, cross-validation method, performance evaluation metrics, and the proposed architecture. Section 3 presents the experimental results and discussion. Section 4 concludes our paper and presents future research directions.
Before providing the technical details and basic concepts used in the proposed model, some common symbols, notations are used in this paper that is briefly presented in the Table 2.
Mathematical symbols and notations used in the paper
Mathematical symbols and notations used in the paper
In this research work, we used the dataset which is obtained from the machine learning repository and and available online [43]. The dataset has been used in different research works [6, 49] for the detection of Parkinson’s diseases.This data set is Multivariate neurologists’ assessment outcomes dataset. The data set have 23 attributes and 195 voice samples. The original study published that the feature extraction methods for general voice disorders. The voice recordings of 31 people, including 23 people with Parkinson’s disease (16 males and 7 females) and 8 health controls (3 males and 5 females) were used in the study. In the dataset table each column for particular voice and each row are related to one of 195 voice recording from these individual subjects. Additionally, the people ranged from 46 to 85 years of age with mean age of 65.8 and standard division 9.8. The main aim of this dataset was to discriminate people with Parkinson’s disease from healthy people by finding differences in their vowel vocalization according to “status” column which is set to 0 for health and 1 for PD. For each subject an average of 6 phonation of a vowel was recorded for 36 second and total 195 samples were recorded. The phonations were recorded in an industrial acoustic company (ICA) sound-treated booth using microphone which at distance 8 cm from mouth and microphone was calibrated. The voice signals were recorded in computer using computerized speech laboratory.
Classification using support vector machine
SVM is used for binary and multi-classification related problems [6, 59]. SVM is a supervised classification algorithm which has been adopted for binary and mutli-classification problems [9]. In a binary classification problem, the instances are distinguished with a hyperplane w
T
x + b = 0, Where w is a d-dimensional coefficient vector which is normal to the hyper-plane, the bias term b, is the offset values from the origin, and x are represents data points. The main job of SVM is to get the results of w and b. In linear case, w can be solved using Lagrangian function. On the maximum border, the data points are called support vectors. As an outcome, the solution of w can be expressed mathematically as in Equation (1).
Here, two parameters need to be defined in the SVM model namely C and γ.
Suppose we consider a feature set to be represented as x having n carnality. The selection of features is a problem of discrete optimization of choosing m, out of n feature set, that m ≤ n [45]. The performance and execution time of classifier affected by non-relevant features. Thus, eliminate irrelevant features from features set are critically necessary. The conventional feature selection techniques are filtered feature and wrapper features selection. In wrapper, the search algorithm is applied to the features set and calculated each subset of the features. Filter techniques are the same as wrappers techniques in the search process. In filter method use filter metrics such as class rep-arability, inner class space, error probability, probabilities distance, consistency and, entropy [46].
Pre-processing and relief algorithm
Pre-processing is used for the representation of useful data so that the classifier can use it conveniently. Thus, Pre-processing is required for proper training and testing of the model. The methods of pre-processing such as deletion of missing values of feature instances, Standard Scalar, Min-Max Scalar. The standard scalar method is used features coefficient values standardization, and similarly mean value 0 and variance 1 for each variable, respectively. Min-max scalar arranged the data in such a way that all features have been assigned values between 0 and 1 [38]. Mathematical form of min-max normalization and z-score normalization are expressed in Equation. (5) and (6) respectively as:
Where V and V- are old and new features values, respectively. Relief(R) [71], algorithm assigns weights to the features, hence these weights are modified with time. Relief algorithm iterate through m numbers of training samples, and each iteration randomly selects the target samples Rk and then score feature vector w is updated [61]. The update rule of the relief method for hits of the nearest list is given as follows:
The nearest misses instances are computed as follows in Equation (8):
Where,
The aim of Ant Colony Optimization was to address the hard combinatorial-optimization problems [34]. It tackles a hard problem solution in the right way and foraging the function of real-life ants [34]. In [16], the algorithm ant colony optimization was designed in the ant system, and modifications in the ant system have been done [20, 21]. The ACO followed the model of computation rules of real ant colonies. The rules of each agent are thus influenced by the rules of real ants [47]. The technique is inspired by the algorithms of the ACO family [47]. ACO algorithm is mostly used for optimization problems, and its dependent property can be defined as follows [1, 17].
Generally, an ACO algorithm can be employed for addressing all those combinatorial problems that are possible to define: Appropriate problem representation. The representation of the problem should be in the form of a graph consists vertices and links between vertices. Heuristic desirability η of edges. There should be an appropriate heuristic measure of "goodness" of paths concerning the nodes linked with each other. Construction of feasible solutions. A technique should be established where a possible solution can be efficiently defined. It is required to update the pheromone levels on edges employing the relevant evaporation rule. A typical solution is to select the n best ants and update their chosen paths accordingly. Probabilistic transition rule. It defines the probability to traverse an ant going from one vertex to another in the graph.
Ant colony optimization for the selection of features
One of the prominent problem is the selection of adequate features set. Suppose, the original features set is represented by n. In order to create a feature subset s, where s < n, then it must maintain the accuracy same as the original features set n so, there is exist no such idea of path.
It is critical to notice that, a partial solution would be define ordering among the constituents concerning the solution. Therefore, it is not sure that the next component to choose would be influenced if we incorporate a last component in the partial solution [3, 39]. Furthermore, solutions to the feature selection problems are not necessarily to have the same size. Keeping the aforementioned issues in mind, we need to tackle these problems before going to apply the ACO algorithm for solving the feature selection problem. In this connection, we address the first problem by redefining graph representation as follows.
Ant graph representation
Tn this section, the problem of DF is formulated into an ACO problem. That is described using a graph, where features are represented by nodes, while links (i.e., edges) between the nodes denote choice of the corresponding feature. For the optimal subset of features search, the graph is visited, the small number of nodes are traversed that fulfill the condition of traversal stops. Figure 1 demonstrated this setup.
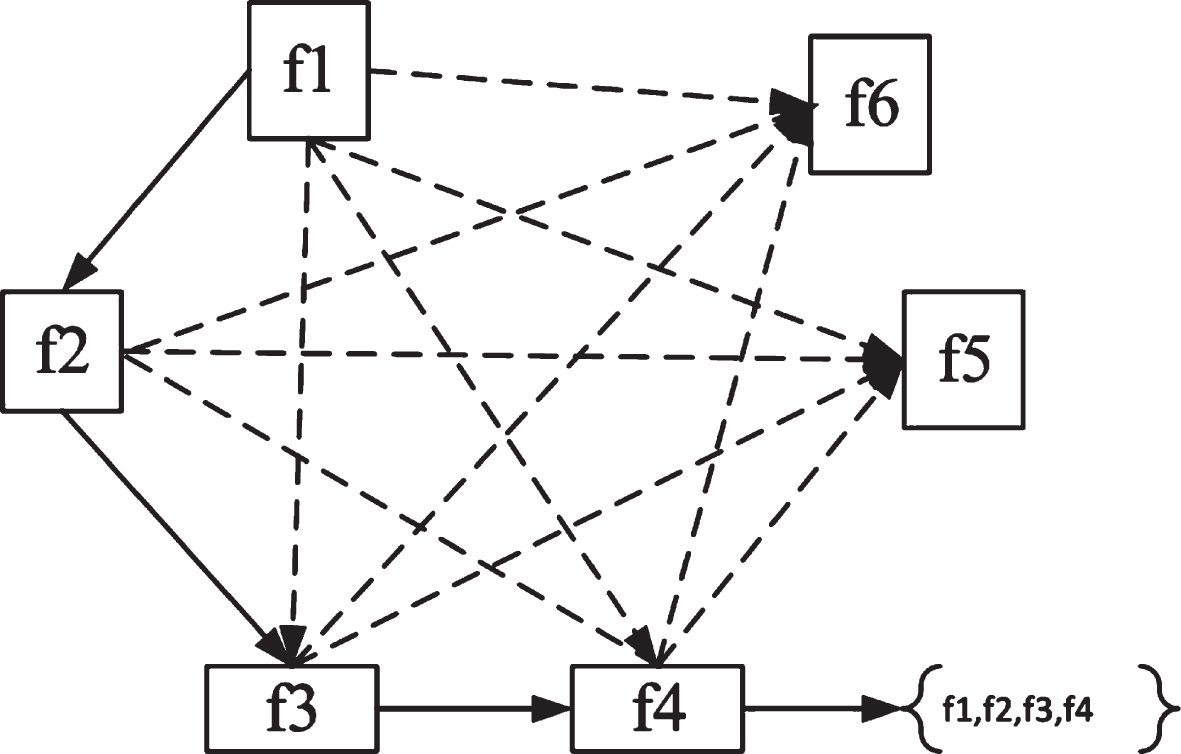
Ant Colony Optimization based problem representation of features selection.
The nodes in the graph are fully connected, which allow features to be chosen next. If the ant is at vertex f1 then it can choose feature f2 by employing the transition rule. In this way, it chooses other features (i.e., f3 and f4)using the transition rule as depicted in the figure. It is clear that when it arrives at f4, then the current subset f1,f2, f3, f4 is decided in order to meet the traversal stopping criterion. The ant then finishes the traversal process and generates the selected feature subset for data reduction purposes[36]. Using this reformulation, we can apply the transition as well as pheromone update rules of standard ACO algorithms. This way, all features possess unique pheromone and heuristic values and these values are no more linked with edges.
The appropriate Heuristic Desirability to traverse between features could be any subset measures functions namely entropy-based evaluation [35], Fisher discrimination rate [22] and Rough-set dependency measure [50]. Traversal of heuristic desirability and node pheromone levels are integrated to design, thus named probabilistic transaction techniques, representing the probability of ant k will include featuring i in its solution travel to feature j in time step t. As expressed in Equation (10).
Nevertheless, to identify such actions, the search needs to analyze the unobserved actions by exploiting the search space. To balance the exploration-exploitation trade-off, the best solution is to choose an appropriate set of parameters i.e., α, and β. If α = 0, it shows that no pheromone information is exploited, and hence past search experience has been ignored. Therefore, the search becomes a stochastic greedy search. If β = 0, it reveals that the potential benefit of moves is ignored.
After the completion of ant’s solutions on every node evaporation, pheromone is triggered as depicted in Equation (11): ant k deposits some amount of pheromone,
Here, S k (t) is a subset of features that compute by ant k at t iteration and |S k (t) | is the length of subset. This way,pheromone is updated concording the performance of classifier i.e., (S k (t)) and feature subset length. Where φ and θ, denotes the parameters used for tuning the relative weight between feature subset length and classifier performance, φ = 1 - θ and θ ∈ [0, 1].
It is evident from the formula that both these parameters have different impact and significance in selecting the best features set. In this experiment, we assign more weight to the classifier performance compared to subset length. Therefore, we set their values as Φ = 0.8, and Θ = 0.2. To add a new pheromone, the following rules are adopted for all the vertices as given in Equation (12) and (13):
Node (i, j) if traversed Δτ ij (t) or 0. Value 0 ≤ ρ ≤ 1 is decaying constant applied to simulate the evaporation of the pheromone. S k is the subset of features found by ant k.
The ACO process generates n random ants, which are placed on the corresponding graph. That is, every ant gets start with a random feature, while the amount of ants that need to be placed on the graph may be equal to the total number of features available in the data. Additionally, the path construction of each ant is initiated based on different feature. Based on the initial setup, they adopt a probabilistic approach to traverse nodes and stop until they meed a stopping criteria. This way, the obtained subsets are evaluated for further processing. Finally, if the algorithm has come up with an optimal solution or its executed until the required results are achieved then it halts and outputs the results in the form of best subset features set. Otherwise, the pheromone is updated and the process is repeated for a new set of ants [32, 55].
Proposed integrated feature selection algorithm
The proposed algorithm is designed for optimal feature subset selection. The relief algorithm uses feature weight for proper feature selection. Initially, all features weights are initialized with zero value. In every iteration, the feature vector X is selected as a random instance, and feature vectors of the instance closest from each class. According to Equation (7) and (8) near-hit and near-miss list of features are generated, and weight vector w i is updated in each iteration. Hence, the weight of a feature gets increase if it matches that feature in nearby instances in the same class compared to nearby instance in other classes and vice versa.
The relief algorithm selects relevant and non-redundant features base on feature weight. However, the weight not enough only to select the list of an adequate feature list, because other control control information i.e parameters are also necessary, such as the number of features, number of instances in the dataset, and threshold weight using which certain corresponding features are either selected or rejected. Furthermore, the weight computation process of feature is time complex. In the Ant Colony Optimization algorithm, the construction of the graph and assign ant to each node in the graph adequately based on the ant weight because weight computation for node is complicated due to space. Therefore, both algorithms are integrated for suitable feature selection. Thus, in the proposed Relief-ACO method, the weights of all features are computed by relief algorithm incorporated in ACO for an optimal feature set selection. The ACO algorithm optimizes the weight of each feature, and other control parameters such as α, β, and γ are used for controlling the weight of features. The psucode of proposed algorithm is given in algorithm 1.
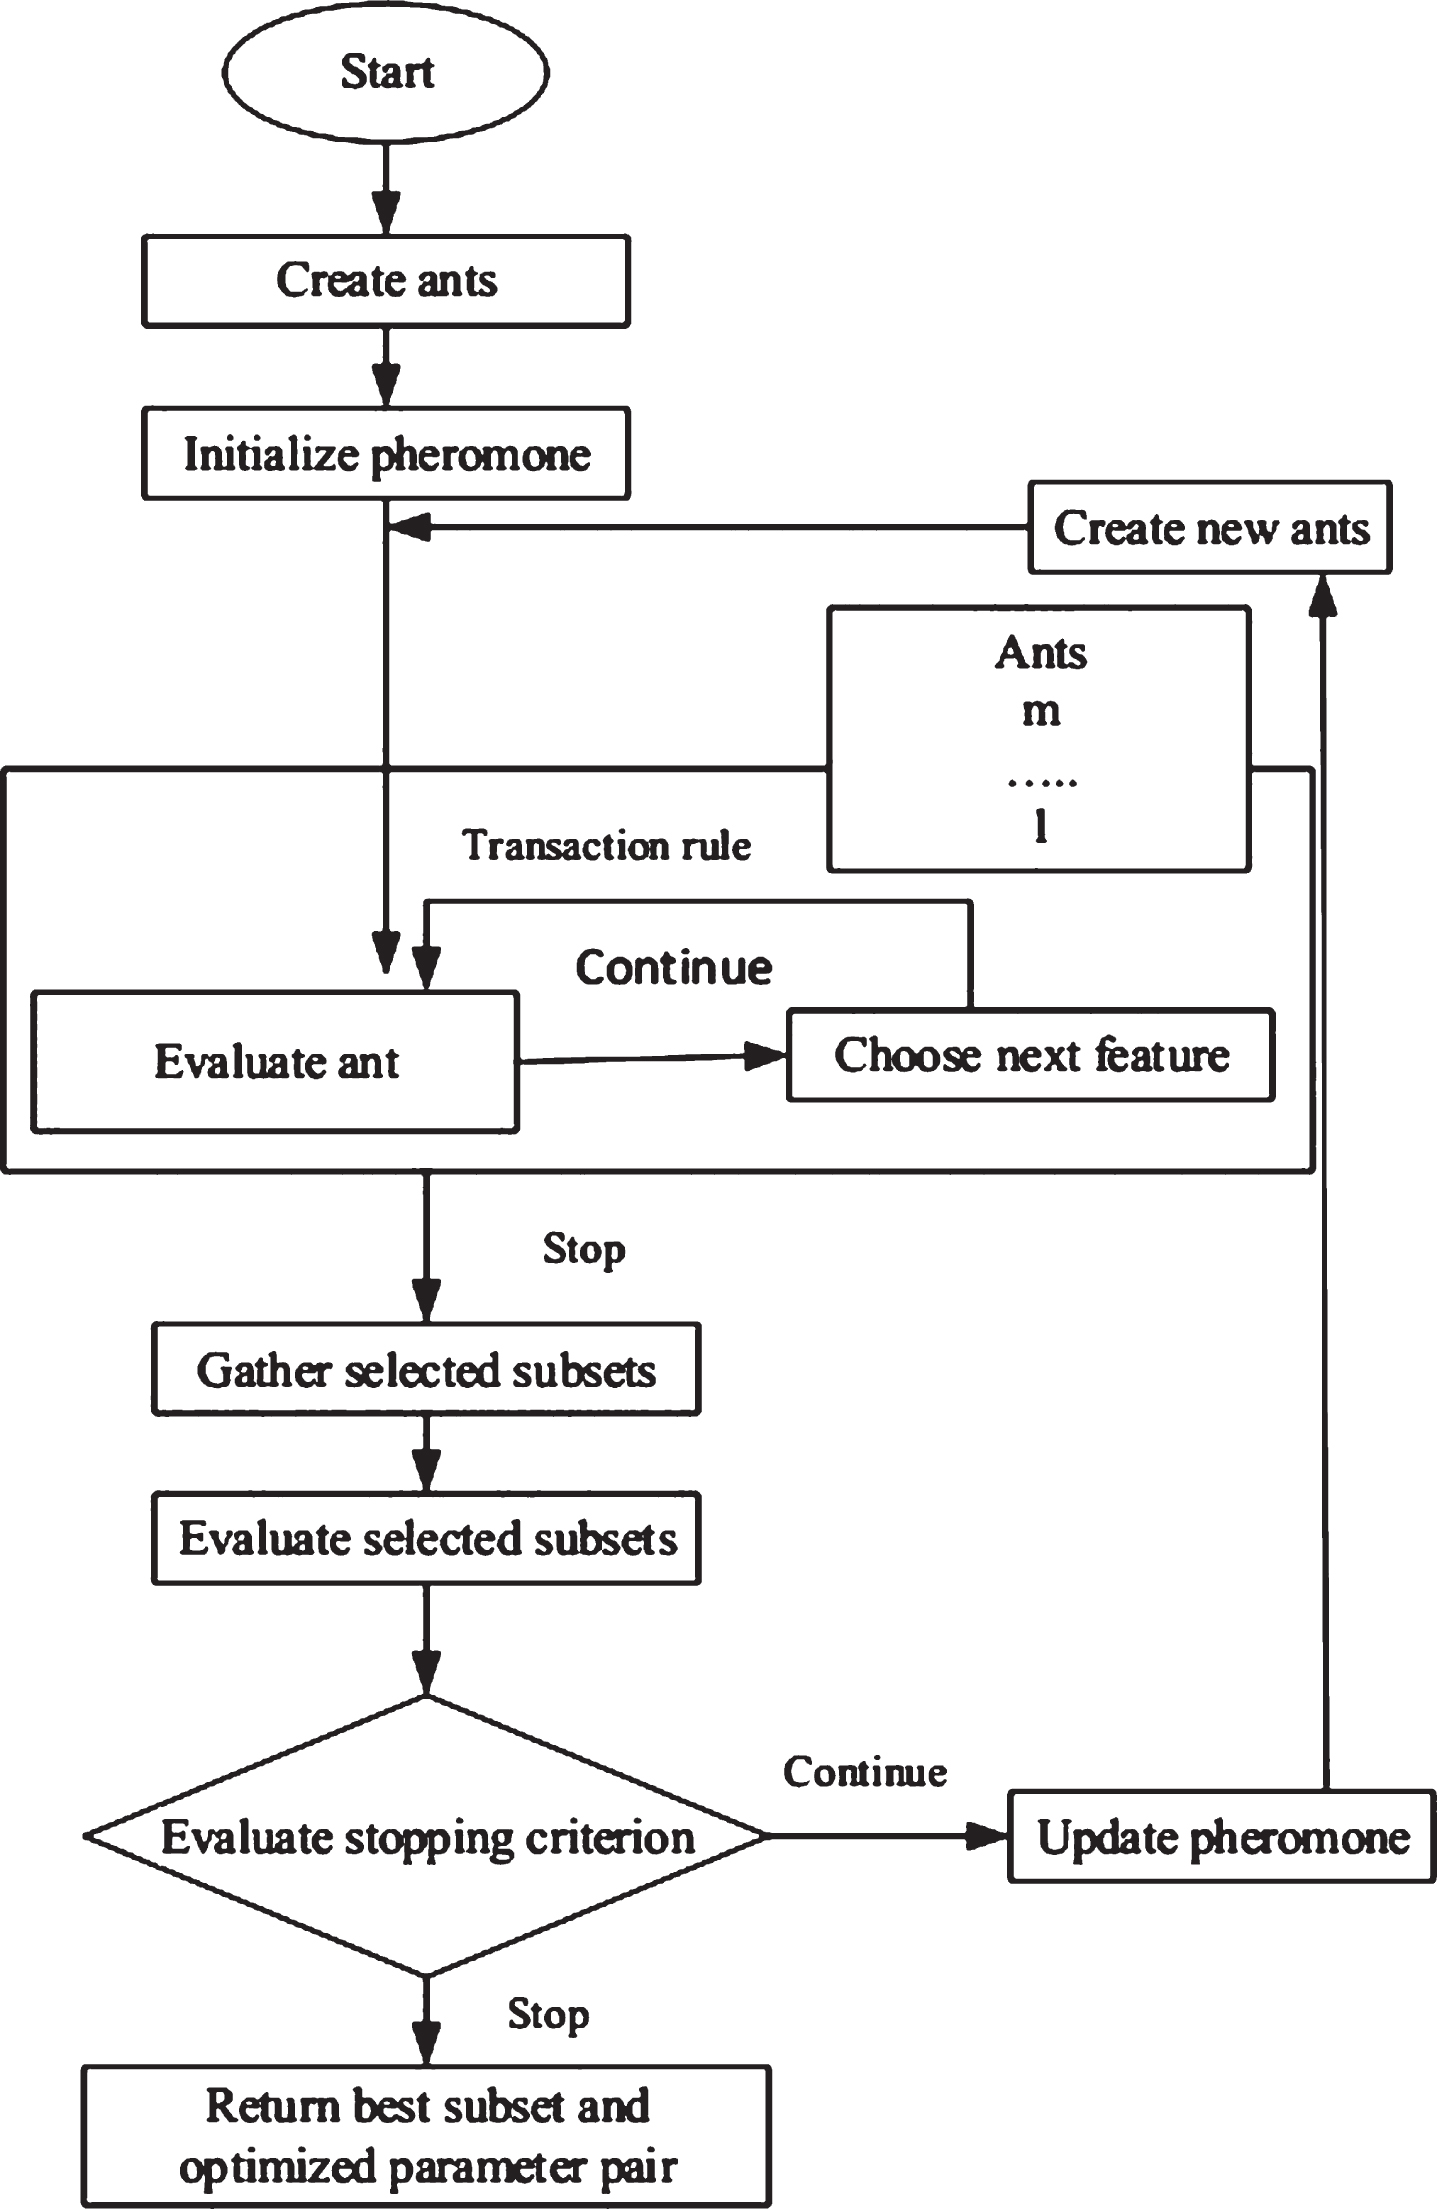
Ant Colony Optimization for selection of feature.
For best model selection, we have adopted Cross-validation K-fold method. That is, we split the data into K equal parts. In each iteration, we have been chooses K-1 and K-10 for both training and testing respectively. This way, the process is repeated K times until we get to the required results. Additionally, the model perform on average K computations to achieve the required performance of the model. To conduct our simulations, we have selected K=10. Furthermore, we have chosen 90% of the dataset for the training and 10% for testing the model. Finally, we computed the average value of 10 folds as adopted in [26]. The estimated performance E
i
concerning a fold is computed, average of all such folds is computed to measure the overall performance E of the model. To compute the average estimated performance, we employed the following Equation 16.
To evaluate the performance of our model, we have employed different evaluation methods namely: accuracy, sensitivity, specificity,and F1 score [14, 44]. These metrics are defined in Equation (17), (18), (19), (20) and (21) as follows:
The detailed working process of the proposed Relief-ACO-SVM is given in Fig. 3. The main steps and procedures are given as follows:
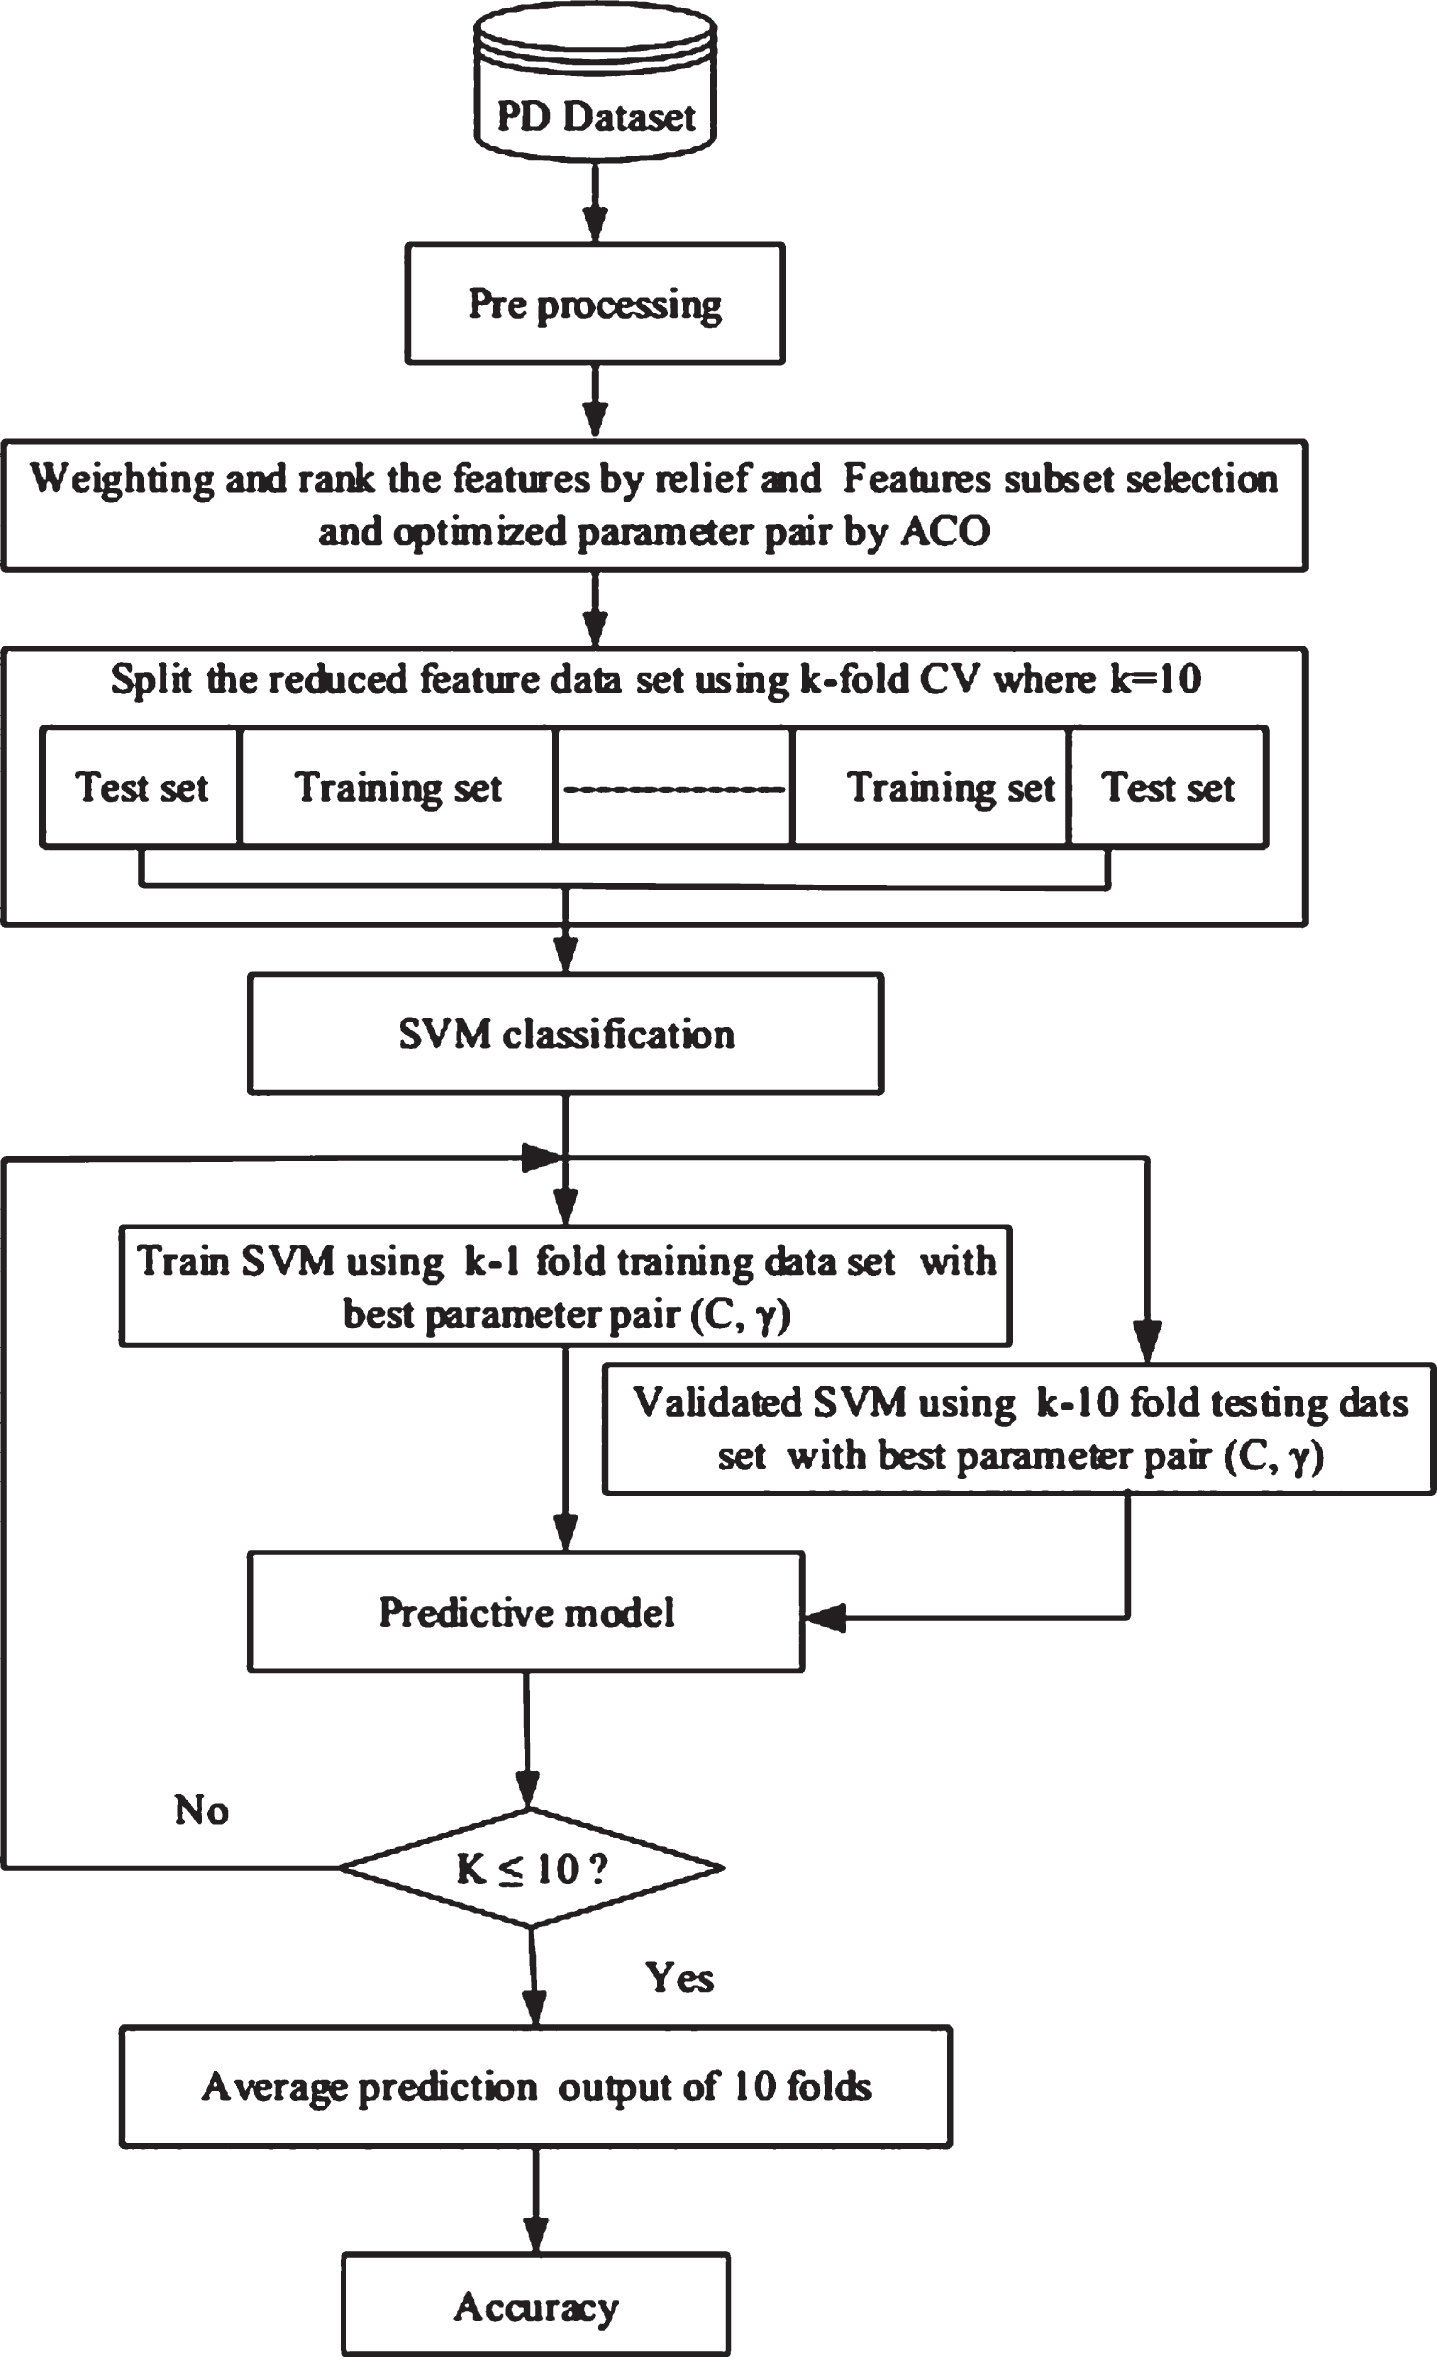
Flowchart of the proposed PD recognition method.
In the following section, we discuss the experimental setup and experimental results.
Experimental setup
In this study, the required experiments have been conducted for different perspectives of PD diagnosis. In the first experiments, feature subsets have been selected by Relief, ACO, and Relief-ACO method. The classification performances have been checked by SVM on dataset with K-Fold Cross-Validation, and the value of K has been set to 10. Lastly, classifier performances have been checked on full and on the selected feature subsets. All performances evaluation metrics have been computed automatically. Python programming language has been used with Intel(R) Cor TM i5 - 2410M 4GB RAM, 3.10 GHz PC for simulations and experiments.
Experimental results
Pre-processing of the dataset
Pre-processing techniques such as deletion of missing values feature samples, standard scalar, and min-max scalar have been applied on the dataset for the effective use of classifier training and testing. These statistical techniques are essential for the basic understanding of the dataset. The 6 instances have been deleted from the dataset due to missing value in the feature column. So the leftover dataset has 195 instances and 22 real value attributes and one output class label. The mathematical operation performed on the dataset has been reported in Table 3. Figure 4 is a histogram that visualized the data set features. The histogram plots are based on a single feature and show the frequency of unique values of a given feature, and it is useful in understanding the count of the data range. Figure 5 is a heat map, which is a two-dimensional representation of data in which colors represent values. A single heat map provides a quick visual summary of information. More elaborate heat maps allow the viewer to understand complex datasets. Furthermore, Heatmap can be super useful when we want to see which intersections of the categorical values have higher concentration of the data compared to the others.
Statistical operation on dataset
Statistical operation on dataset
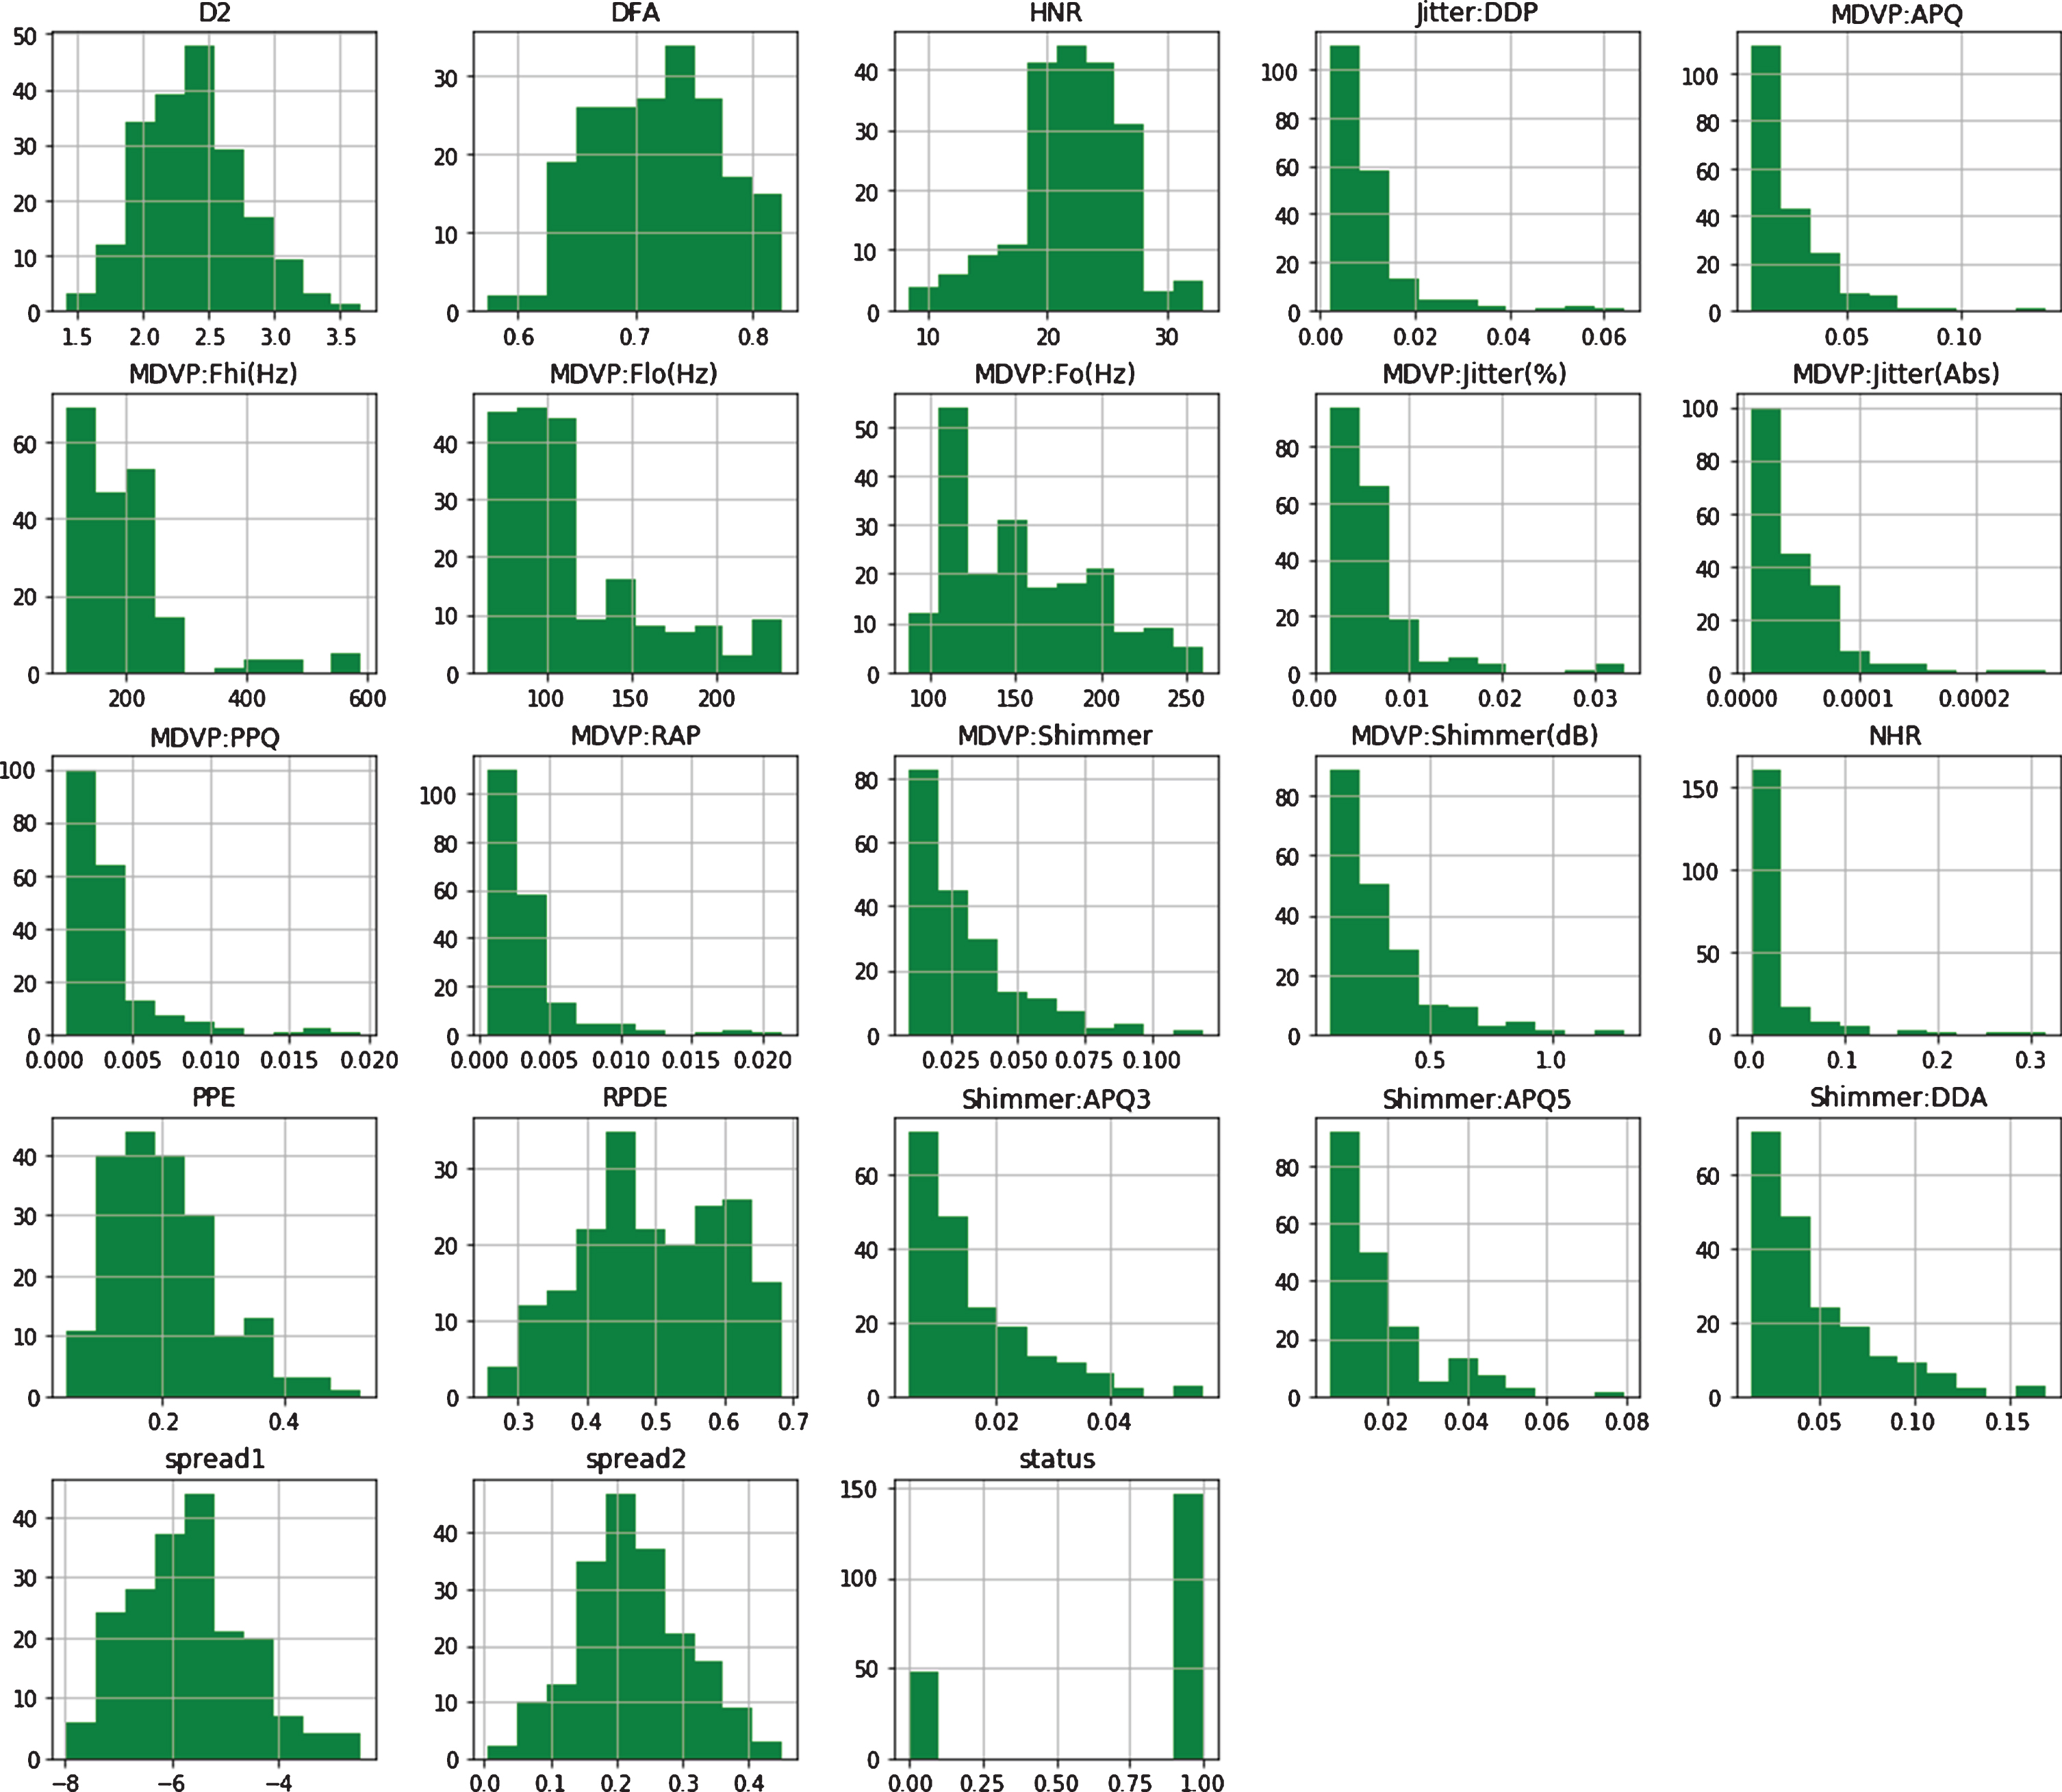
The visual Features representation of PD dataset.
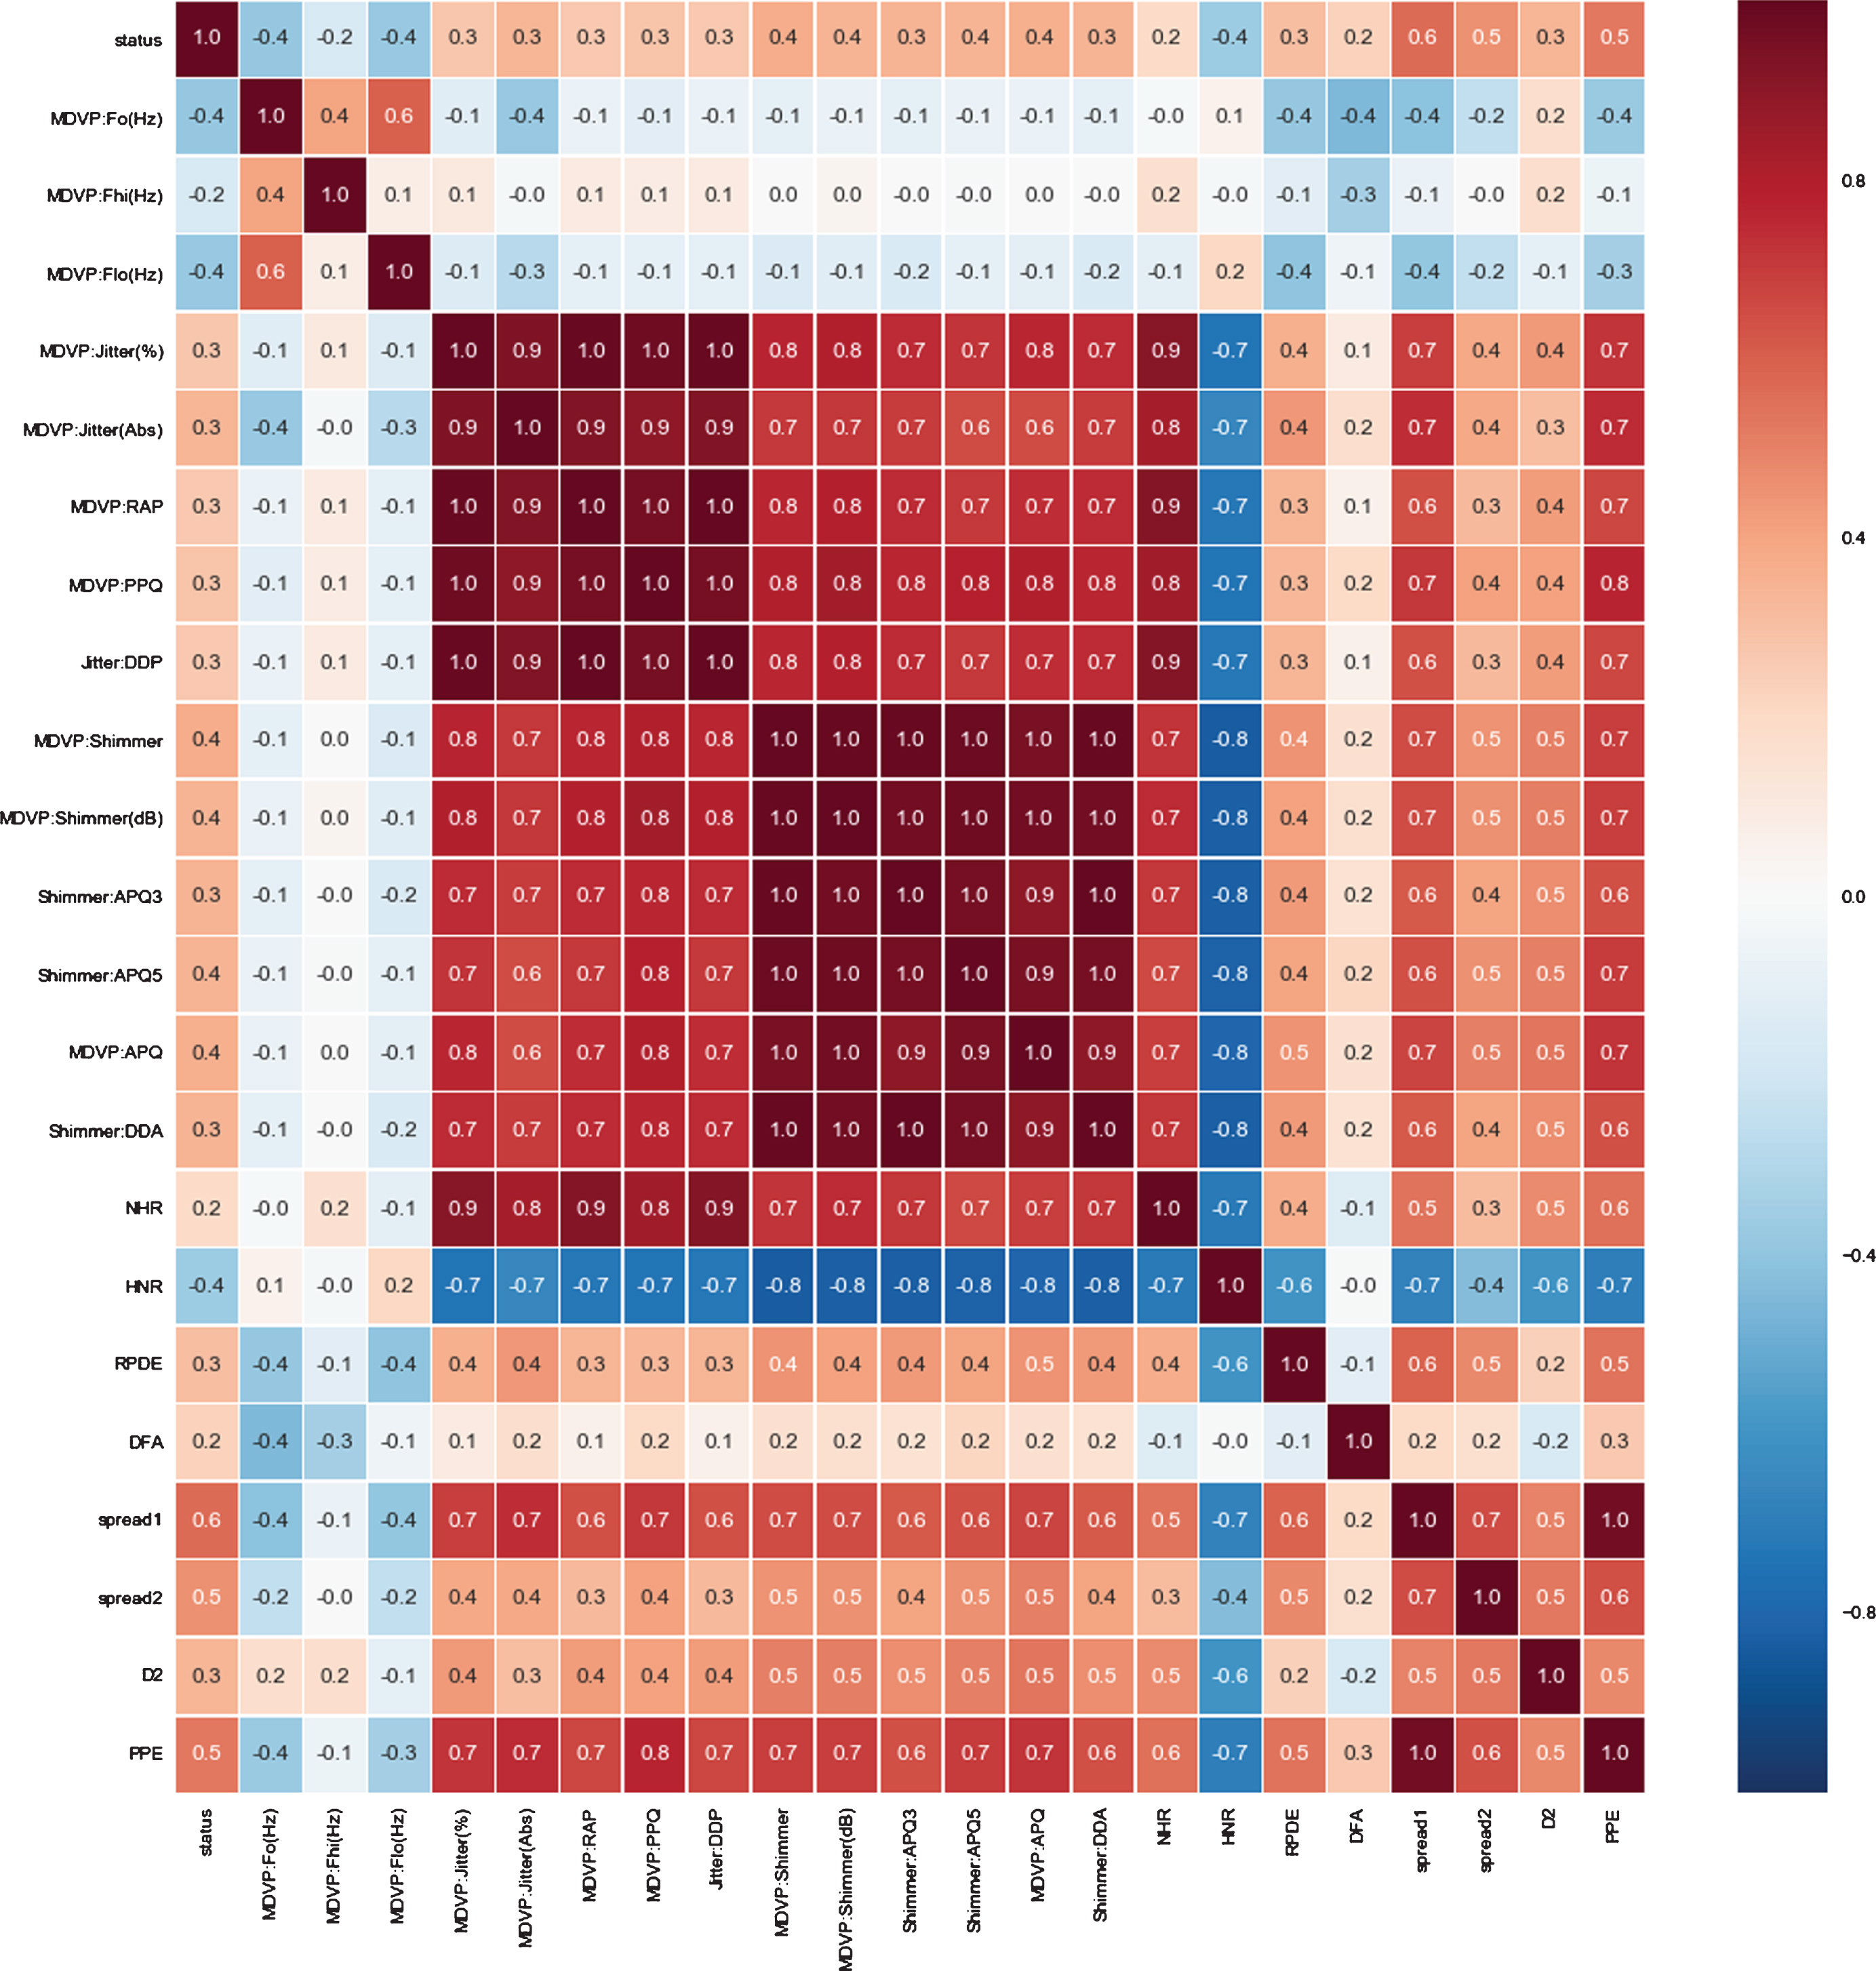
Heat map for co-relationship among the features 0f the dataset.
In this section, the experimental results of feature selection algorithm Relief, ACO, and Relief-ACO have been reported and discussed in details. The features selected by relief algorithm are S1, S2, S3, S5, S6, S7, S9, S11, S12, S13, S14, S15, S16, S17, S18, S19, S21, and, S22 as defined in Table 4. The ACO algorithm selected features are S1, S2, S3, S5, S7, S10, S11, S13, S14, S15, S16, S17, S18, S19, S21, and S22 as defined in Table 4. Similarly, the features selected by Relief-ACO algorithm are S1, S2, S3, S16, S19, S17, S10, S11, S7, S18, S21, S22, and S14 as defined in Table 4. Any feature selection algorithm did not select the feature S20= spread.Therefore, the feature S20 is low impact in recognition of PD. The feature sets selected by Relief, ACO, and Relief-ACO are tabulated in Table 4 and graphically shown in Figs. 6, 7 and 8 respectively. The features selected by Filter based LLBFS [65], PCA [72] and Embedded based LASSO [69] algorithms are tabulated in Table 4. Furthermore, the parameters used by ACO are also tabulated in Table 5.
Feature Selection by Relief, ACO, Relief-ACO, Filter based LLBFS, PCA and Embedded Based LASSO Algorithms
Feature Selection by Relief, ACO, Relief-ACO, Filter based LLBFS, PCA and Embedded Based LASSO Algorithms
List of parameters of the ACO Algorithm
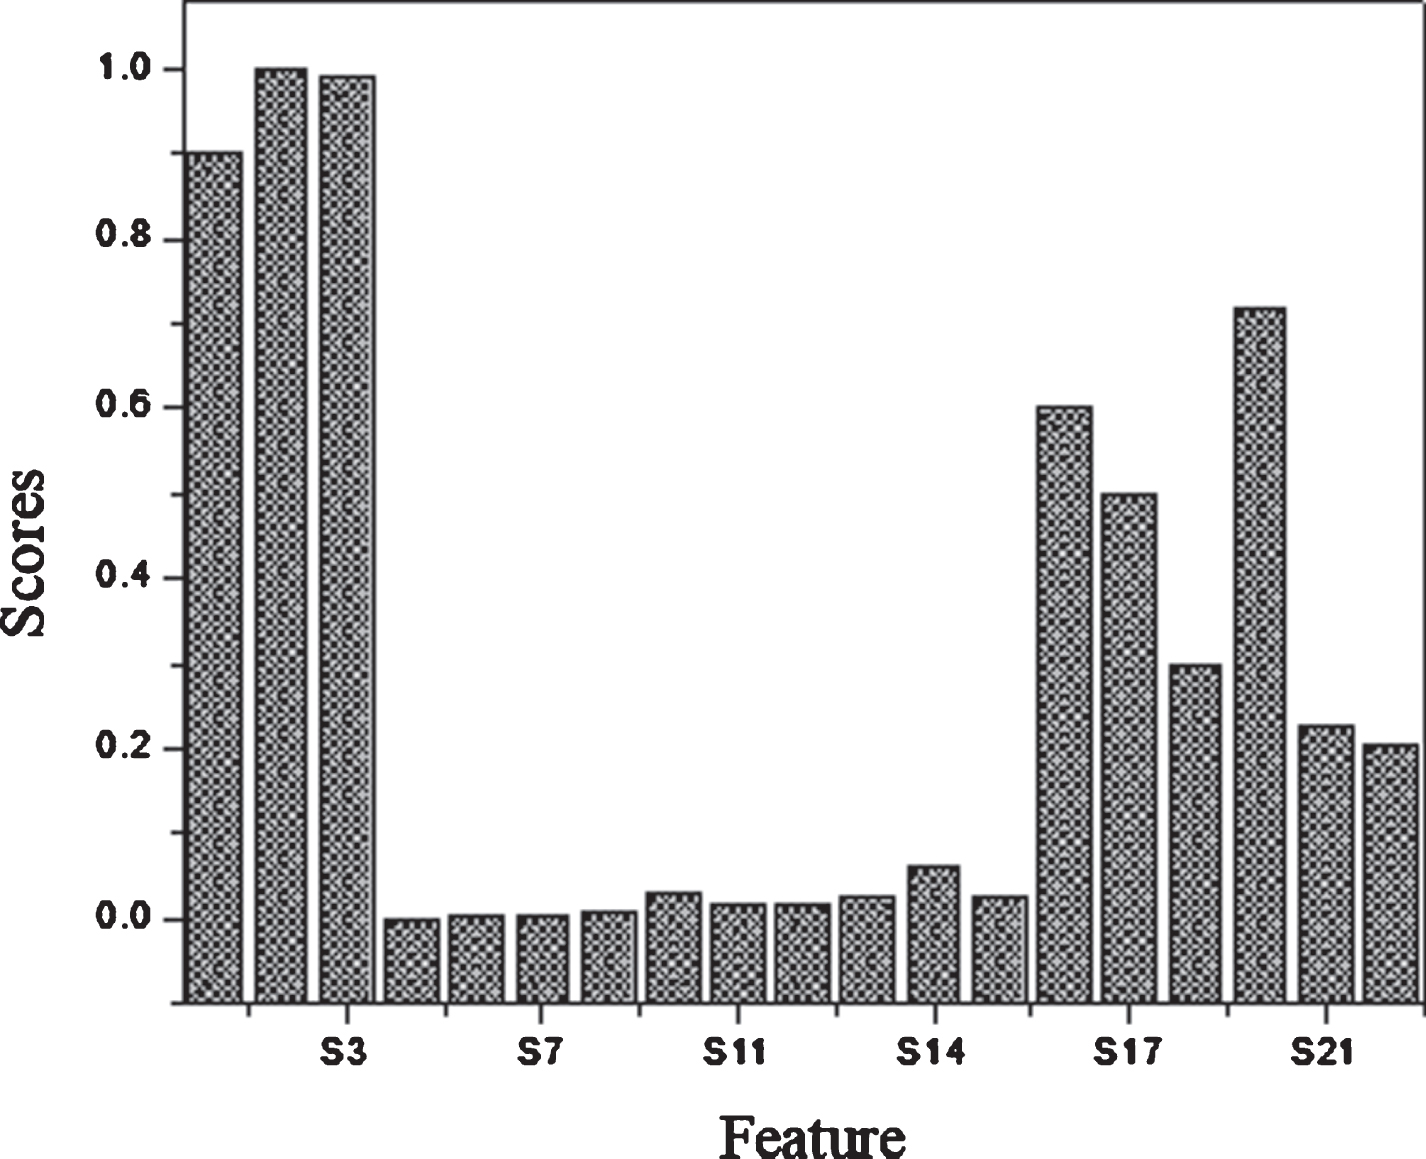
FS by Relief algorithm.

FS by ACO algorithm.

FS by Relief-ACO algorithm.
A support vector machine has been applied in these experiments for Parkinson’s disease recognition. The k-folds Cross-Validation has been used for the hyper parameters tuning and for the best model selection and the value of k is 10 in our experiments. The performance of the support vector machine is high with RBF kernel on 10 folds cross-validation on full features along with hyper-parameter values of C = 2, and γ=0.019. These results are obtained on full feature sets such as classification accuracy 95%, specificity 94%, and sensitivity 100%. While the classification performance of SVM (linear) with features full set using hyperparameter pairs (C = 2, γ (1 =0.019) are better than the RBF kernel. SVM (linear) obtained average performance of classification with 10 folds validation in terms of Accuracy, Specificity and Sensitivity are 97%, 96%, and 100%, respectively. All these results have been tabulated in Table 6. Furthermore, classification results of SVM (RBF) and SVM (linear) have been demonstrated visually in the Fig. 9. The time of computation on the full feature set is also reported in Table 6.
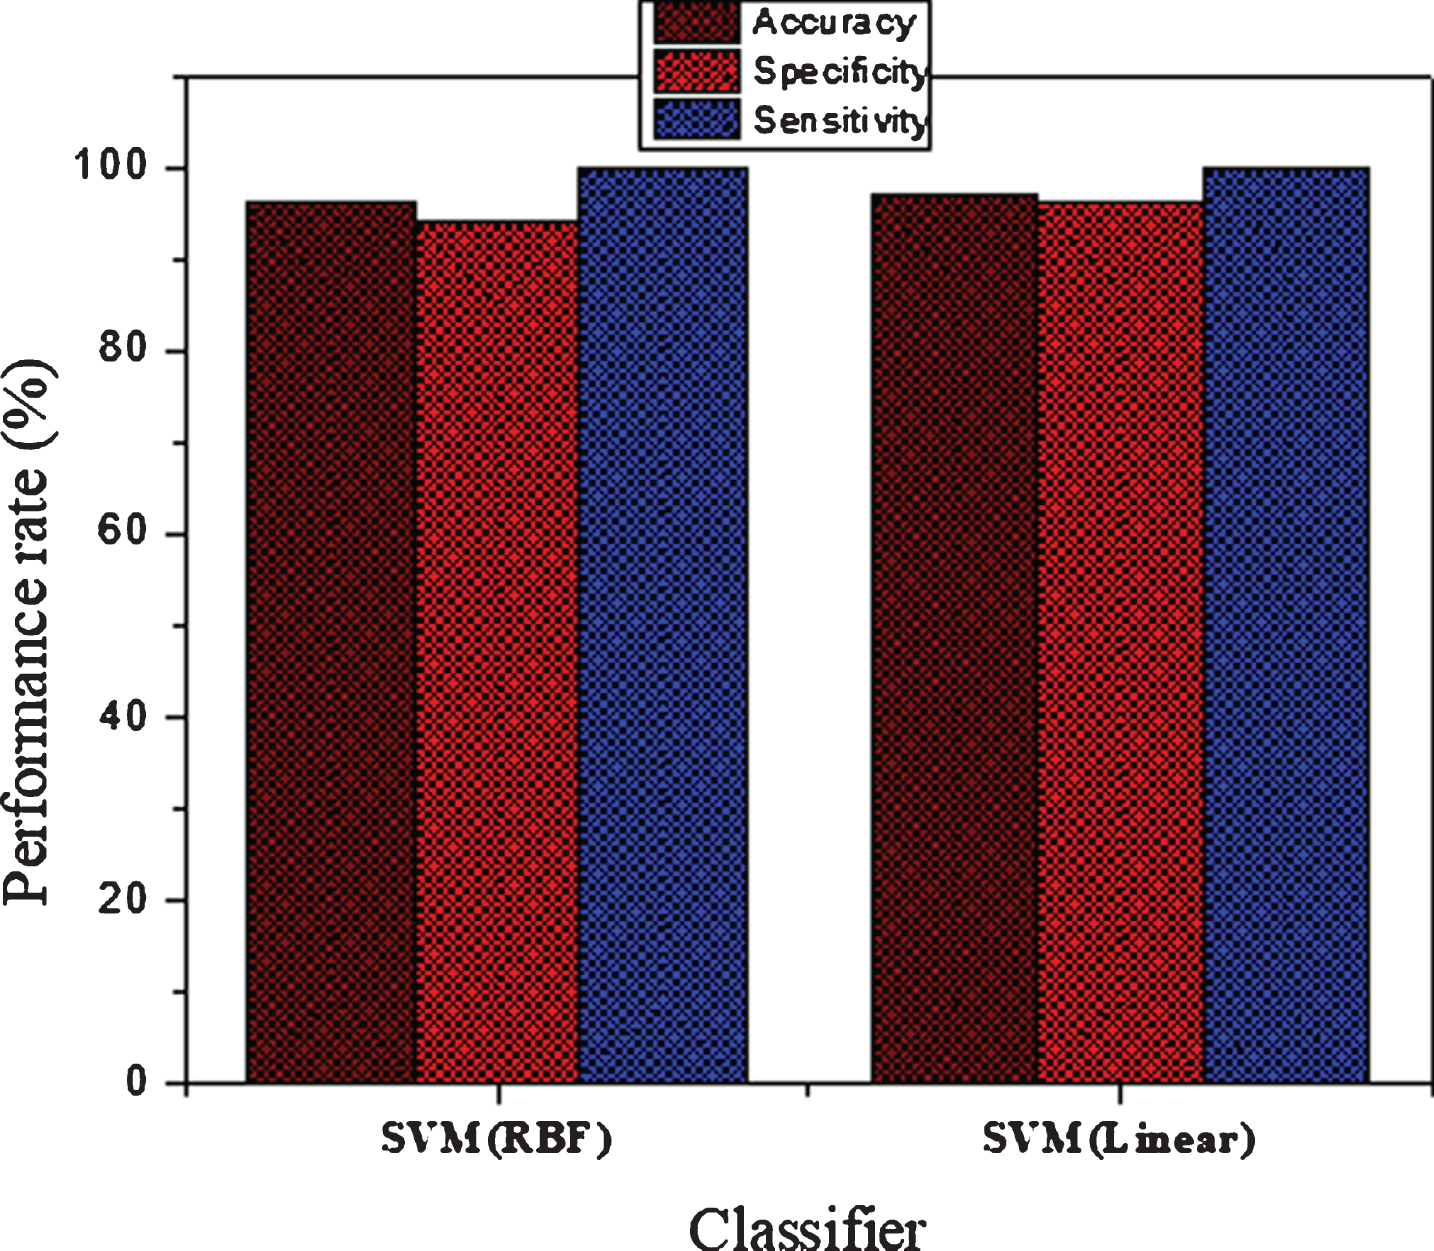
Classification performance of the SVM without feature selection.
Classifier performance with out feature selection
To recognize the PD on reduce feature subset successfully, different experiments have been conducted. In these experiments, the features sets selected by Relief, ACO and Relief-ACO algorithm have been used for effective training and testing of the classifier SVM. SVM along with different kernels have been utilized for classification along with optimized hyperparameter values of C and γ. For the generation of correct results, the k-folds cross-validation method has been applied for hyperparameters tuning and best model selection. Each of the k subsets acted as an independent holdout test set for the model trained with the remaining k-1 subset. The average of cross-validation that all of the test sets are independent, and the reliability of the results could be improved. Thus the experimental results of feature selected by Relief, ACO, and Relief-ACO with classifier SVM have been reported in Table 7. The experimental results show that the classifier classification performances are high on reduced feature sets as compared to the full feature set. According to Table 7 the Relief-SVM achieved 97.10% accuracy, 95% specificity, 98% sensitivity, 97% MCC, 97% F1-score and execution time is 0.072 seconds with RBF kernel while Relief-SVM(Linear) achieved 97.10% accuracy, 96% specificity, 99% sensitivity, 98% MCC, 97 F1-score and execution time is 0.162 seconds.The SVM performance on the selected features set selected by ACO is good. The ACO-SVM(RBF) achieved 98.20% 99%, 97%, 97%, 98%, 98 accuracy, specificity, sensitivity, MCC, F1-score respectively and execution time is 0.061 seconds. The SVM linear performance on the selected feature is also outstanding in terms of accuracy and achieved 98.90% accuracy. Thus, the RF-ACO-SVM achieved 99%, 100%, and 100% accuracy, specificity, and sensitivity respectively with hyper parameters values C =10 and γ = 0.005 using RBF kernel.
SVM Classifier performance on selected features sets Selected by Relief, ACO, and Relief-ACO, Filter based LLBFS, PCA and Embedded Based LASSO Algorithms
SVM Classifier performance on selected features sets Selected by Relief, ACO, and Relief-ACO, Filter based LLBFS, PCA and Embedded Based LASSO Algorithms
Similarly, on the same hyper parameter values with a linear kernel, achieved 99.50%, 100% specificity, 100% sensitivity. The accuracy of SVM (Linear) on the selected feature by Relief-ACO is high as compared to the accuracy of SVM on other feature selection algorithms. The Relief-ACO-SVM achieved 99.50% accuracy which shows that the hybrid feature selection algorithm chooses more suitable features for recognition of PD. The specificity 100% shows that the system accurately detected the health people. Similarly, the Relief-ACO-SVM sensitivity is 100%, which demonstrated that it effectively recognized the PD patients. The classification accuracy of Relief-SVM, ACO-SVM, and Relief-ACO-SVM has graphically shown in Figure 10 which demonstrated that the Relief-ACO-SVM performance in term of accuracy is high as compared to Relief-SVM and ACO-SVM. The execution time of Relief-ACO-SVM also lows as compared to the execution times of Relief-SVM and ACO-SVM. The execution time of the three feature selection algorithms with classifier SVM shown graphically in Fig. 11. In Fig. 12 execution of SVM on the full feature set and on selected feature set selected by Relief-ACO) has been graphically demonstrated. The Classification performances of Classifier SVM on features sets selected by Filter based LLBFS, PCA and Embedded Based LASSO Algorithms have been reported in Table 7. From all experimental results analysis, we suggest that Relief-ACO-SVM method is suitable for effective recognition of the PD. Additionally, the proposed hybrid feature selection algorithm (Relief-ACO) is suitable for relevant feature selection and intelligently tackle the feature selection problem.
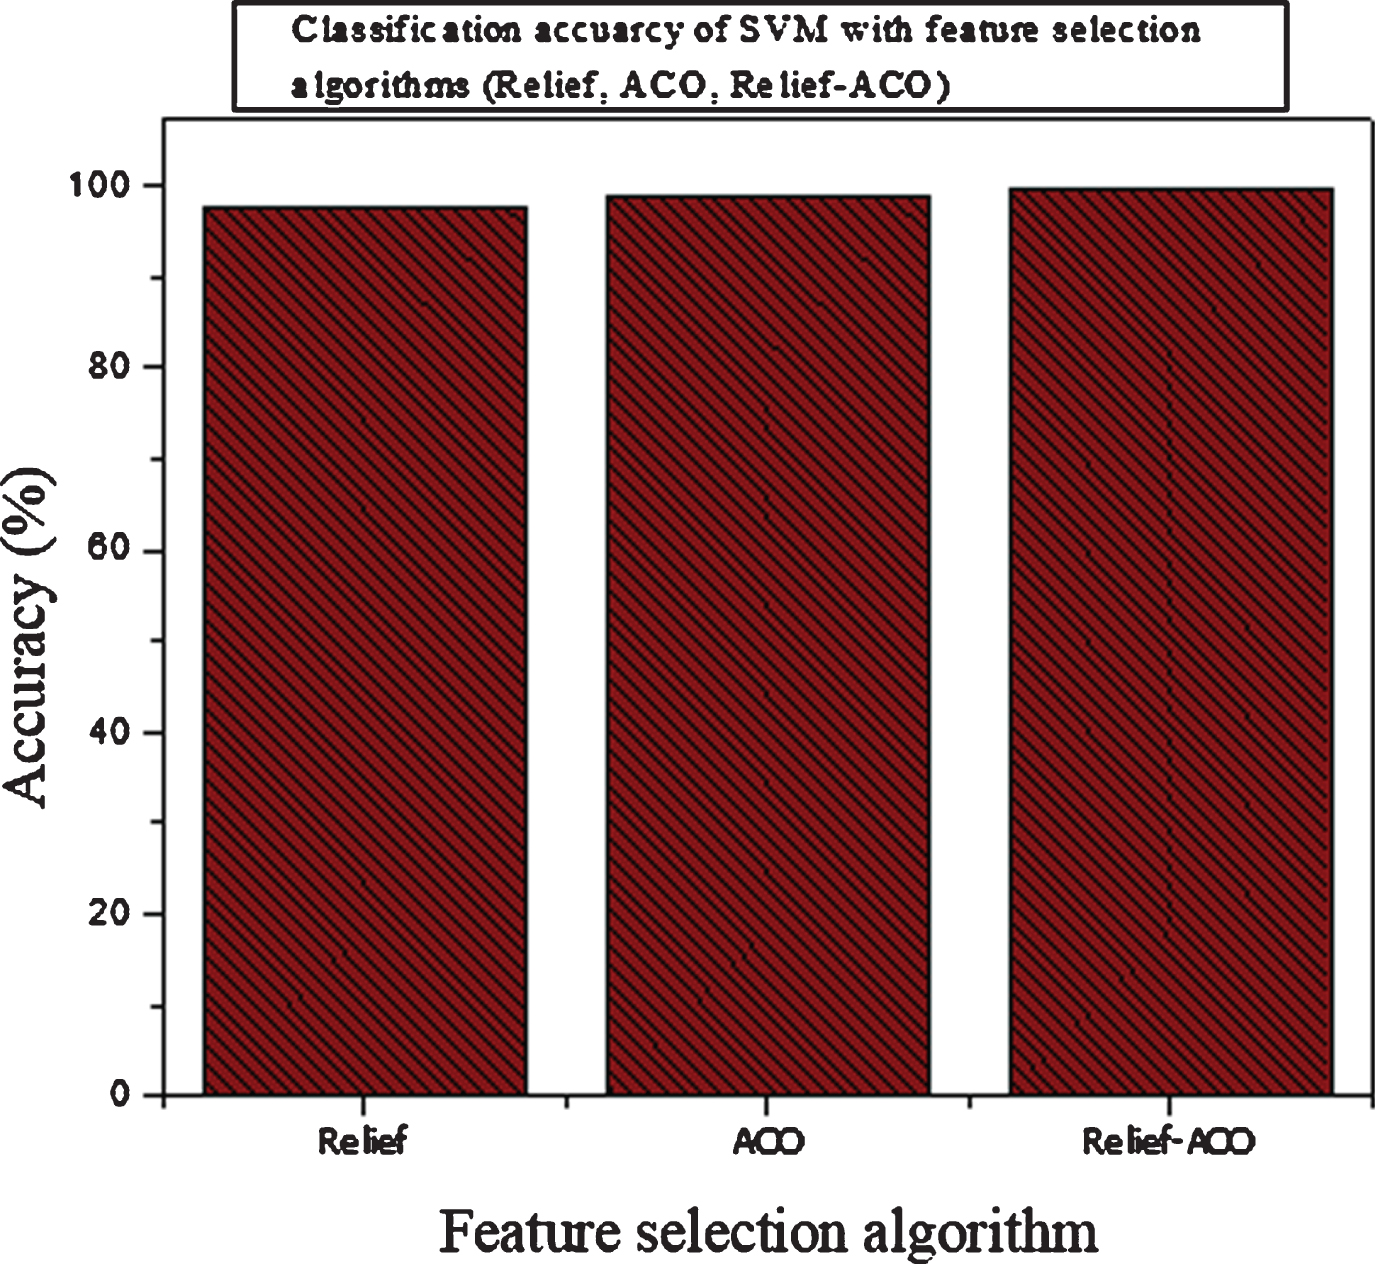
Accuracy of the SVM on selected features.
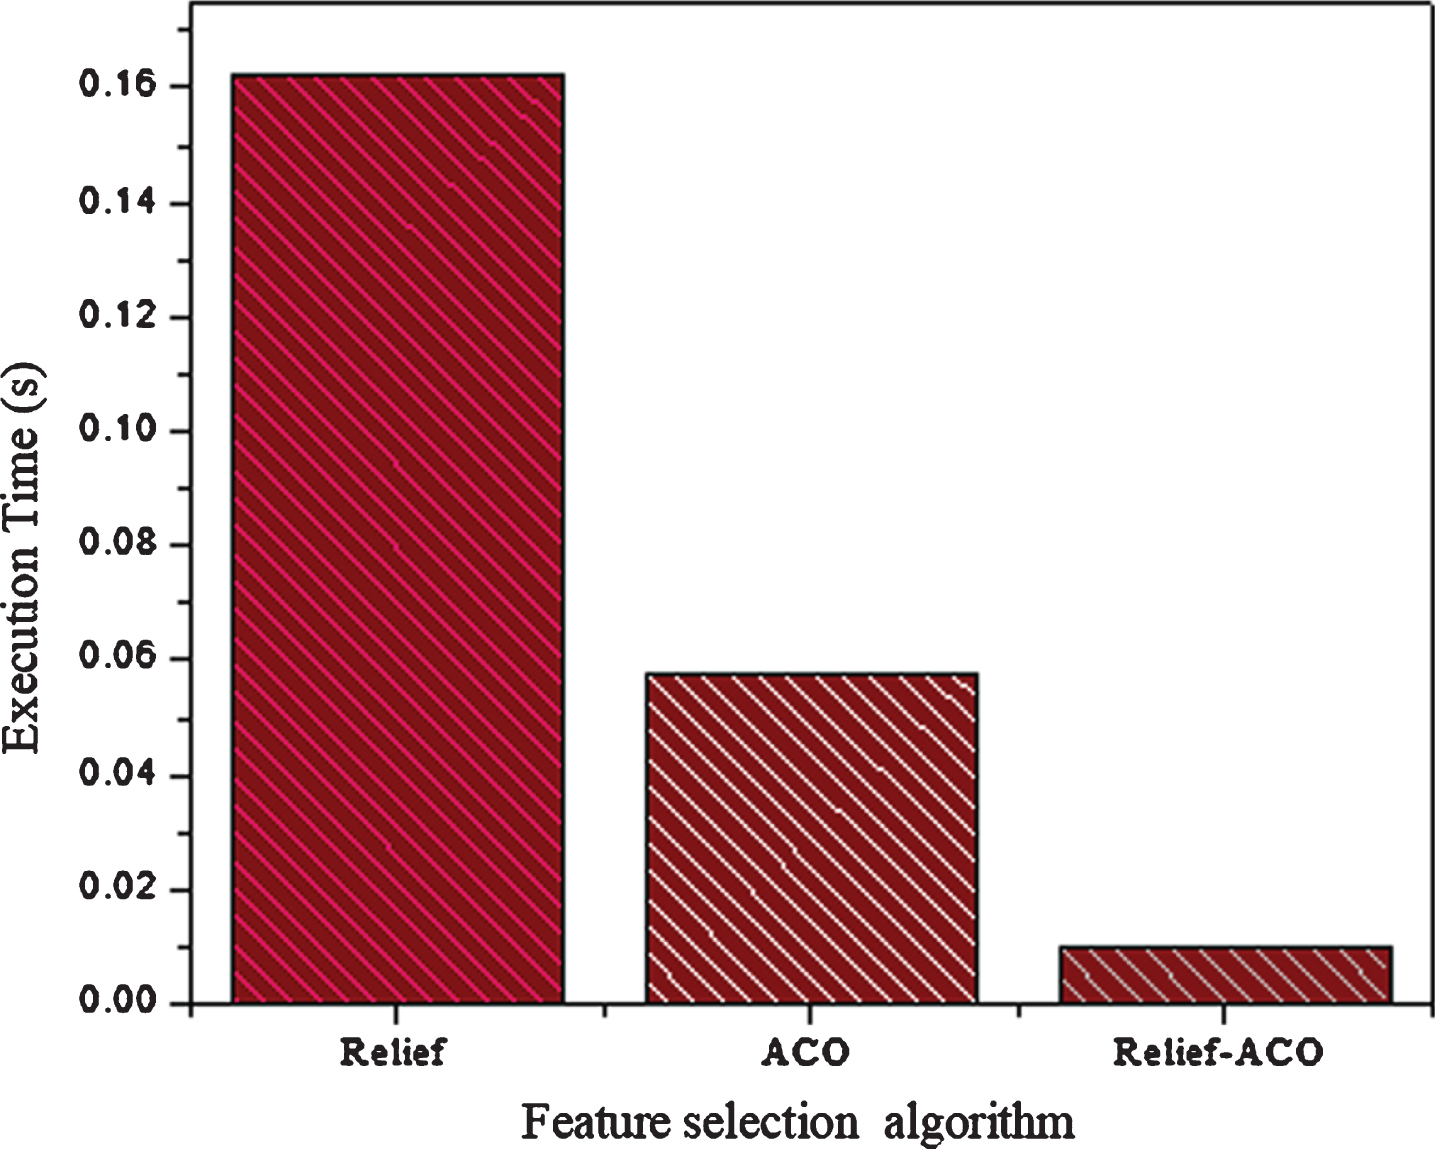
Execution time of the SVM on selected features sets.
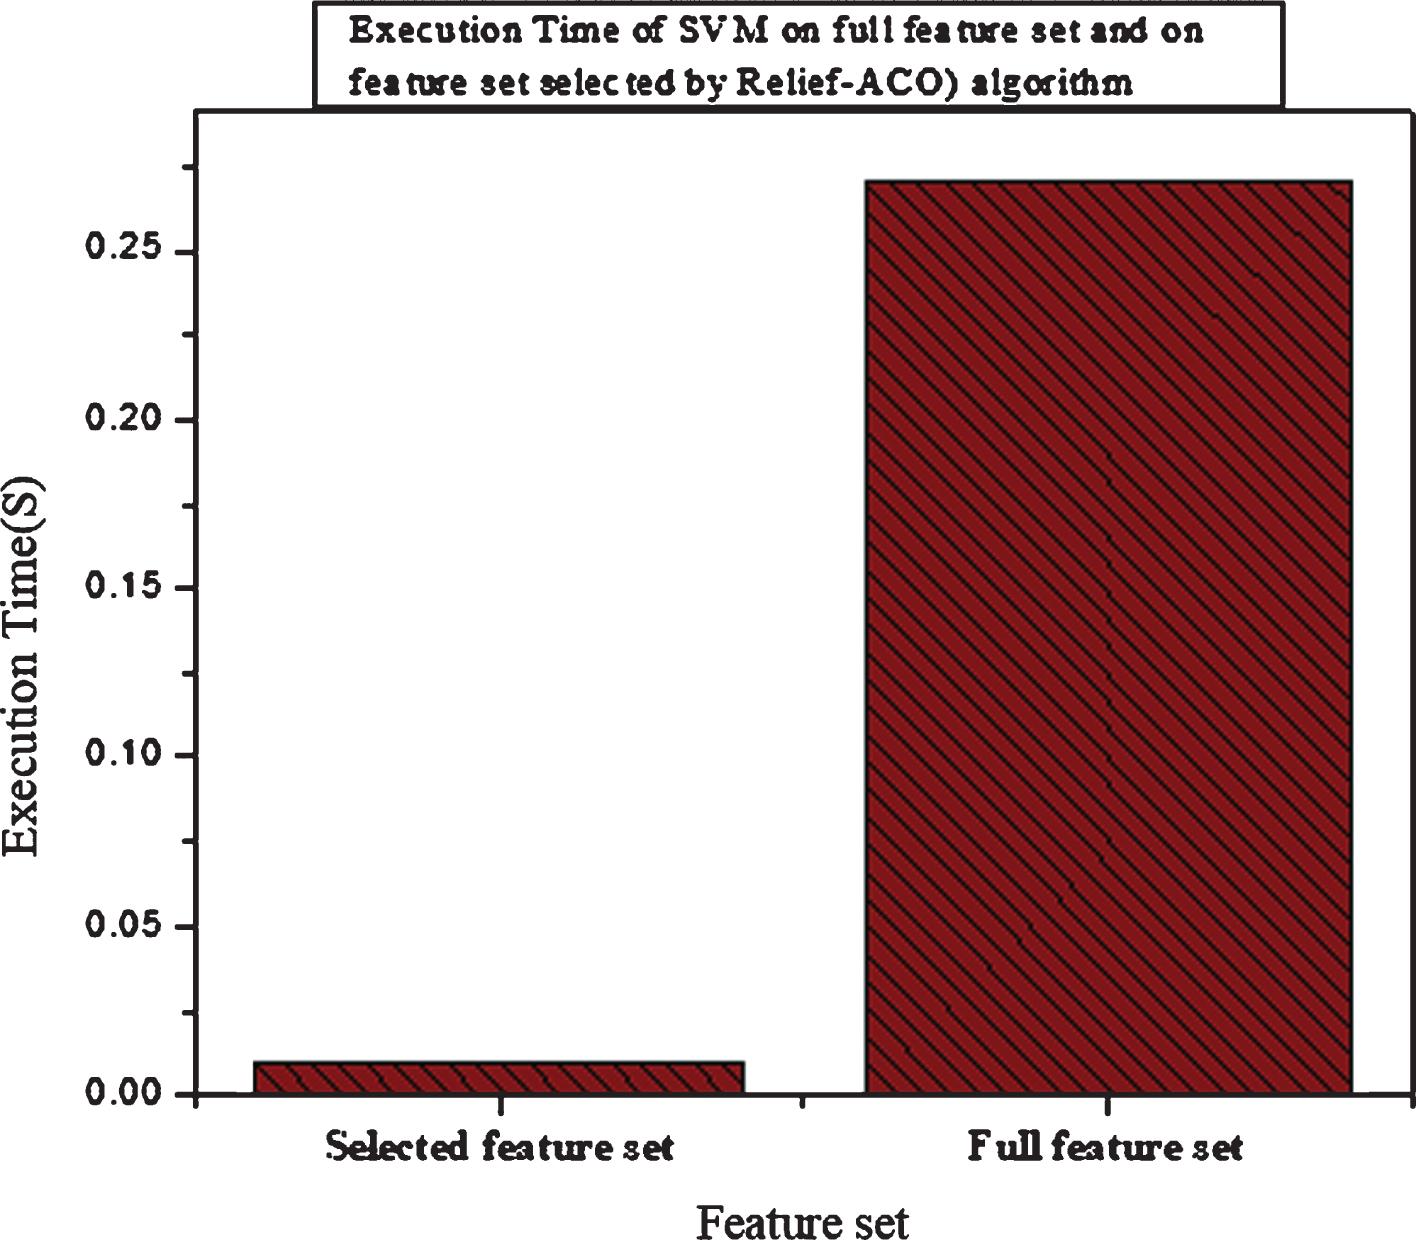
Execution time of the SVM on the full features set and on features set selected by Relief-ACO.
The classification performance of other ML classifiers such as Logistic regression(LR), K-Nearest Neighbor(K-NN) and Decision Tree(DT), Naive Bayas (NB) and Radmom Forest (RF) also have been checked on feature sets selected by Relief, ACO, and Relief-ACO, Filter based LLBFS, PCA and Embedded Based LASSO FS algorithms with different hyper-parameters values of these classifiers. In Table 8 the classification performances of these classifiers have been reported. According to Tables 7 and 8, the classification performances of the SVM is higher then the LR, K-NN, DT, NB and RF classifiers. Therefore, SVM is more suitable classifier for classification of PD and healthy people. Relif-ACO-SVM method is more higher in performances then Relief-SVM, ACO-SVM, and with other Filter based LLBFS, PCA and Embedded Based LASSO FS Algorithms. Furthermore, Relief-ACO algorithm is more suitable for adequate features selection from PD dataset.
Classifier LR, K-NN, DT, NB and RF performance on selected features sets Selected by Relief, ACO, and Relief-ACO, Filter based LLBFS, PCA and Embedded Based LASSO Algorithms
Classifier LR, K-NN, DT, NB and RF performance on selected features sets Selected by Relief, ACO, and Relief-ACO, Filter based LLBFS, PCA and Embedded Based LASSO Algorithms
In order to compare the performance of machine learning models with deep learning models we use BPNN for classification problem. The training parameters are updated of BPNN in order to generate high classification results. Therefore, different number of hidden layers, hidden neurons, learning rate and epochs are applied for producing excellent result in our experiments. In Table 9 the BPNN architectures of different networks are given such as BPNN1, BPNN2, and BPNN3.These networks are trained and validated with full features set and on features set selected by Relief-ACO. According to Table 9 the performance of BPNN2 is high and achieved 96.00% classification accuracy. Thus deep neural network performance is not high as compared to transitional machine learning classifiers. The traditional classification algorithm SVM according to Table 6 achieved 99.50% accuracy on selected features set. However, deep backward neural network no need feature selection for classification. Deep neural network automatically select import features for improving the result of classification. These are great advantages of deep neural network. However, in our experiments, the Deep neural network performances are not good comparatively to Machine learning models because DNN require more numbers of instances for training the model effectively. The dataset used in our experiments have 197 instances which are insufficient for training the model of DNN to achieved good results.Therefor, ML models are more suitable in case of small dataset.
Training parameters for BPNs
Training parameters for BPNs
Statistically, we applied McNemar’s test to compare the performance of different predictive models. In our experiments the hypothesis setting in such a way that H0 : n01 = n10, if the performance of the predictive models is the same accuracy. And H1 : n01 ≠ n10, the alternate hypothesis, the two model have different accuracy. To validate the null and alternate hypothesis we calculate the test statistic or p-value for different models using McNemar’s test. The value of alpha for all experiments is 0.5, and confidence level 95%. Thus on the basis of p-value and alpha we accept or reject the null hypothesis on the following conditions If P > α : then H0 is fail to reject, the models have no difference. If p < = α: then H0 is rejected and alternate H1 is accepted the models have difference performance when trained on the particular training set R. The experimental results of test-statistic or p-value are computed for each model and reported in Table 10 and level of significant is 0.5. The p-value of SVM is 0.4 which is less then alpha so this model is significant.The LR, K-NN, DT, NB, RF and BPNN p-values are 0.19, 0.30, 0.29, 0.35, 0.33, 0.31 which are less then 0.5, thus these models are significantly different from each other and null hypothesis is rejected. The the McNemar’s test statistic p value of SVM is near to alpha as compared to other models. Therefore, p=0.4 <0.5 so null H0 is rejected it means that models are not significantly similarly and different exist in terms of accuracy between the these models.
P-Value of the Predictive model
P-Value of the Predictive model
On the basis of these statistical results, we concluded that SVM significantly outperform other counterparts in term of accuracy, thus the proposed Relief-ACO-SVM method is suitable for the PD recognition. Thus, the selection of more appropriate features using the Relief-ACO FS algorithm and classifier SVM helped the model to effectively diagnose PD. The proposed FS algorithm has selected features including MDVP:Fhi(Hz), MDVP:Fo(Hz), jitter MDVP: Flo (Hz), HNR, DFA, RPDE, MDVP: Shimmer (dB), DVP.Shimmer(dB), MDVP.PPQ, D2, spread2, PPE, and Shimmer.DDA. In this research, we did not choose the feature spread as it has less impact in the prediction of PD. Additionally, the nonlinear features as well as jitter, and HNR are employed to discriminate the PD. A highly relevant nonlinear feature is RPDE. This feature quantifies the uncertainty in the measurement of the pitch period and it has been identified by the proposed method as a relevant feature for the PD detection. Nonlinear features are not only efficient for PD detection, but also they can identify other voice-related diseases. In a nutshell, the proposed method can be useful for detection of PD especially in early detection of the PD.
In this section, we evaluate the performance of the proposed method (R-ACO-SVM) with other baseline methods. Table 11 demonstrates the accuracy of various counterparts against our model. All these studies used various techniques for PD and healthy people classification. However, the proposed classification system R-ACO-SVM performance is excellent and achieved a high accuracy of 99.50% comparatively. Additionally, the specificity of the R-ACO-SVM is 100%, which shows that the system effectively detected the healthy people. Similarly, the proposed model gained 100% sensitivity, which is significant for the diagnosis of the PD subjects. Also, the execution time of the proposed method is 0.01 seconds. The performance of the proposed method can be credited to the utilization of relevant features.
Performance comparison of the our method with other counterparts
Performance comparison of the our method with other counterparts
Parkinson’s disease is a dangerous human disease, and numerous people have been suffered from this disease around the world. Therefore, reliable technique is required for an adequate recognition of the PD. In this article, we proposed a reliable method of Parkinson’s disease recognition using appropriate machine learning approaches. Specifically, SVM has been applied for the classification of Parkinson’s disease and healthy subjects. Relief and ACO based integrated method has been adopted for the selection of related features. Additionally, K-folds cross validation method has been used for optimal value selection of Hyper-parameters for the best model. Furthermore, evaluation metrics have been used to evaluate the performance of proposed model. The experimental results demonstrate that the R-ACO-SVM classifies Parkinson’s disease and healthy subjects correctly. The High performance of our method is due to the exploitation of adequate features selected by the hybrid feature selection algorithm (Relief-ACO). Additionally, the selected features set by the Relief-ACO algorithm is demonstrated critically significant features which detect Parkinson’s disease accurately as compared to other feature selection algorithms. The proposed method R-ACO-SVM achieved excellent results in terms of accuracy and achieved 99.50% accuracy. Furthermore, the proposed method can be easily used in the healthcare organization. In future work, deep neural work techniques will be used to classify Parkinson’s diseases and healthy people because deep neural network automatically selects appropriate features for classification while machine learning algorithms require feature selection algorithm. The proposed method will be applied on the other datasets for the detection of similar kind diseases. The treatment and recovery after disease diagnosis is necessary, therefore, in future we will work on disease treatment and recovery.
Data Availability
The dataset used in this research work available on the UCI machine learning repository.
Conflicts of interest
The authors declare that they have no conflicts of interest.
Footnotes
Acknowledgment
This work was supported by the National Natural Science Foundation of China (Grant No. 61370073), the National High Technology Research and Development Program of China (Grant No. 2007AA01Z423), the project of Science and Technology Department of Sichuan Province.