
Abstract
Bipolar fuzzy graph is more precise than a fuzzy graph when dealing with imprecision as it is focusing on the positive and negative information of each vertex and edge. Nowadays, researchers have utilized bipolar fuzzy graphs in decision-making problems. Bipolar fuzzy competition graphs aid to compute the competition between the vertices in bipolar fuzzy graphs. To depict the best competitions among the competitions of bipolar fuzzy graphs, the best bipolar fuzzy competition graph can be defined using bipolar fuzzy α-cut and the strength of the competition between the vertices can also be determined. Fuzzy graphs are used well to frame modelling in real-time problems. In particular, when the real-time scenario is modelled using the bipolar fuzzy graph, it gives more precision and flexibility. At present, researchers have focused on decision-making techniques with bipolar fuzzy graphs. The DEMATEL method is one of the powerful decision-making tools. It effectively analyses the complicated digraphs and matrices. The fuzzy DEMATEL technique can convert the interrelations between factors into an intelligible structural model of the system and divide them into cause and effect groups. Therefore, this study attempts to design the DEMATEL method under the bipolar fuzzy environment. To illustrate this proposed technique, the problem of identifying the best mobile network is taken. With this method, the benefits and drawbacks of networks are measured and a complicated bipolar fuzzy directed graph can be transformed into a viewed structure.
Keywords
Abbreviations
Bipolar Fuzzy Set
Decision-Making Trial and Evaluation Laboratory
Fuzzy Directed Graph
Bipolar Fuzzy Graph
Bipolar Fuzzy Directed Graph
Bipolar Fuzzy Competition Graph
Bipolar Fuzzy Common Enemy Graph
Bipolar Fuzzy Competition Common Enemy Graph
Introduction
The competition graph was defined by Cohen [19] to study the problem of the ecosystem. It was a digraph
When the real-world problem is full of uncertainties, it cannot be properly modelled by a crisp graph theory. To deal with such uncertainties and vagueness of the problem, the concept of fuzzy sets was introduced by Zadeh [25]. Fuzzy models are designed for the real-time scenario by the researchers to decrease the variances among the traditional models that were used in science and engineering. Currently, fuzzy sets are widely used in numerous fields such as engineering [42], medicine [51] and all the decision-making problems [16, 53–55]. Zadeh [24] derived fuzzy relation, fuzzy algorithms, fuzzy turing machines and some properties of fuzzy sets and estimated the reasoning using linguistic variables [26].
From Zadeh’s fuzzy relations, Kaufmann [5] paved the way for the fuzzy graph. From his notion, Rosenfeld [8] measured the fuzzy relations between the fuzzy sets and advanced the construction of fuzzy graphs, revealed the remarks of several graphs and theoretical ideas. Raychaudhuri [7] proposed a generalized competition graph and its applications and solved many real-time problems with the help of these applications where the examples specify that not all properties of a fuzzy graph can be expected to be similar to properties of (crisp) graphs. Bhattacharya [38] revealed that the fuzzy group can be connected with a fuzzy graph naturally by deriving some results and presented the center and eccentricity of the fuzzy graph.
The wide variety of human thinking leads to bipolarity. Therefore, based on this information Zhang [48] presented the first notation of the bipolar fuzzy set (BFS) and defined an interval-based bipolar fuzzy logic that generalizes a real-valued bipolar fuzzy logic. Mordeson [20] initiated the operations of join, union, cartesian product and composition on fuzzy subgraphs of a graph. Akram [31] presented the view of the bipolar fuzzy graph (BFG) and derived many approaches. Also, the concepts of isomorphism of those graphs were discussed and few significant properties of them were examined. The same author introduced strong BFG and some properties of those graphs. Furthermore, some intentions of self and self-weak complementary of strong BFG were discussed. Akram [30] introduced the notion of the regularity of BFG.
Numerous problems on competition graphs have been done, where the vertices and edges are explained precisely. In reality, it cannot be described accurately. For example, in an ecosystem, the species may be veg., non-veg., weak, strong, etc. Similarly, preys may be harmful, digestive, tasty, etc. Therefore, the species and prey and their relations may be considered as fuzzy sets because a lot of uncertainties arise in them. Therefore, these ideas exhibit the necessity of a fuzzy competition graph. Based on this hint, Samanta [45] presented the notion of the generalized fuzzy k-competition graphs and fuzzy p-competition graphs of a fuzzy digraph (FDG). To determine the strength and weakness of a species, the bipolar concept is adopted in a fuzzy competition graph. Alshehri [37] designed the theory of bipolar fuzzy competition graph (BFCG). Sarwar [34] presented various methods for constructing the BFCG and presented an application of BFCG in local government politics to identify the competition strength between the political candidates. Moreover, an algorithm for finding the strength of competitions in BFCG was created [33]. Recently, various constructions of competition graphs have been studied with other extensions of fuzzy graphs [20, 44].
The MCDM problems are modeled to obtain the best alternatives/criteria using bipolar fuzzy graphs. Algamadi [36] extended the bipolar TOPSIS and ELECTRE I method under the bipolar fuzzy environment to solve MCDM problems. Besides, Sarwar [35] extended the BF-TOPSIS model with bipolar measurements. Since the idea of using bipolar fuzzy concepts in MCDM problems is attractive, the DEMATEL can also be extended using the bipolar fuzzy graph to find the best criteria and to visualize the complicated graph in a visible manner. DEMATEL method is one of the powerful tools to view the higher-order matrices and complicated digraphs with more vertices and edges, which was introduced by Fontela and Gabus [12] at Battelle memorial institute, Geneva research centre. This technique can alter the relations among the causes and effects of criteria in a visible manner. The basis of this model is graph theory and provides us to get an improved understanding of causal relations by separating significant and connected issues to cause-effect as well as make it possible to imagine the casual relations of sub-criteria.
DEMATEL method has been successfully applied by many researchers. Hori [41] applied this method to design and evaluation is done for constructing screen structures. Yu-Jing [10] employed this method to promote a strategy for manufacturing LCD-TV. Chi-Yo [15] identified the major industry innovation requirements by using the DEMATEL technique for an industry in Taiwan. Shieh [18] used to evaluate the importance of criteria and construction of the causal relations between the criteria to the hospital management. Sekar [46] assessed the DEMATEL technique for analyzing the occupational risks on construction sites to improve the safety measures with fuzzy linguistic terms. Devadoss extended the DEMATEL method under uncertain linguistic situation by using various fuzzy numbers [9]. The relationships among the risk factors of knowledge-based networks are viewed by Abbasi [27]. DEMATEL method is observed and extended with different perspectives. Sankar [21] proposed a novel technique of DEMATEL using a combined effect time-dependent matrix. Also, modelled the fuzzy cognitive DEMATEL method to analyze the cause-effect of climate change [3]. When the threshold function is linear, Tzeng [14] observed that DEMATEL is the exact idea of fuzzy decision maps (FDM). Felix [13] used fuzzy DEMATEL to analyze the IC fabrication procedure. Recently, a combined study of DEMATEL with Haar FCM is done to investigate solid waste management [2]. A hybrid DEMATEL technique was obtained for visualizing [43] the interdependences among the unpredictable aspects through an interrelationship map. Gan [17] used intuitionistic fuzzy sets in the DEMATEL technique to find the critical factors influencing the reprocessing rate of end-of-life vehicles in China. Integrating DEMATEL with interval-valued intuitionistic fuzzy values and Choquet Integral was proposed [6] for sustainable solid waste management. To obtain the critical success attributes in emergency management, Ding [50] combined DEMATEL with 2-dimensional imprecise linguistic variables. AHP and DEMATEL methods are used [23] to analyze the field of distributing logistics for avoiding product distribution problems by Kinga. To select the location of freight village, Karasan [4] proposed an integrated DEMATEL-ANP-TOPSIS method using intuitionistic fuzzy sets. To attain the importance-weights of the caused criteria in an air-filter manufacturing company, Huseyin [47] employed the DEMATEL and ELECTRE techniques under an intuitionistic fuzzy environment. Li [49] executed a novel framework of fuzzy DEMATEL with TOPSIS methods to access the wide-ranging risk hydrogen generation unit. Chen [52] developed the novel graphics-based rough fuzzy DEMATEL for innovative value proposition assessment. To analyze the quarantine decisions in the COVID-19 pandemic situation, Fatma [1] demonstrated the DEMATEL with the data from the household tourism survey. From this review, it is observed that the following work can be done. The best BFCG using the bipolar fuzzy α-cut can be defined The bipolar fuzzy DEMATEL technique can be designed using BFG.
Motivation
This study attempts a method to detect the best competition among the competitions in BFDG. The following questions are raised when a BFCG is considered. In case there are numerous competitions exist in BFCG, can we find the best competitions among them? Can we depict the best competition graph of BFCG? These situations are considered as a motivation to attempt this work. The DEMATEL method is one of the effective tools. It analyses the complicated digraph and matrices. Bipolar fuzzy digraph (BFDG) deals well with the uncertainty involves in bipolar (positive and negative) thoughts. Bipolar concepts are motivated to design the DEMATEL method under bipolar fuzzy environment.
Structure of the paper
The article is structured as follows: This study is divided into five sections. Section-1 covers the introduction of the proposed work and motivation. Section-2 provides basic definitions to support the proposed work. Section-3 discusses the BFCEG and BFCCEG, the bipolar fuzzy α- cut and best BFCG with an example. Section-4 designs the bipolar fuzzy DEMATEL method and its numerical illustration. Section 5 provides the comparative study. Finally, it provides the conclusion and future directions of the present study.
Preliminaries
This section contains the basic definitions of bipolar fuzzy digraphs. Moreover, the definition and illustration of BFCG and BFCEG are given.
Bipolar fuzzy graphs
In this part, few basic definitions of BFG are given. Throughout this paper, G* and G are denoted as a fuzzy graph and bipolar fuzzy graph respectively.
Bipolar fuzzy competition graphs
The BFCG helps to find the strength of the competitions between vertices. It aids to make a decision in food webs and other sectors. Therefore, BFCG is elaborated with an example in this section.
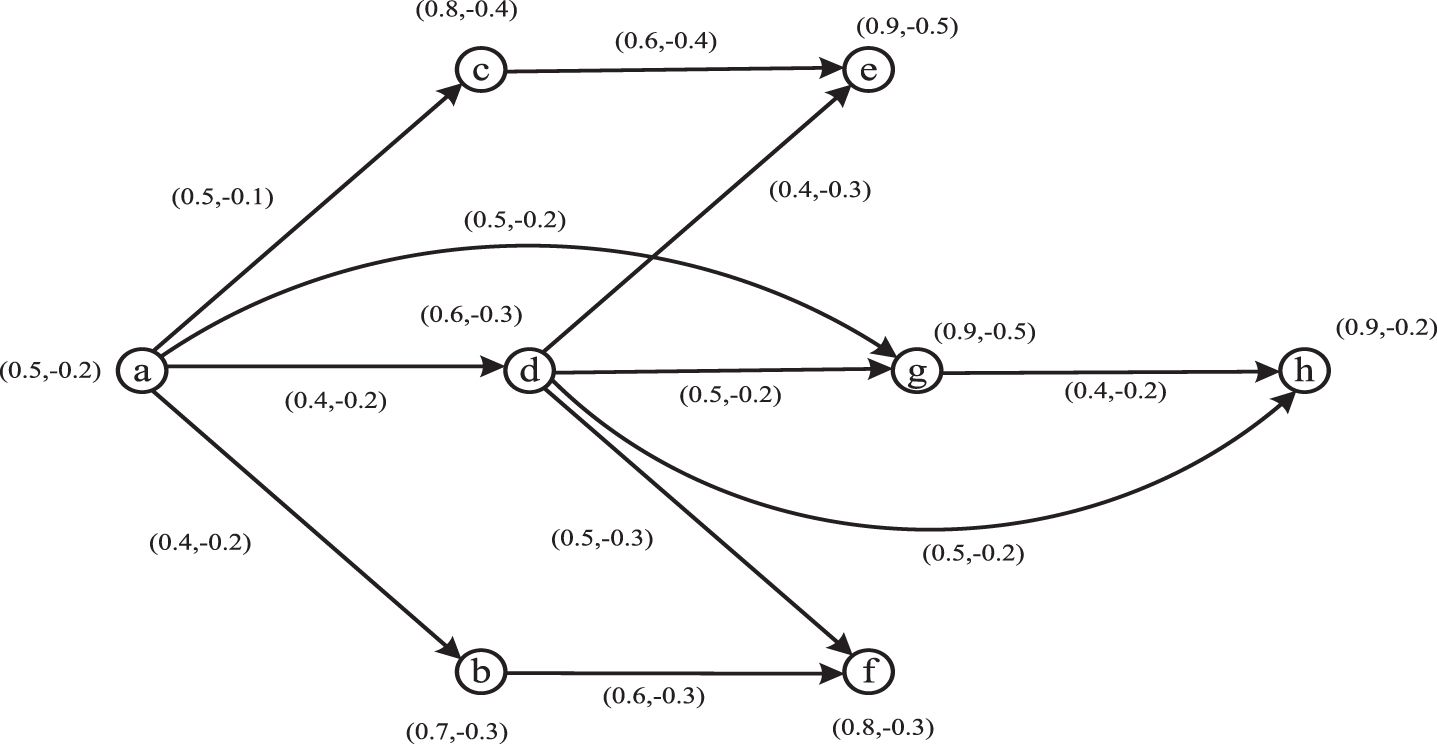
Bipolar fuzzy digraph.
Direct relation matrix
Bipolar fuzzy out-neighbourhood
Bipolar fuzzy in-neighbourhood
Bipolar fuzzy competition graph.
Bipolar fuzzy common enemy graph.
This part gives the applications of BFCG, BFCEG and BFCCEG. In the situation where BFCG has many competitions, the best BFCG is defined to depict the topmost competition of the vertices.
Nowadays, many mobile networks are available in our country and people often change their mobile networks depending on their service. Here, the decision-making problem on mobile networks is taken. The BFDG is designed with unknown mobile network and they are represented as a digraph with the bipolar fuzzy environment. There is a chain connection between the different networks. Let
BFS plays an important role in many decision-making models. A network digraph is designed with bipolar fuzzy values. In the vertices (Networks), the positive value denotes their subscribers and the negative value denotes their haters. At the bipolar value of edges, the positive value denotes the network changers and the negative value represents subscribers.
Bipolar fuzzy competition graph (BFCG) in networks
Let
Consider V ={ N1, N2, … N10 } be the vertex set of BFDG. The positive membership value of each network is obtained by their subscribers, internet speed, voice call connectivity speed, lag-free tower, costing, etc., The negative membership value is obtained by their haters, slow internet, poor voice call connectivity, lagging tower, costing, etc.
Suppose the membership value of N1 is (0.50, - 0.30), which means the network N1 is 50%strong based on its subscribers’ amount, overall network performance and 30%weak because of its haters, overall network drawbacks. The directed edge among the vertices N1 and N2 have the value of membership (0.50, - 0.05) which signifies that 50%of people change their network from N1 to N2and 5%of people return from N2 to N1 based on their performances and costs. The BFDG is depicted in Fig. 4.
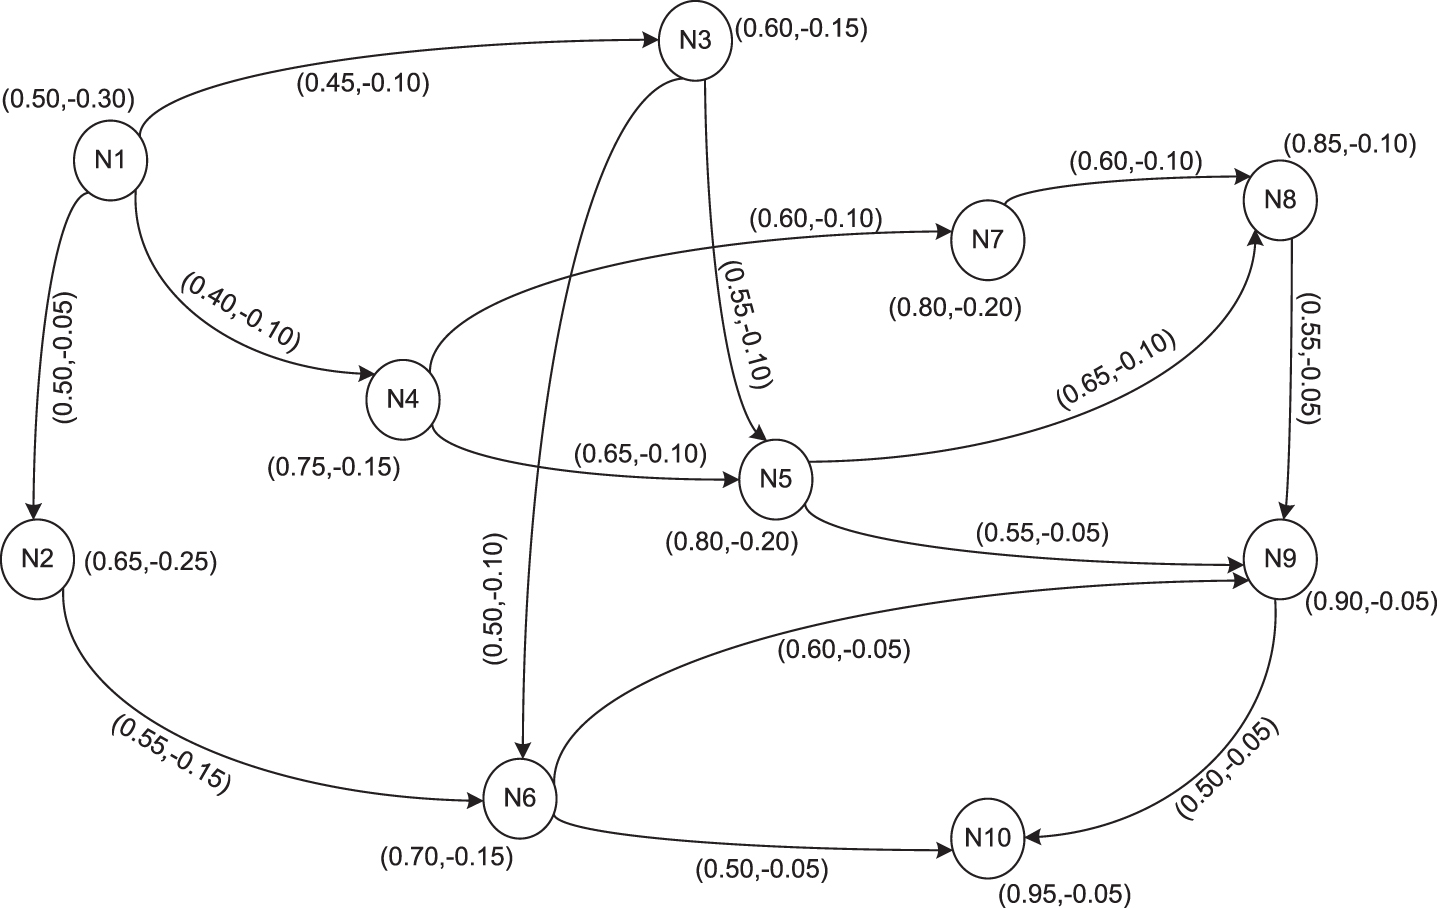
The Bipolar fuzzy digraph of networks.
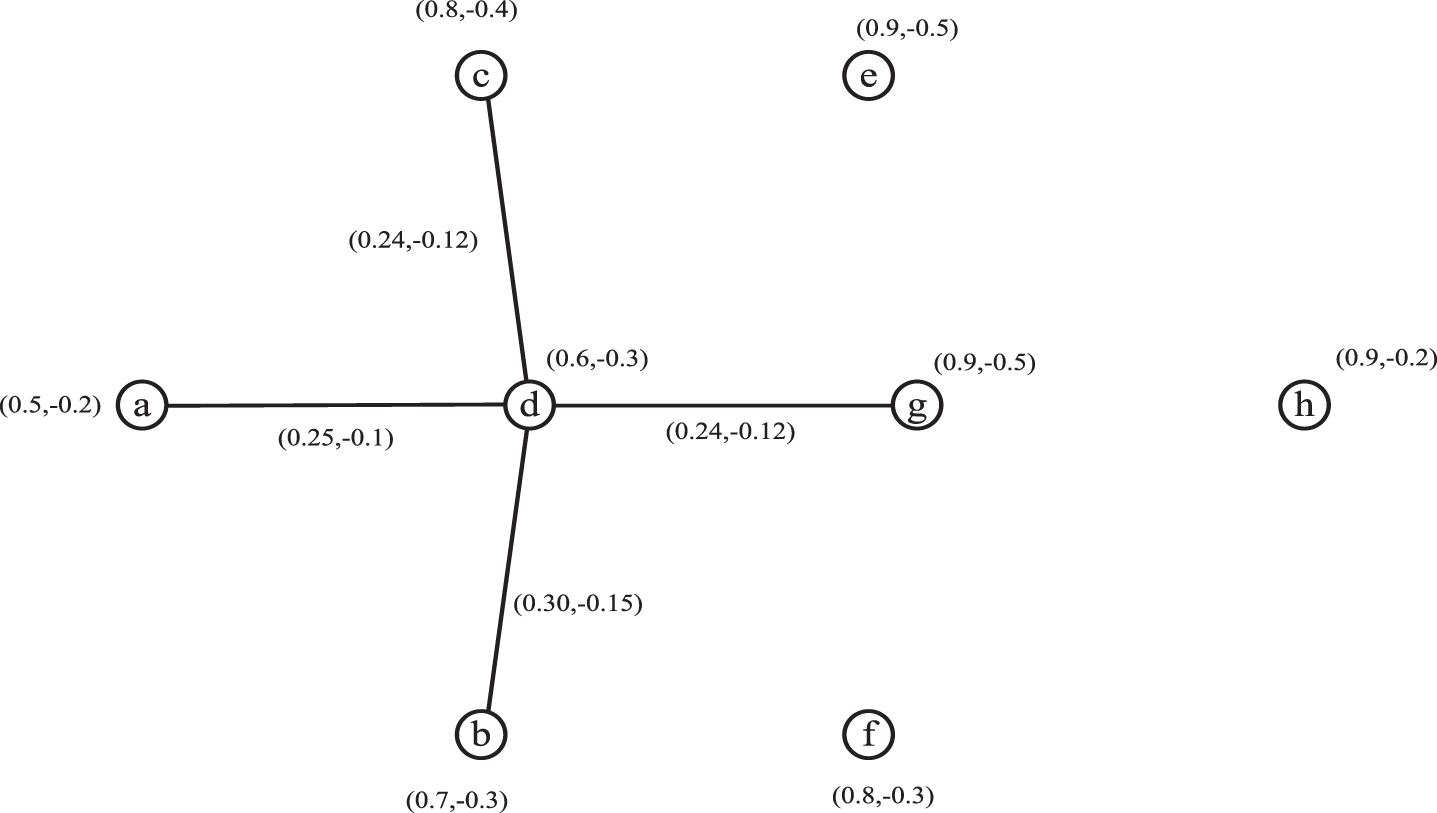
Using definition 7, the bipolar fuzzy in-neighbourhood is obtained which is given in Table 4. Then the BFCG is shown in Fig. 5.
The bipolar fuzzy in-neighbourhoods
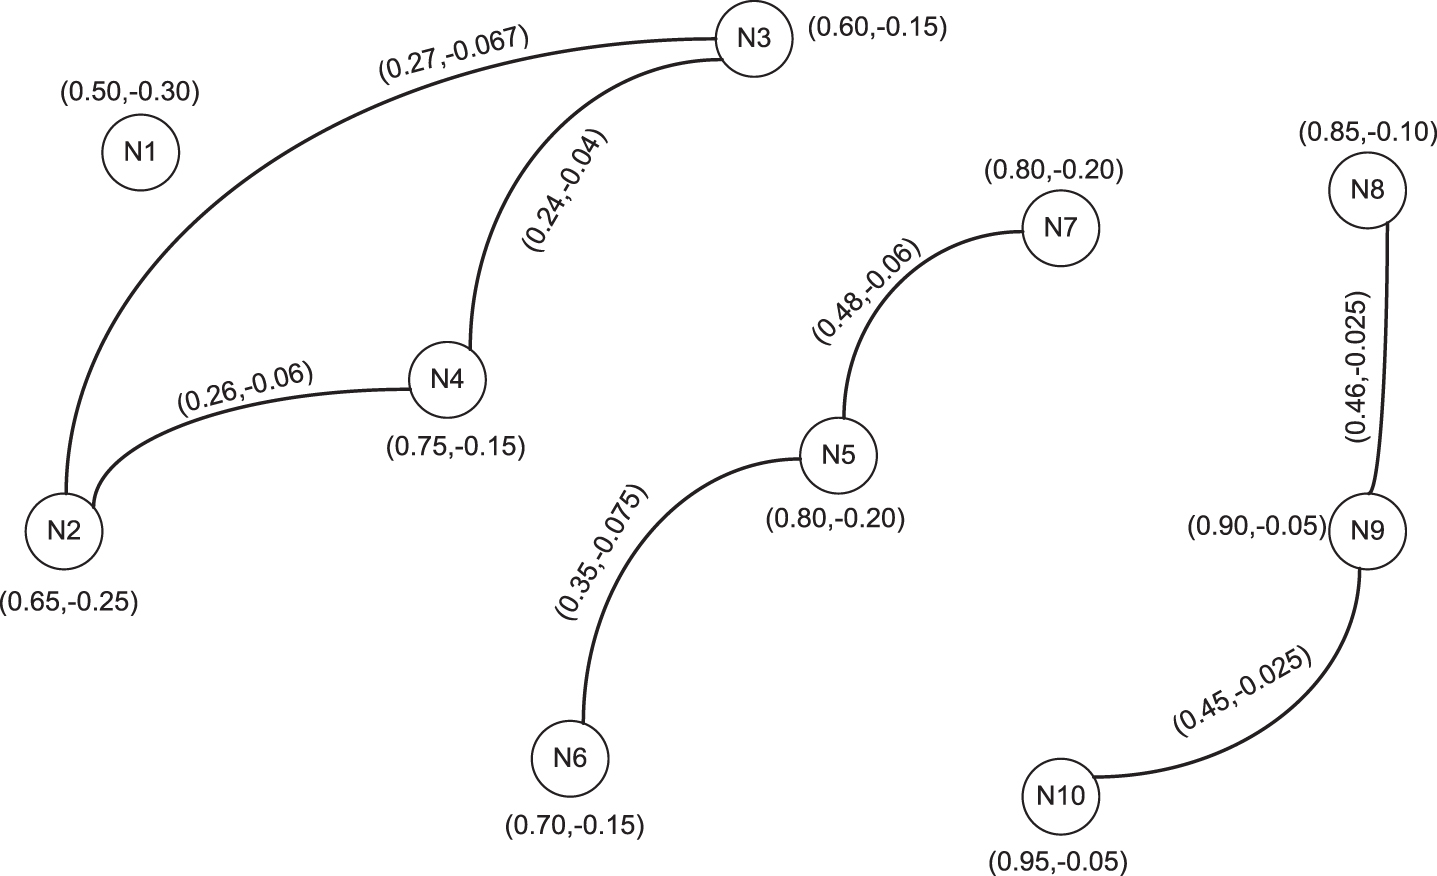
Bipolar fuzzy competition graph.
To determine the strength of the competition between two networks in the network system, the following algorithm [33] is derived.
Get any BFDG. Tabulate the BF in-neighbourhoods of all the vertices. Draw the BFCG Find the strength of competition among two networks f and g, if there is N- (f)∩ N- (g) ≠ ∅.
Using the above algorithm, the strength of the competition among two networks x and y are obtained and tabulated in Table 5.
Strength of the competition between networks
The highest strength of competition between the networks is N9 and N10. Therefore, the strongest competition between the networks N9 and N10 depends on their benefits and drawbacks. Here, this present study proposes definitions to compute the strength of individual vertex in the BFCG.
To determine the strongest competition in a competition of Fig. 5, definition 12 is used. Table 6 shows the strength of the individual networks and the strongest competitor in a competition.
Strength competitor network in competition graph
A BGCEG of
Let
Table 7 shows the bipolar fuzzy out-neighbourhoods.
The bipolar fuzzy out-neighbourhoods
The bipolar fuzzy out-neighbourhoods
An algorithm to find the network strength of common enemies in the network system is given below,
Get any BFDG. Tabulate the BF out neighbourhoods of all the vertices. Draw the BFCEG G = (V, S) using 4.1. Find the strength between common enemies l and m, if there is N
o
(l)∩ N
o
(m) ≠ ∅.
To find the strength of the competition among two networks l and m, the above algorithm-2 is used and it is shown in Table 8.
Strength of common enemy networks
The BFCEG is shown in Fig. 6.
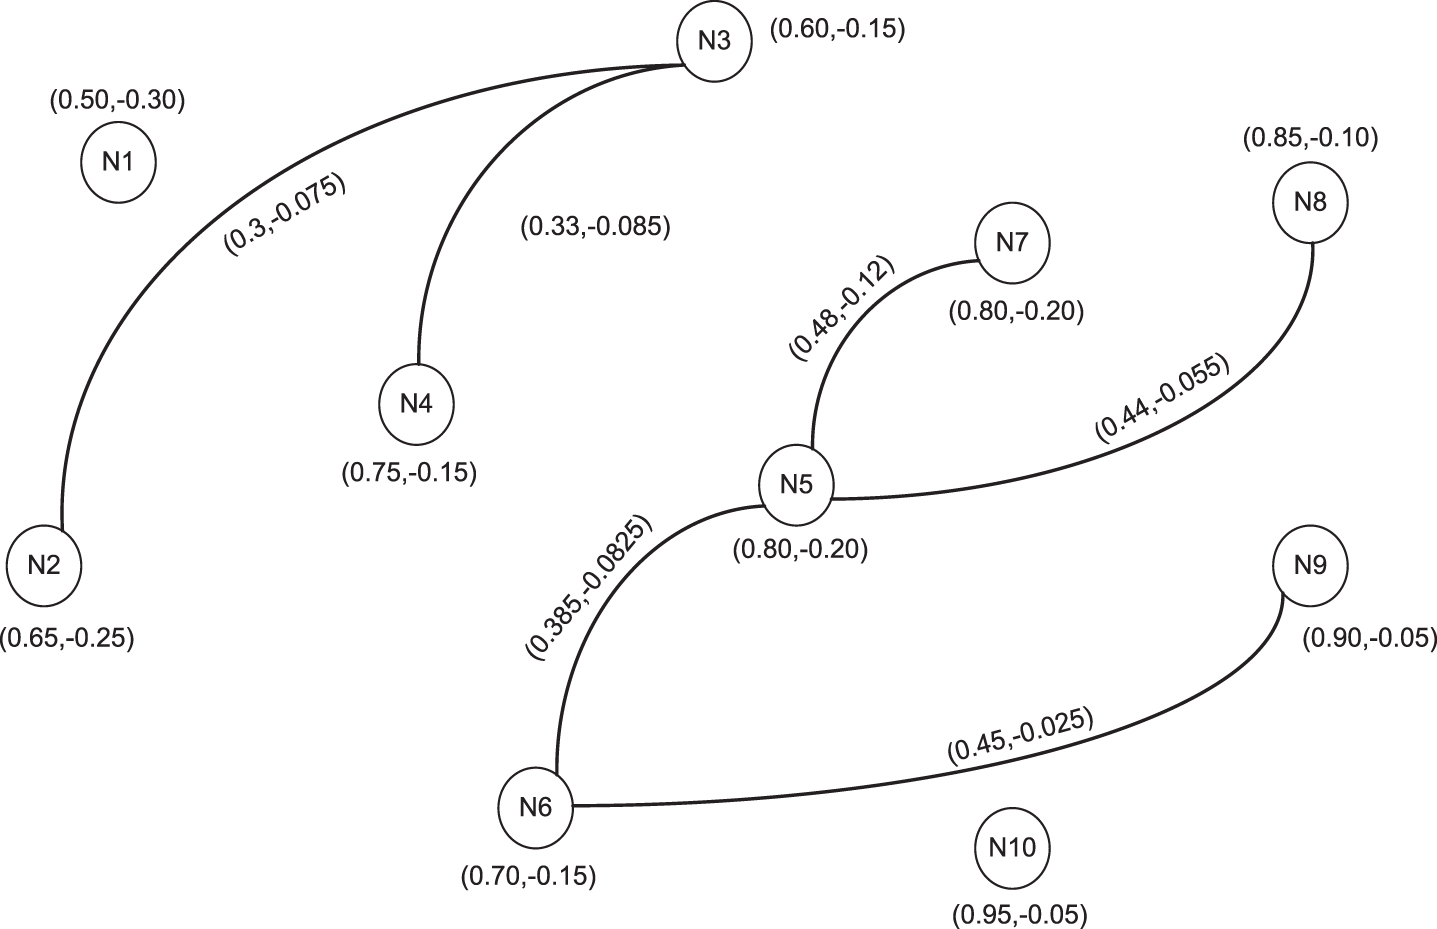
Bipolar fuzzy common enemy graph.
In the BFCEG, the networks N6 and N9 have a strong common enemy link.
BFCCEG of
Let
In BFCCEG, N2-N3, N2-N4, N3-N4, N5-N6 and N5-N7 are the competition as well as common enemy networks.
The degree of every network in competition and common enemy networks can be found by the Equation (4) [33],
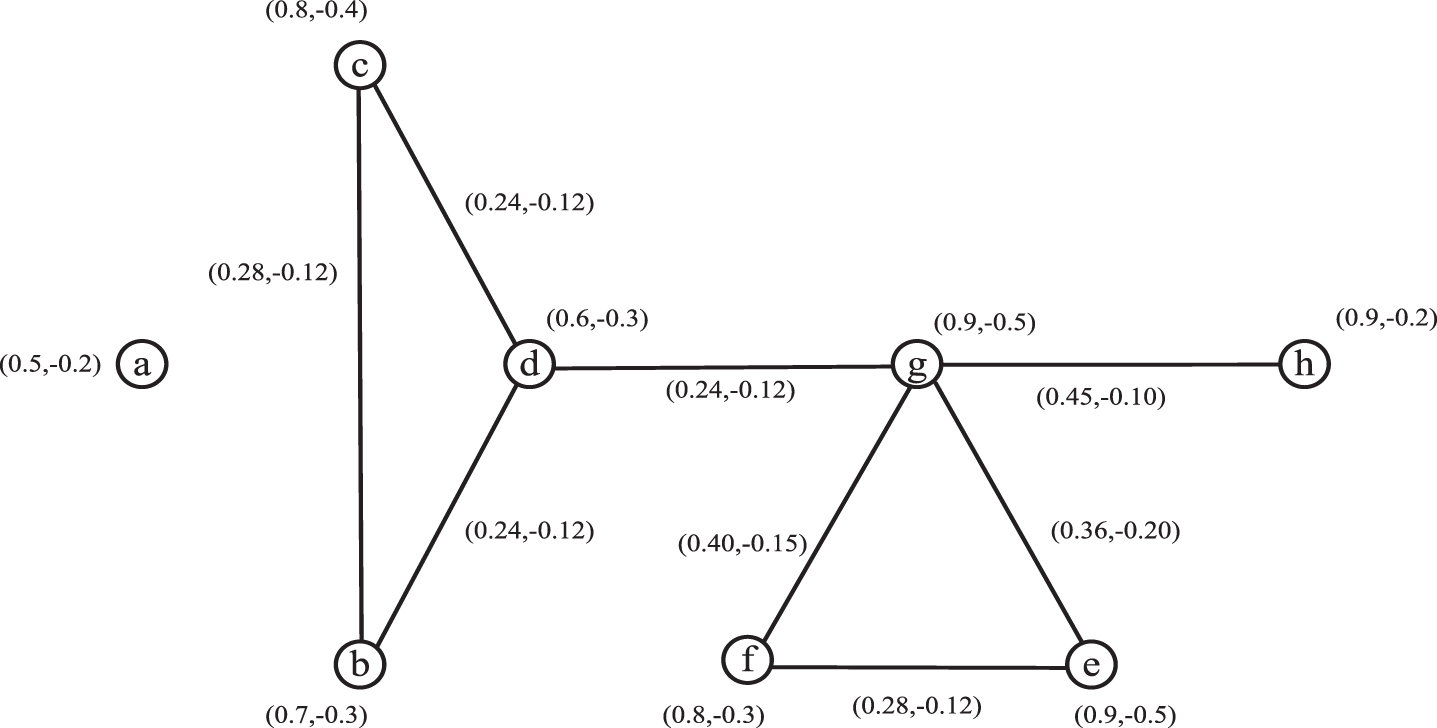
The BFCCEG is shown in Fig. 7.
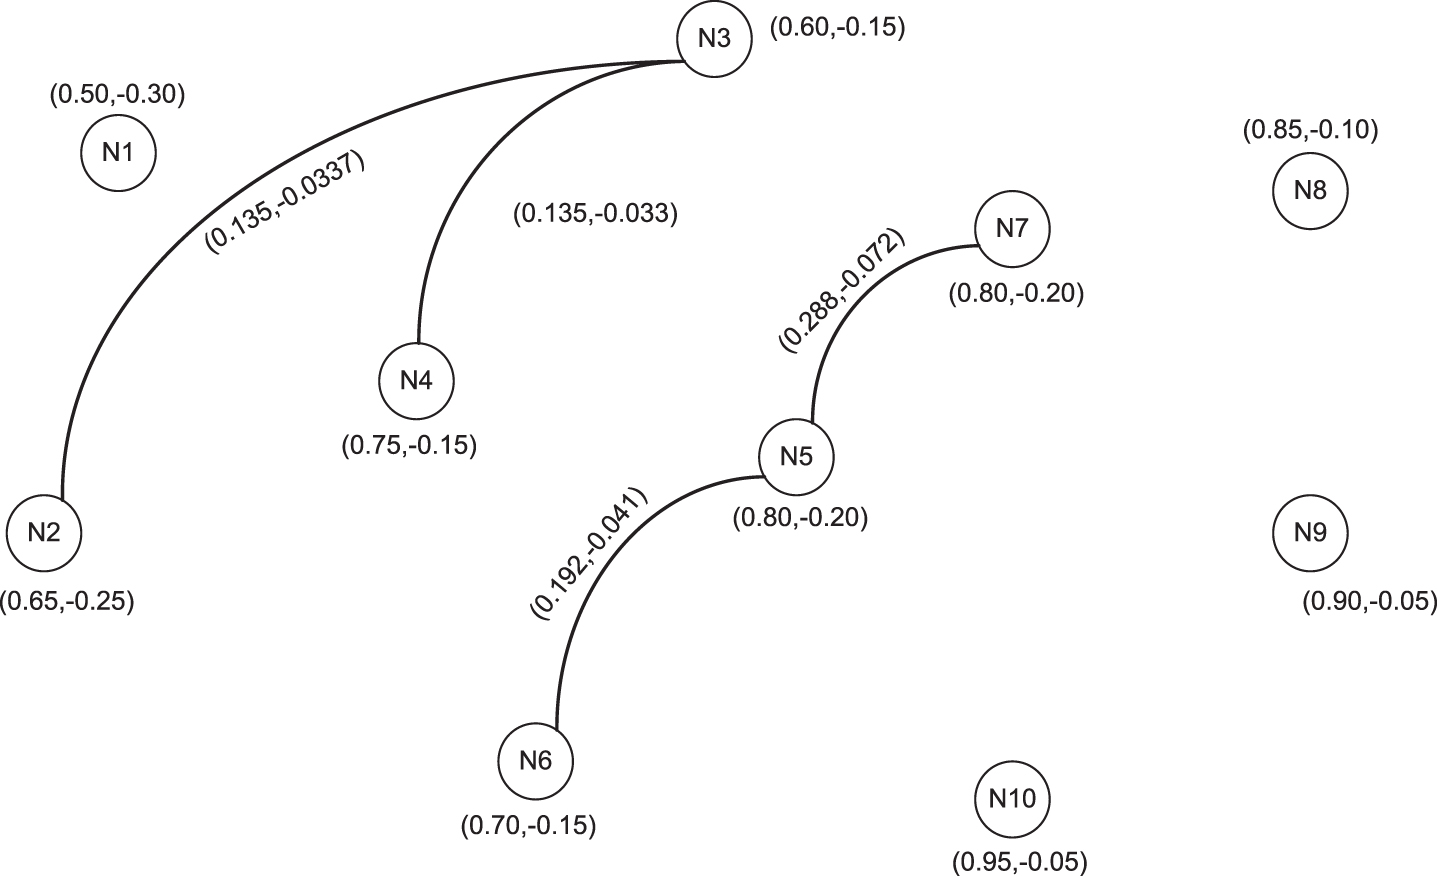
Bipolar fuzzy competition common enemy graph.
This study proposes a novel technique to detect the best competitions of a competition graph using the bipolar fuzzy α-cut method.
To depict the topmost competitions of the vertices within
The average bipolar values of an edge in
Average bipolar fuzzy values of edges
The main aim of the proposed definition is to determine the best competitions among the competitions using the bipolar fuzzy α-cut method. This concept helps to identify the best competitions among many competitions of the BFCG where we have to set the range of the bipolar values. For instance, the average bipolar fuzzy set is given in Table 9 where the goal is to cut the positive value above 0.55 and the negative value below –0.85. Using the bipolar fuzzy α-cut, the best competitions are obtained.
If = (α1, α2) = (0.5500, - 0.8500) is taken, then
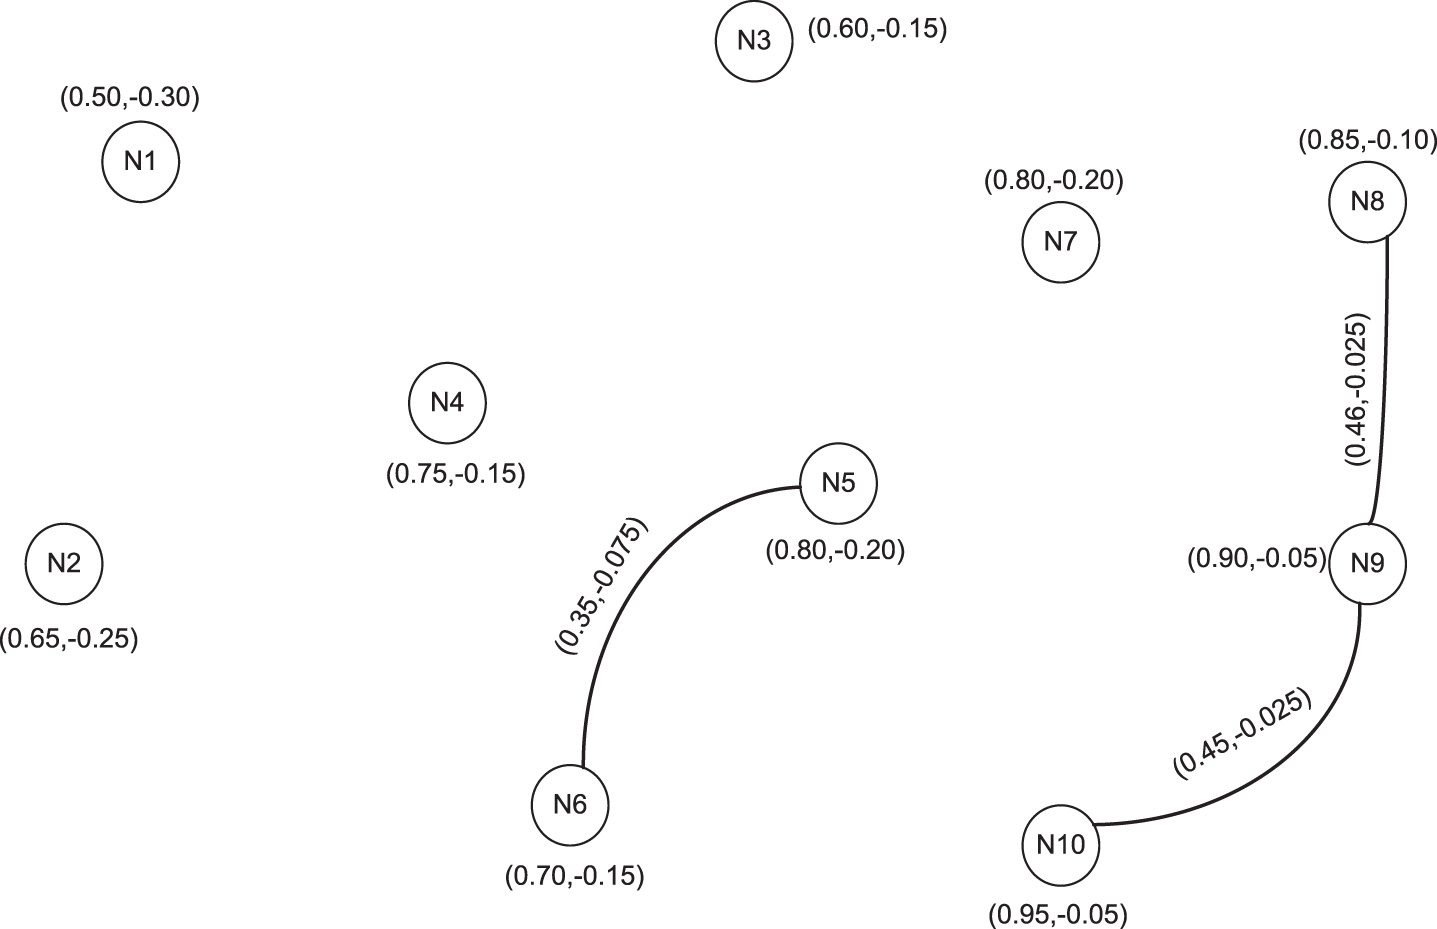
Best bipolar fuzzy competition graph.
This graph (Fig. 8) helps to find the best competition networks in the competition network graph. Here N5 - N6, N8 - N9, N9 - N10 are the best competitions. N2 - N3, N2 - N4, N3 - N4, N5 - N7 are not contained in the best level of competition. Generally, if there is n- number of competitions in a competition graph, then this method helps to detect the best competitions.
In this part, the DEMATEL method is constructed under a bipolar fuzzy environment. Next, a numerical illustration of the proposed technique is given.
Construction of proposed technique
Where N = (N
p
, N
n
),
Here,
The overall intensity of influencing vertices is defined as,
Let
The intensity of influenced vertices is defined as,
Let
Prominence:
Relation:
The flow chart of the proposed method is given in Fig. 9.
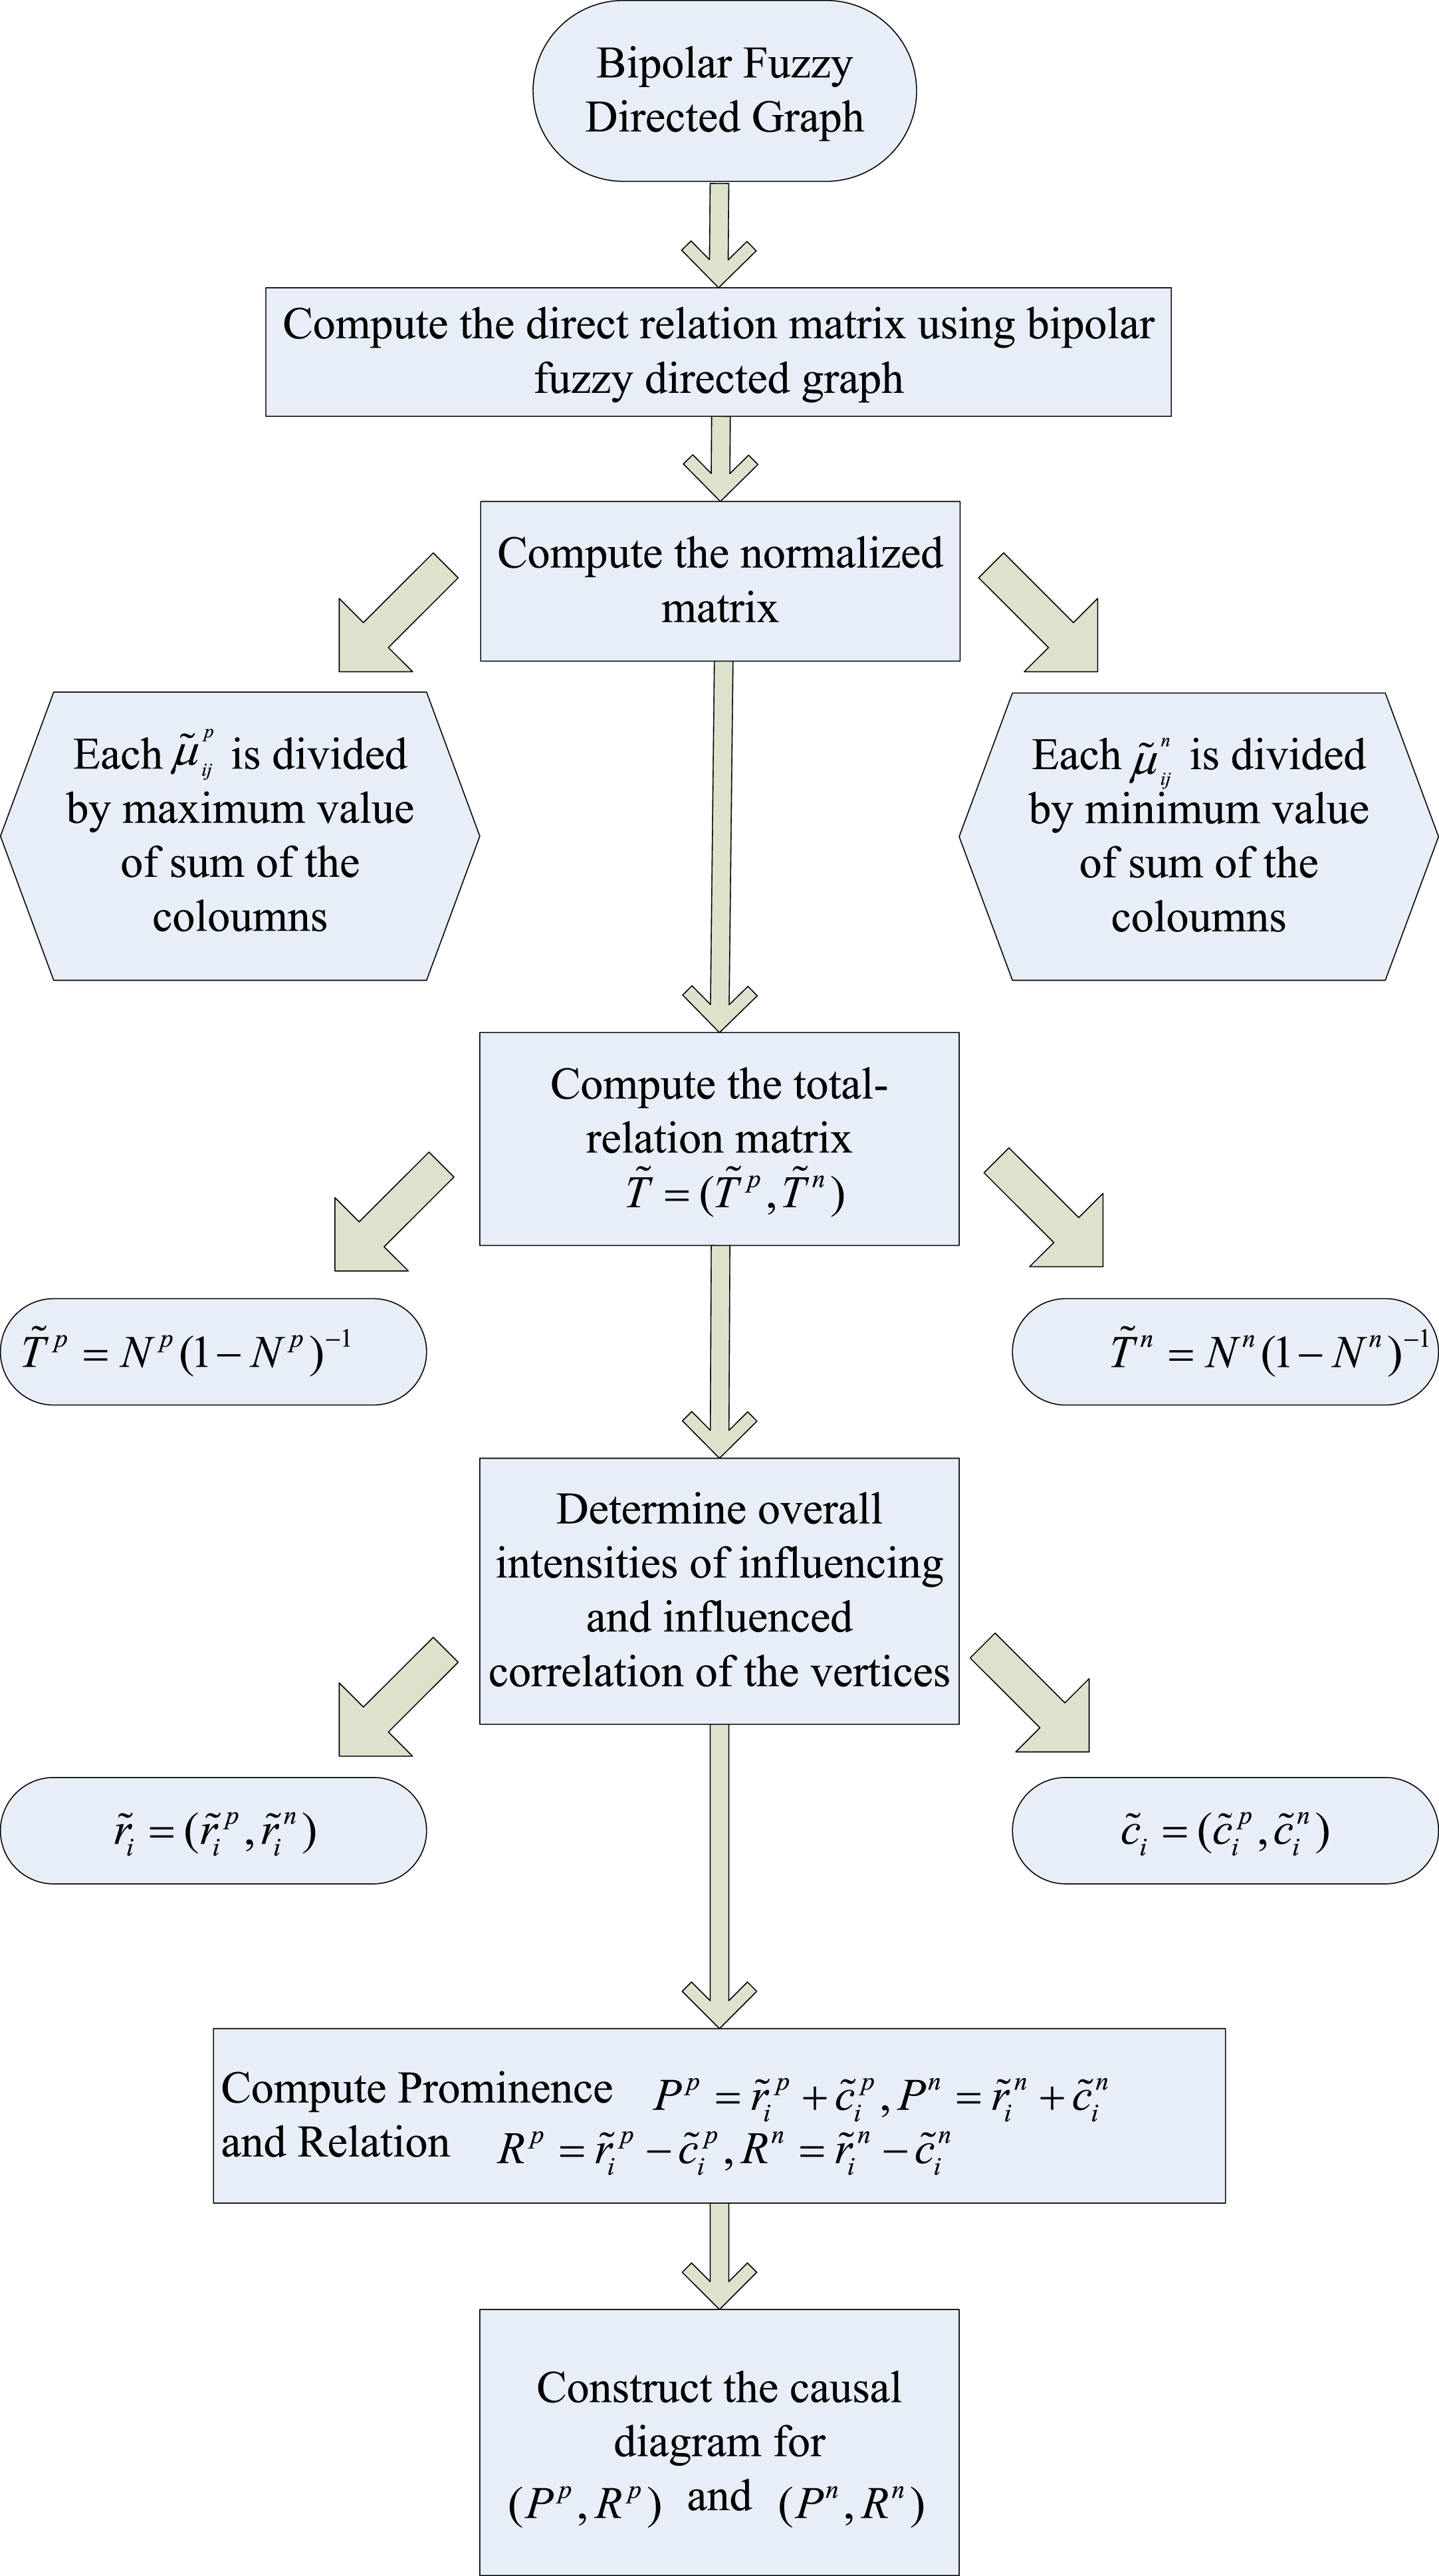
Flow chart of bipolar fuzzy DEMATEL method.
To illustrate the bipolar fuzzy DEMATEL method, the network (Fig. 4) is taken.
At step 1, the direct relation fuzzy bipolar matrix (Table 10) is obtained from Fig. 4.
Direct relation bipolar matrix
Direct relation bipolar matrix
At step-2, the value of the bipolar normalized matrix is calculated (Table 11).
Bipolar normalized matrix
The value of the bipolar total-relation
Bipolar total–relation matrix
Overall intensity of influencing vertices
The overall intensity of the influenced networks is
Overall intensity of influenced vertices
At step 5, the prominence
Prominence matrix of P p and P n
Ration matrix of R p and R n
In step 6, the points of (P p , R p ) and (P n , R n ) are tabulated in Tables 17 18.
The values of (P p , R p )
The values of (P n , R n )
Finally, the causal diagrams are visualized for (P p , R p ) and (P n , R n ). It is shown in Figs. 10 11.
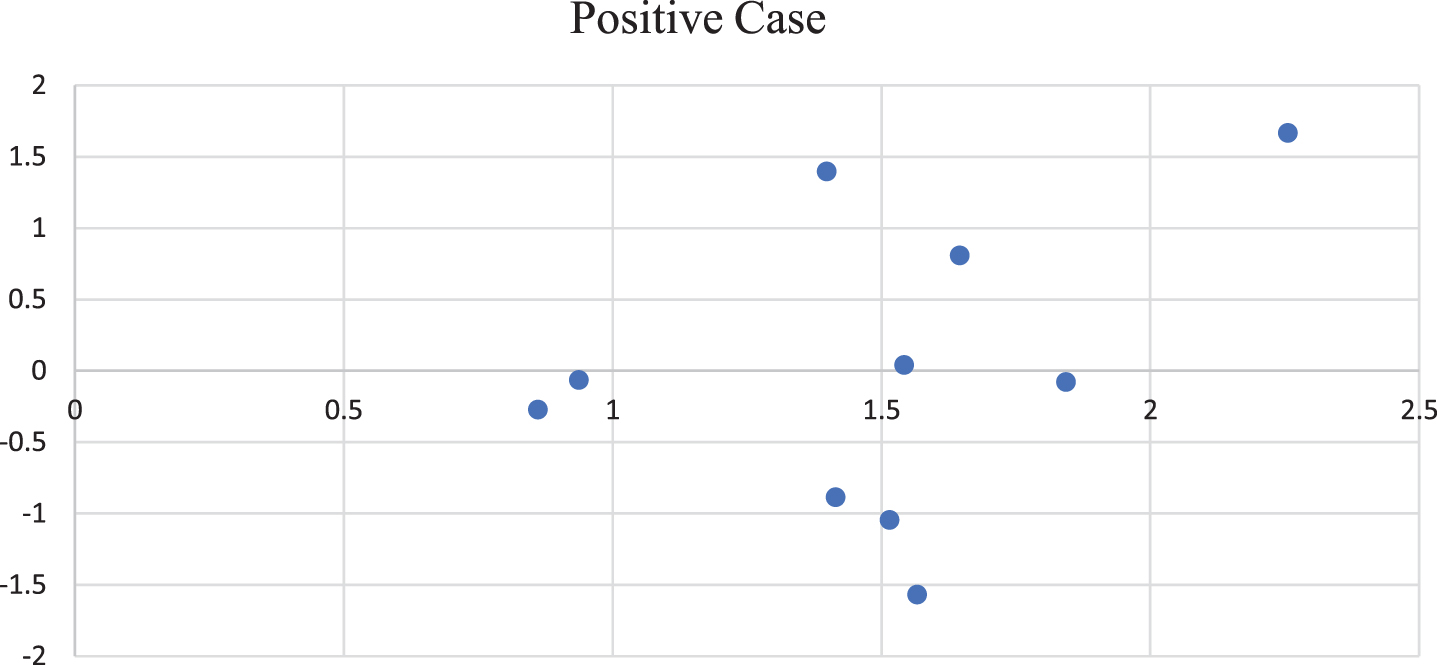
Causal diagram of (P p , R p ).
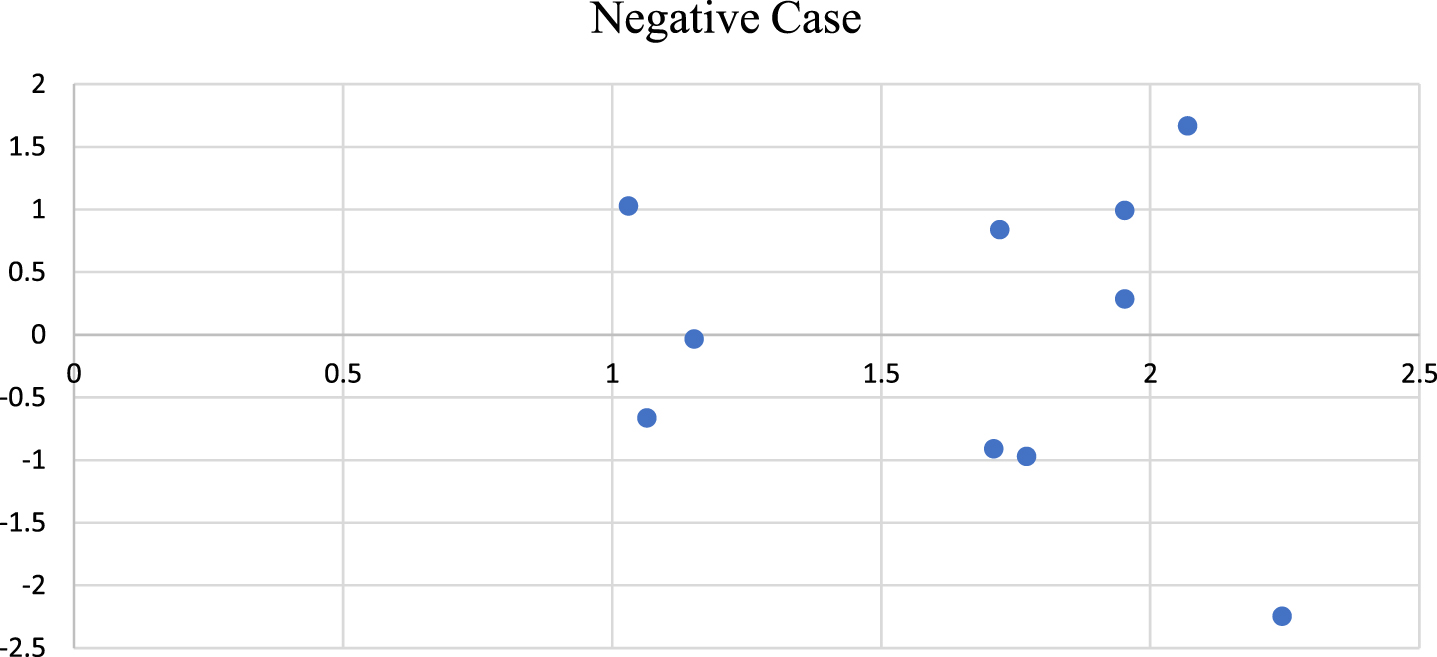
Causal diagram for (P n , R n ).
In the causal diagram, the positive quadrant is considered as a cause group and the negative quadrant is considered as an effect group. These groups play a vital role for the network’s benefits and drawbacks. The causal diagram of (P p , R p ) divides the vertices into cause group which includes N9 > N8 > N6 > N10 and the effect group which consists of N5 > N1 > N4 > N3 > N7 > N2.
The causal diagram of (P n , R n ) divides the vertices into cause group which includes N9 > N8 > N5 > N6 > N10 and effect group which consists of N1 > N4 > N3 > N7 > N2.
The following things are observed from the causal diagram,
In the positive case, by perceiving the (Fig. 10), the networks N6, N8, N9, N10 belongs to the cause group because the values
Hence, by comparing the networks in the effect group with networks of the cause group, the networks of the cause group are better in their service. In the negative case, according to (Fig. 11), the networks N5, N6, N8, N9, N10 belongs to the cause group as the values of
For the positive case, comparing the strength of competition networks (Table 5), the highest strength is between N9 and N10. So, the networks N9 and N10 are contained in the cause group. The lowest strength is between N2 and N3 and they are contained in the effect group. The negative case comparing with the strength of common enemy networks represented in Table 8, it is observed that the networks N6 and N9 are in the cause group because the highest strength is between N6 and N9. The lowest strength is between N2 and N3 and they are in the effect group.
A comparative analysis is done between the classical DEMATEL, fuzzy DEMATEL and the bipolar fuzzy DEMATE methods and the following table is derived.
From Table 19, it is observed that for the classical DEMATEL method the adjacency value of two vertices is 1 if they are adjacent, otherwise 0. For instance, the values are assigned to the relation of the vertices are 1 when high or 0 when low. Using the crisp value, the causal diagram is depicted and the cause-effect group is obtained.
Comparative analysis
Comparative analysis
When it was found that the relations are not always crisp and the uncertainty arises on the relation between two vertices, the fuzzy DEMATEL method was developed. For instance, the values are assigned to the relation of the vertices between 0 to 1. The evaluation is done with the linguistic terms and the linguistic terms are assigned the values by fuzzy numbers. The causal diagram is portrayed to classify the cause and effect group of the factors. Here, the networks N6, N8, N9, N10 are the cause group and N1, N2, N3, N4, N5, N7 are the effect group.
From the above two cases, the values are obtained in the positive sense. When both positive and negative senses are considered for any problem, bipolar thinking arises. Based on the bipolar thinking, the concept of bipolar fuzzy situation is adopted. The DEMATEL is designed under bipolar fuzzy environment. In this case, the values of the relation between vertices are assigned the positive membership values from [0, 1] and the negative membership values from [-1, 0]. Using the bipolar fuzzy DEMATEL method, the causal diagram is depicted for both the positive and negative grade.
For the positive grade, the cause group consists of networks N6, N8, N9, N10 and the effect group consists of the networks N1, N2, N3, N4, N5, N7. For the negative grade, N5, N6, N8, N9, N10 are in cause group and N1, N2, N3, N4, N7 are in effect group. In this method, it is observed that vertex N5 is contained in the cause group for the positive sense and the effective group for the negative sense. From this proposed study, it is observed that the network N5 has both benefits and drawbacks. Therefore, this method is considered to be more effective when it provides the results for both positive and negative values.
A bipolar fuzzy graph plays an energetic role in several research fields and it gives more flexibility and compatibility to the problems when it is modelled through the bipolar fuzzy graph. A bipolar fuzzy set is an extension of a fuzzy set with extra prospects to deal with the vagueness and uncertainty that occur in real-time problems. In this article, the DEMATEL method is designed under the bipolar fuzzy environment to analyze the mobile network problem. Moreover, this study has discussed some applications of bipolar fuzzy competition graphs and bipolar fuzzy competition common enemy graphs with unknown mobile networks. This present study also proposed a method to find the best competitor of competitions. Also, designed a method to find the best bipolar fuzzy competition graph using α-cut and plotted the best bipolar fuzzy competition graph. The methods presented in this study can be further stretched to bipolar fuzzy p-competition graph bipolar fuzzy competition hypergraphs bipolar anti-fuzzy competition graphs bipolar intuitionistic fuzzy competition graphs bipolar intuitionistic anti-fuzzy competition graphs.