
Abstract
Cervical cancer is one of the most common causes of death in women in the world, and early screening is an effective means of diagnosis and treatment, which can greatly improve the survival rate. Cervical cell classification model is an effective means to assist screening. However, the existing single model, including CNNs and machine learning methods, still has shortcomings such as unclear feature meaning, low accuracy and insufficient supervision. To solve the shortcomings of a single model, a novel framework based on strong feature Convolutional Neural Networks (CNN)-Lagrangian Support Vector Machine (LSVM) model is proposed for the accurate classification of cervical cells. Strong features extracted by hybrid methods are fused with the abstract ones from hidden layers of LeNet-5, then the fused features are processed with dimension reduction and fed into the LSVM classifier optimized by Adaboost for classification. Proposed model is evaluated using the augmented Herlev and private dataset with the metrics including accuracy (Acc), sensitivity (Sn), and specificity (Sp), which outperformed the baselines and state-of-the-art approaches with the Acc of 99.5% and 94.2% in 2&7-class classification, respectively.
Keywords
Introduction
As the fourth common cause of female death, cervical cancer has brought great harm to the health of women in the world [1]. Over 85% of the cervical-related diseases happen in developing or underdeveloped countries due to poor sanitation and economic conditions [2]. While this cancer can be treated if it is detected by early screening. Traditional pathological detection relies on doctors to conduct the smear-level examination with microscope, whose accuracy heavily depends on subjective experience of staff and brings great work pressure [3]. Therefore, an accurate and efficient cervical cell classification approach is strongly needed with the development of image process and deep learning.
As shown in references [4–9], various cervical cell classification approaches have been proposed. Machine learning methods mainly depend on feature extraction, feature selection and classification. Mostly applied cell features are morphology, brightness, color, texture and their combinations, as given in literature [9–13]. SVM and its improved versions widely serve as classifiers in cell classification. Wei et al. [14] extracted the texture feature information of cancerous cells by gray level co-occurrence matrix (GLCM), and then realized the recognition of cervical cancer by SVM. This provides a basis for subsequent research. Abdollahi H. et al. [15] developed models based on magnetic resonance imaging (MRI) radiomic features and LSVM algorithm to predict early intensity-modulated radiation therapy (IMRT) response. Least square support vector machine (LSSVM) was introduced to replace the softmax layer of CNN by [16] and conducted the classification, which obtained good results and inspired the proposed model. Kashyap D. et al. [17] proposed an automatic method to classify the grades of cervical cancer using geometric and texture features with multi SVM, whose accuracy of 95% outperformed most similar models. Wu et al. [18] compared the combining method of support vector machine-recursive feature elimination and support vector machine-principal component analysis to obtain the optimal model for cell classification, which denoted the superiority of hybrid approach with an accuracy of 92.46%. An ensemble classifier is proposed using LSSVM, MLP and Random Forest by Bora et al. [7] and surpassed other methods on Herlev dataset with the accuracy of 96.51%. Mulmule et al. [19] studied 163 features such as texture and morphology of cancerous cells. Then, three classifiers, including artificial neural network ANN, support vector machine SVM and random forest RF, were used to detect and classify early cancer cells, and the final accuracy was up to 97.5%. Although SVM and other classification algorithms continuously achieve better detection results, their models are still limited by the selection of artificial features. All these factors lead to great uncertainties and limitations in the model.
More models based on deep learning are applied with the progress in computation power, various neural networks [20–22] have been introduced for the cell classification and immunological state monitoring [23]. Azian et al. [3] proposed an improved CNN using combining templates to detect the Pap smear images with an accuracy of 88%. Sanyal [24] uses two CNN models with different training cycles to test on private datasets, and achieves good detection results. The negative predictive value even reached 99.19%, which proved that CNN has great potential in the detection of cervical cancer cells. Pre-processed TCGA data were fed into the VGG16-CNN for classification by Idlahcen et al. [25], an accuracy of 98.26% confirmed the potential of transfer learning. Chen et al. [26] also introduced transfer learning on the basis of CNN model, and realized the detection of cervical cancer cells on the Herlev dataset. It also proves the feasibility of CNN model in small sample detection. Yue et al. [27] constructed a cervigram-based recurrent convolutional neural network (C-RCNN) to classify CIN grades on a dataset of 4,753 real cervigrams and obtained the accuracy of 96.13%. Kurnianingsih et al. [28] used a mask regional convolutional neural network (Mask R-CNN) to test on the Herlev dataset, which has a good detection effect. The classification accuracy of 7-class reached 95%. Subsequently, many researchers [29, 30] have improved the CNN algorithm and achieved good results in the classification of cervical cancer cells. However, in the process of feature extraction, CNN model may easily cause the loss of some potential information of the image. This will also affect the classification accuracy of the model. These are all unavoidable problems when using single CNN feature description. Researchers [31–34] developed the combining methods of CNN and SVM algorithm, which applied CNN for abstract feature extraction and input them into the SVM for classification. Hybrid models make full use of the extraction capacity of neural networks to obtain the cell semantic features and enhance the classification performance by replacing the softmax layer with SVM. Similar methods of CNN-SVM have been applied for classification of brain tumor [35, 36] and obtained an accuracy of 84%, which outperformed the state-of-the-art models. These successful results also provided direction for our research, which motivated our work to develop a fully automatic classification method based on convolutional neural network algorithm and support vector machine for the classification of cervical cells.
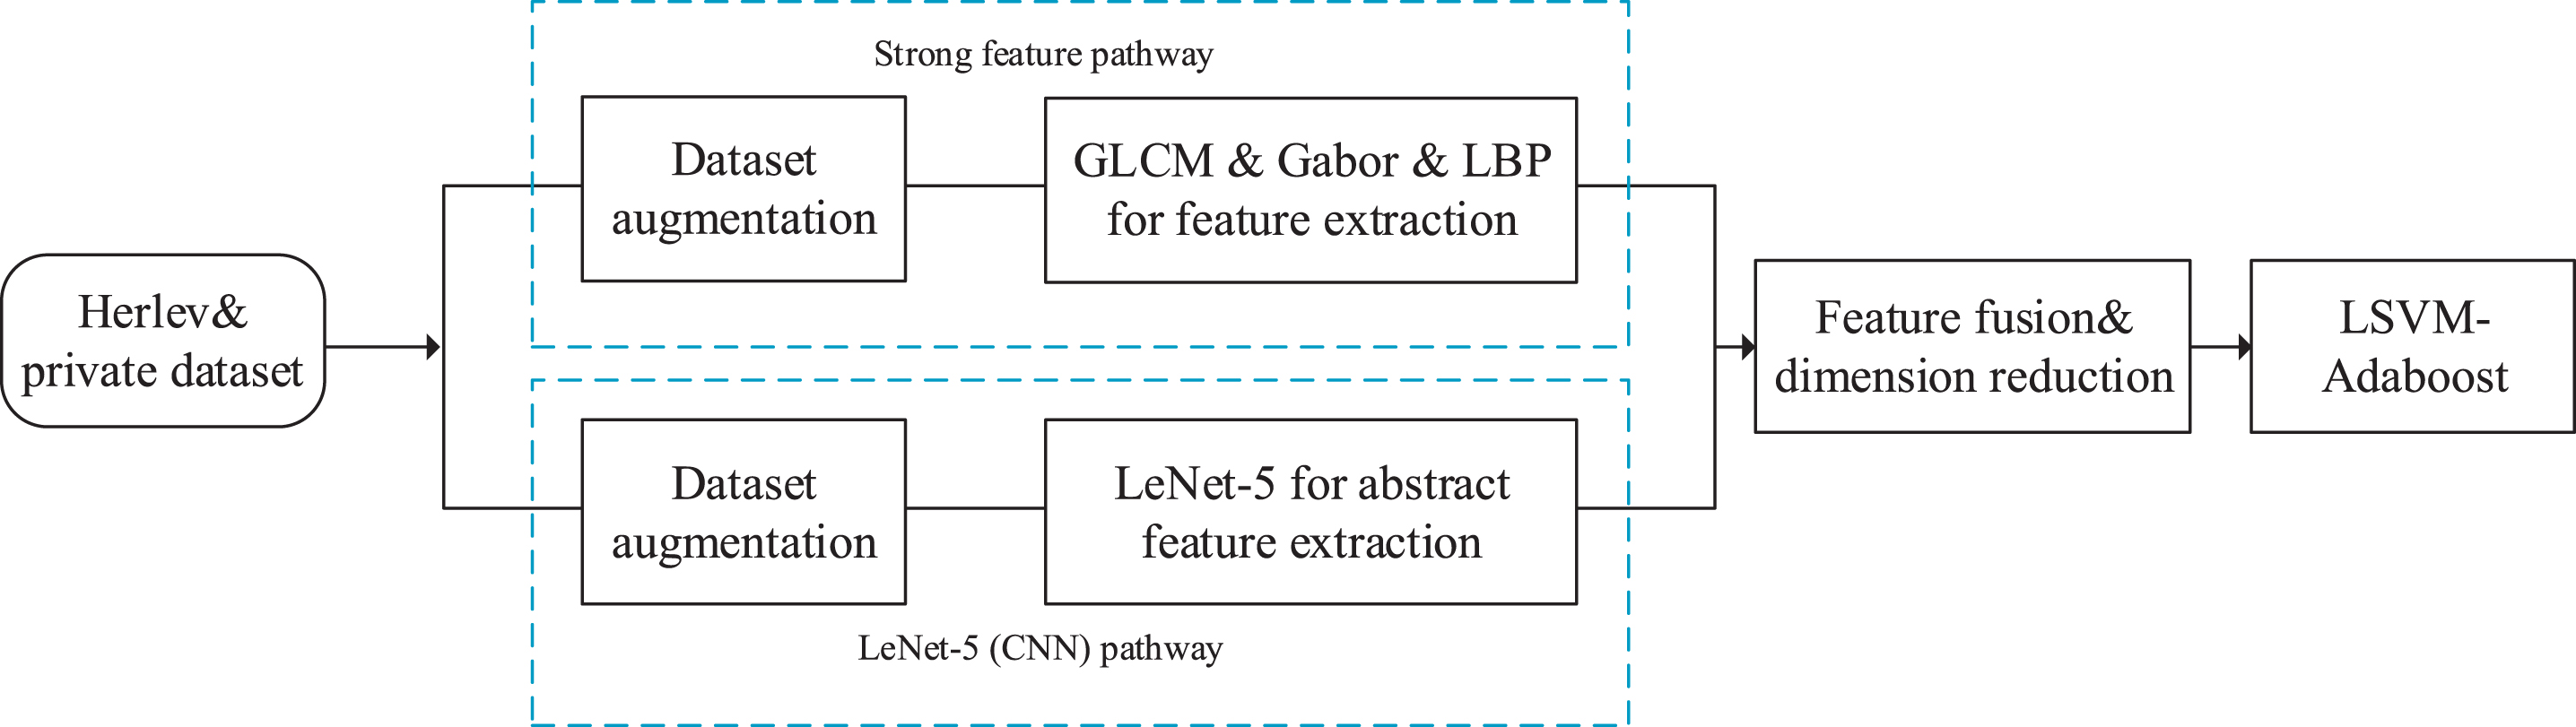
In this paper, a novel cervical cell classification method using strong feature CNN-LSVM model is proposed. The framework of this paper can be divided into two sections. Firstly, GLCM, Gabor and LBP are used to extract the strong features of the amplified dataset, and abstract high-dimensional features are extracted. In order to achieve accurate classification, strong features and CNN features need to be fused and dimensionality reduced, and finally the processed features are input to LSVM. Proposed model is compared with the baselines and state-of-the-art models using Herlev and private data sets, results showed that proposed method outperformed others in terms of accuracy, sensitivity, and specificity with the lower time complexity. This is the first attempt to conduct the cell classification using strong features and CNN-LSVM, which contributes to the improvement of classification in both accuracy and efficiency. The proposed workflow is shown in Fig. 1.
Workflow of the proposed method based on strong feature CNN-LSVM model. Herlev and private datasets are enhanced with a hybrid approach. It increases the robustness of model training and reduces the overfitting problem in model training. Strong features of amplified dataset are extracted using GLCM, Gabor and LBP according to the comparative experiment. Hidden layers of LeNet-5 are applied to obtain the abstract and high-dimensional features in order to overcome the problem of overfitting [37]. The strong features and CNN features are fused and processed by dimensionality reduction using Linear Discriminant Analysis (LDA), then they are fed into the LSVM with the Adaboost to achieve the cell classification.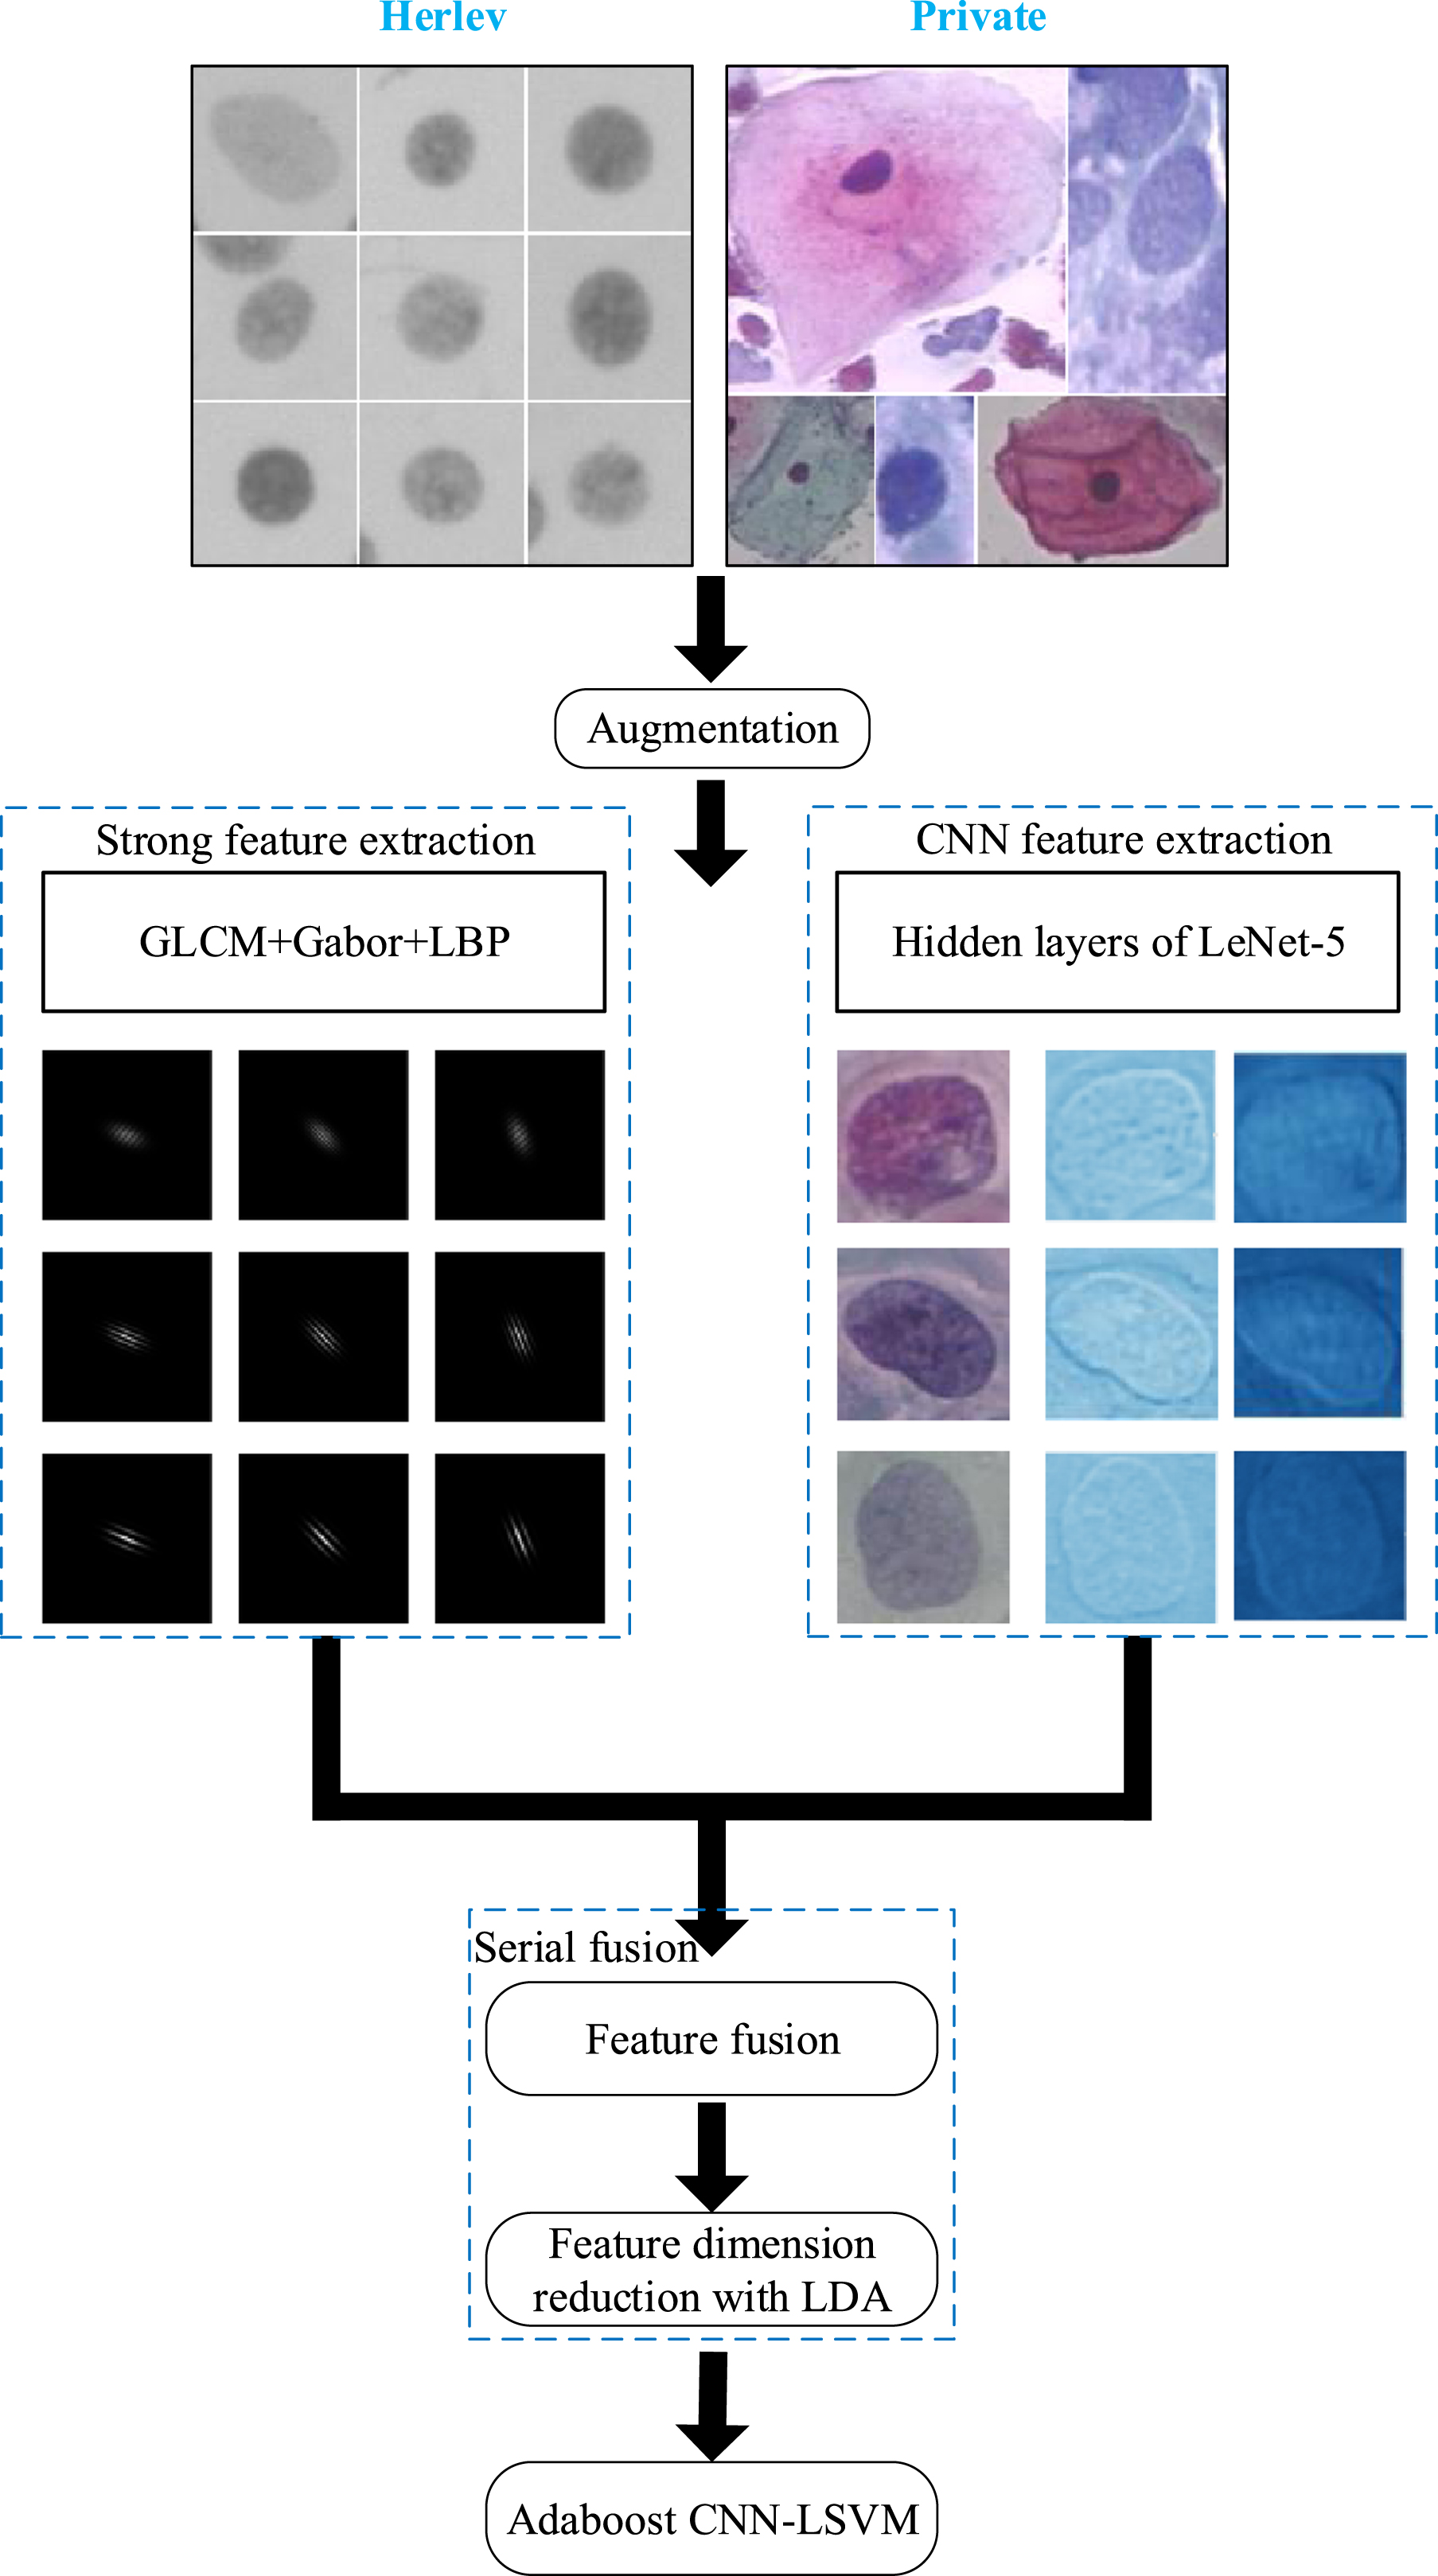
The paper is organized as follows. Section 2 gives the detailed preprocess for dataset. Proposed model is described in Section 3. Experimental results and analysis are provided by Section 4. Conclusions and future work are given in Section 5.
Dataset
Proposed method is conducted on two different datasets, Herlev and a private dataset. Cytoplasm and nuclear features from Herlev dataset are extracted, while for private dataset, our method directly operates on nuclei. Private dataset is collected using smear images by automatic segmentation from cooperative unit, Guangdong Province People’s Hospital. These two datasets are acquired by different staining conditions.
Herlev dataset
Publicly available dataset Herlev (http://mde-lab.aegean.gr/downloads) is acquired by Technical University of Denmark and Herlev University Hospital [38]. The resolution of smear images is 0.201um, there are 917 cell images in total from 7 categories with labels provided by pathologists. Category 1 to 3 are normal and category 4 to 7 belong to cancerous ones. Details of Herlev dataset is shown in Fig. 2 (a) and Table 1. Abnormal cells usually have higher nuclear-cytoplasmic ratio, while the exceptions bring more challenges for classification. Due to the lack and imbalance of cell samples in Herlev, dataset augmentation was applied.

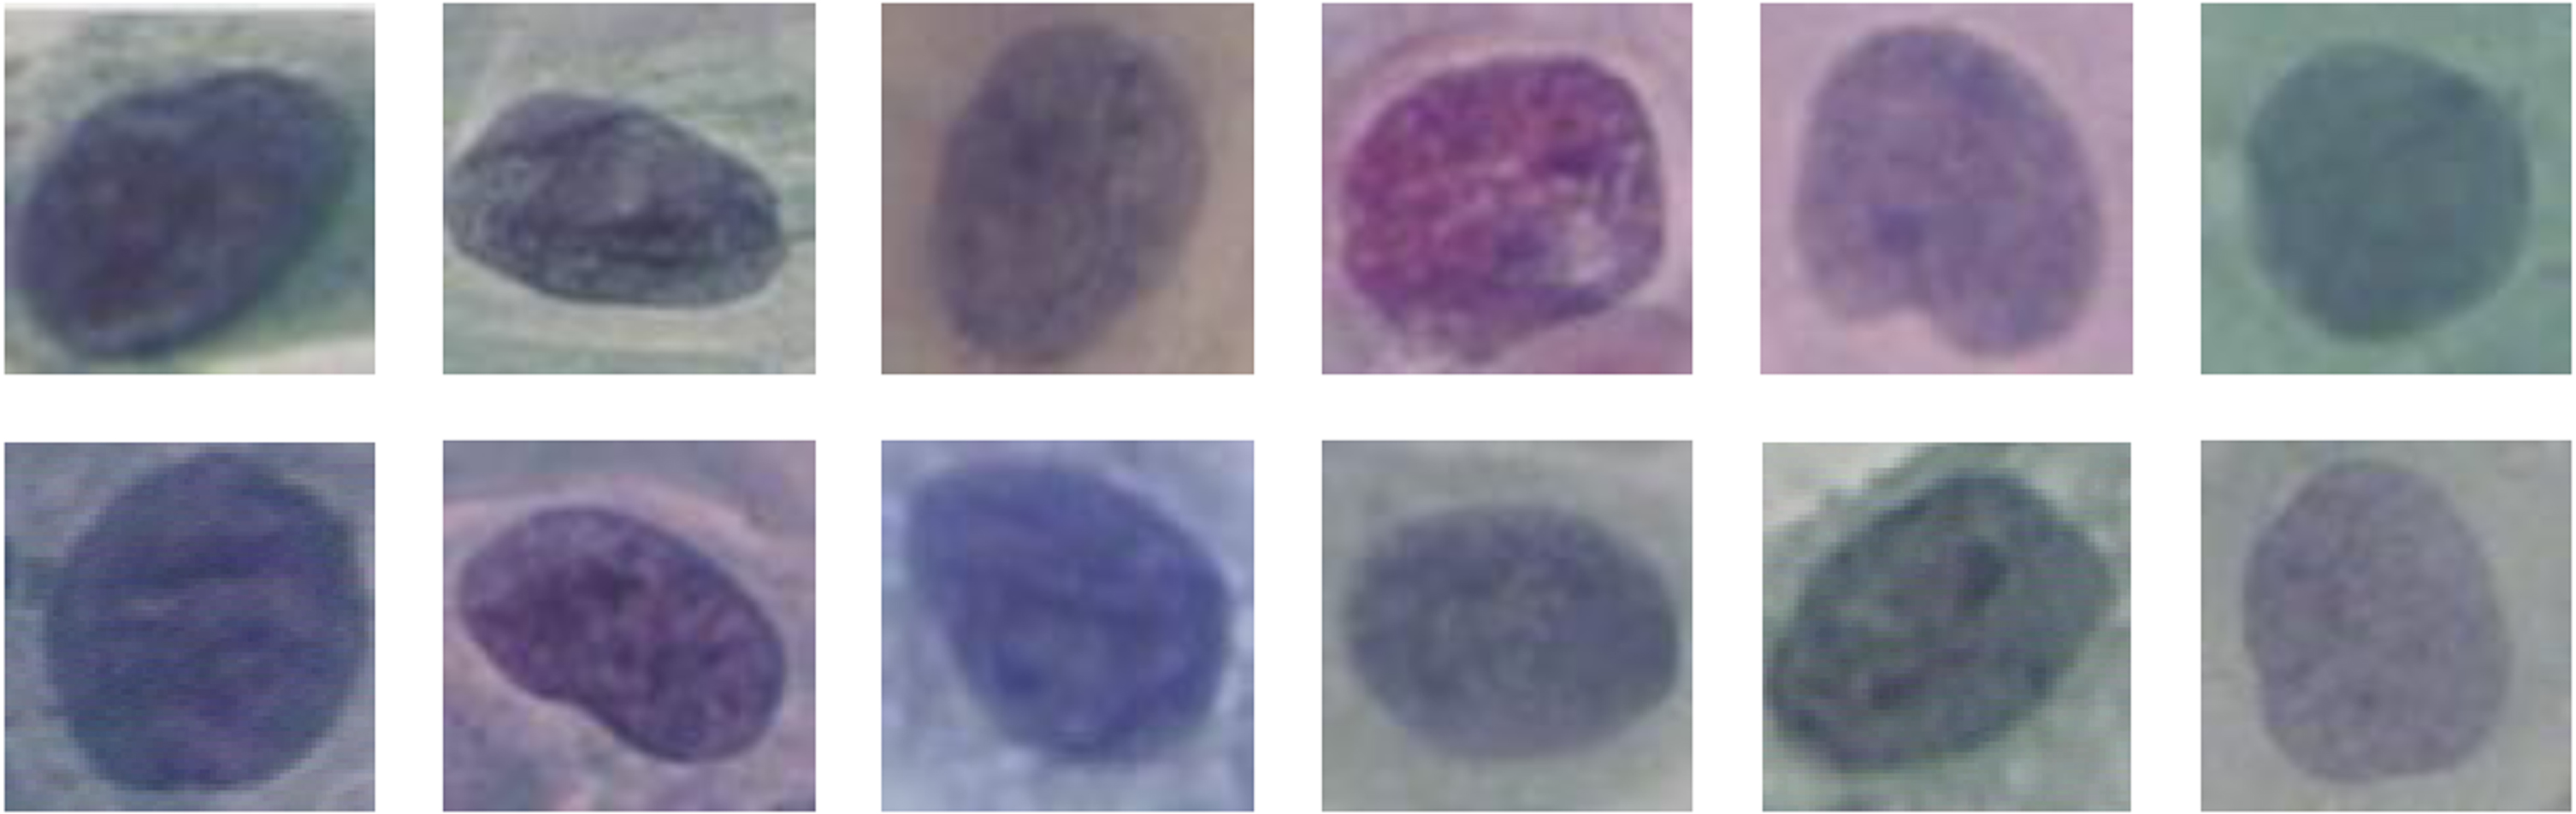
Example images of normal and abnormal cells from Herlev (a) and private (b) datasets.
Details of Herlev and private datasets
Proposed dataset is collected by Guangdong Province People’s Hospital during August 2016 to March 2018, which consists of 2337 cells from 206 patients. Each cell is obtained with the self-developed scanning system (DFK33G274 industrial camera with 400x resolution; 3-dimensional electric platform OptiScan III; twentyfold Leica DM3000 microscope) [39] and automatic segmentation method. Proposed dataset for model training partly overlaps with previous dataset in [39]. More patient data were added. All the biopsy results have been collected in order to confirm the lesion grade according to LSIL+ (Low-Grade Squamous Intraepithelial Lesion and above) criteria. There are 934 abnormal cells from 89 biopsy-positive samples and 1403 normal cells from another 117 biopsy-negative patients. Cells are selected randomly aiming at ensuring the dataset balance. Sensitive personal information has been removed. The resolution of cells is set as 70×70. More details of the proposed dataset are given in Table 1 and Fig. 2 (b).
Data preprocessing
Nuclei contains more DNA information, which is focused by the proposed approach. Unlike the cell classification methods [40–42], private dataset ignores the small amount of cytoplasm information, which extracts the patches of size 70×70 centered from the cell nuclei. Standard image size reduces the computational complexity, it also optimizes the classification efficiency and accuracy. As for the Herlev, 70×70 patches were also extracted for accurate classification, which is shown in Fig. 3.
Example images after extraction and resizing from Herlev dataset.
More available nuclei information is extracted by augmentation, which increases the robustness and reduces the overfitting in model training. Augmentation also covers more sample space [43]. Proposed strong feature CNN-LSVM faces insufficient samples and imbalanced dataset, especially the shortage of positive samples. Data augmentation and their combinations which imitate the actual scenes of image acquisition are applied equally to all classes aiming at creating mildly different replicas meanwhile maintaining the primitive labels. For example, lens angle may change due to different smear positions in scanning, and rotation mode could simulate the process.
Methods of rotation, flipping, rescaling, cropping and shear-warp transformation are applied to create the copies. Herlev and private dataset images are treated equally, relevant operations were conducted on patch of size 70×70.
Rotation (R)
No fixed scanning angle for cells are set, it is reasonable to achieve augmentation via rotation. Proposed expansion approach is conducted using rotation every 90 degrees. In this way, each cell is quadrupled, which is shown in Fig. 4(b). R0-R3 represents four modes of rotation.
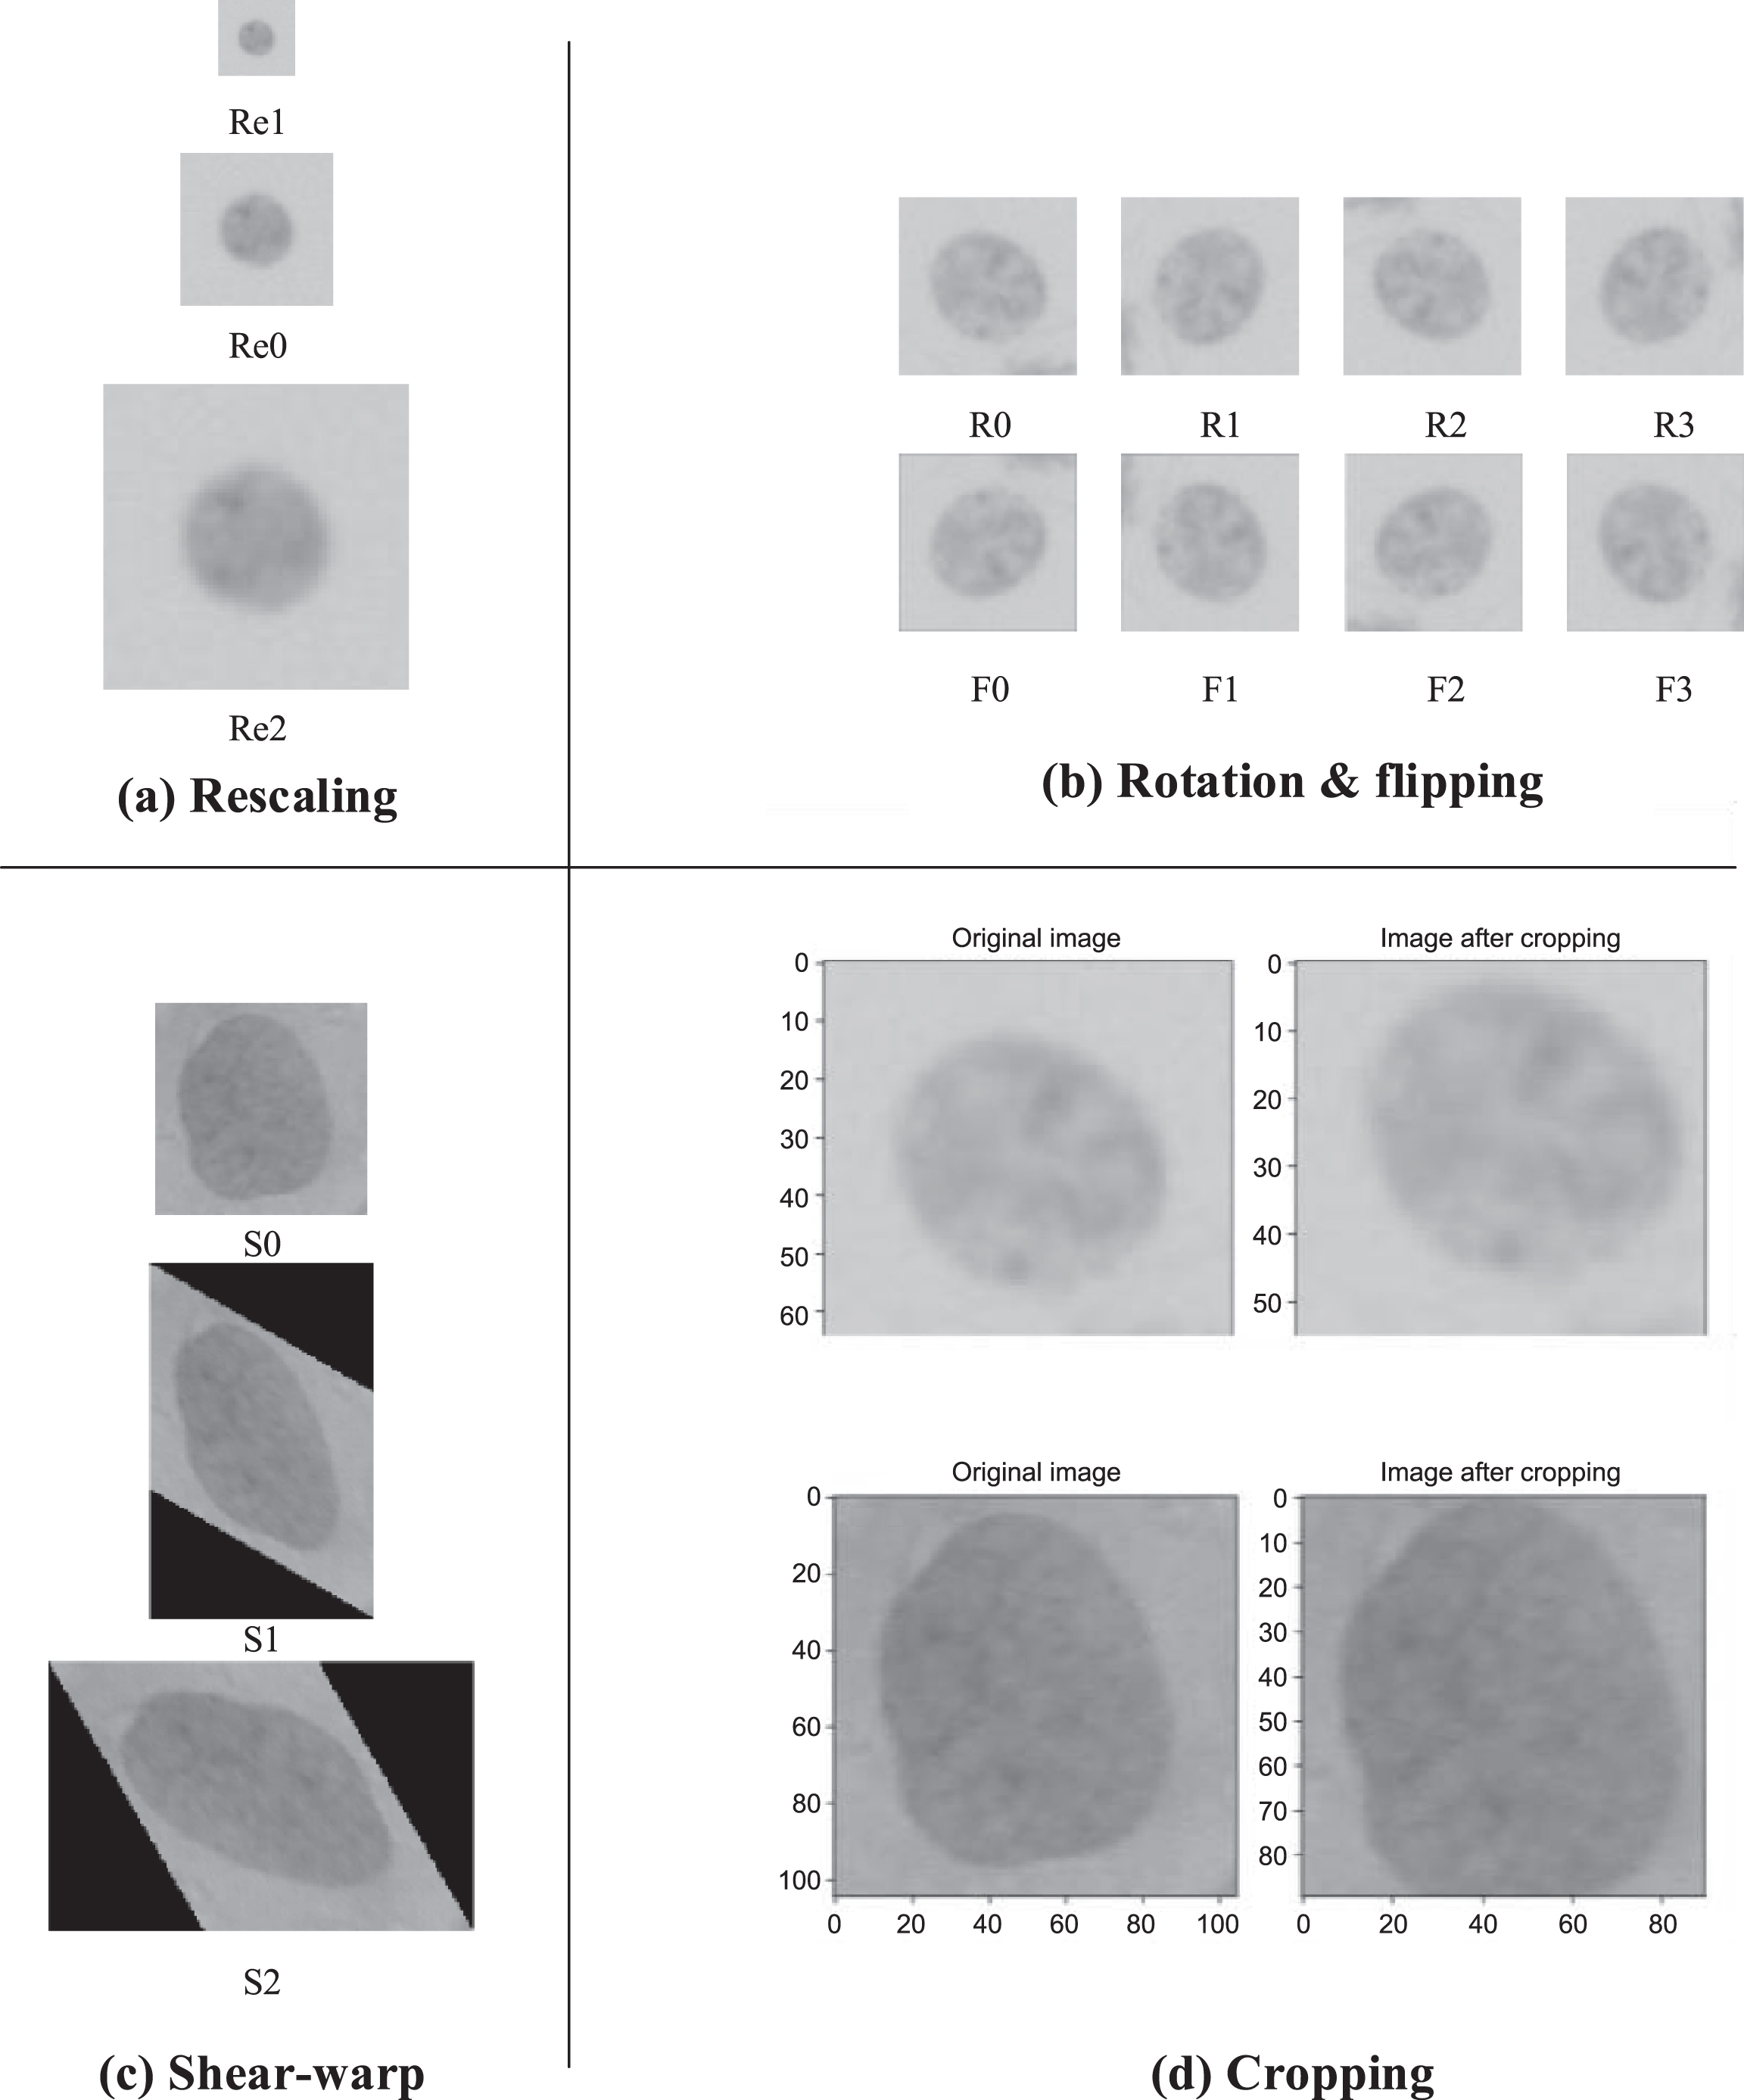
Explaining of data augmentation with (a) rescaling, (b) rotation & flipping, (c) shear-warp and (d) cropping.
Flipping simulates the angle changing of lens during collection, it also keeps the original character of samples. Therefore, horizontal and vertical flipping are adopted, one flipping operation doubles the sample size, as given in Fig. 4(b). F0-F2 stands for three modes of flipping.
Rescaling (Re)
Different sizes of microscope and objective lens lead to various focus multiples. Scaling can mimic different magnification times, such transformation preserves the features of cell DNA and cancerization degree, it is done before center cropping. Each image is resized to half and double from the original size, by which a threefold copy including modes of Re0-Re2 is generated.
Cropping (C)
Cropping is conducted using shifting for both horizontal and vertical direction, which reduces the weight of background factors and makes the model insensitive to missing values. Opencv and Tensorflow are applied for cropping, as shown in Fig. 4(d), which creates modes of C0-C2.
Shear-warp transformation (S)
Angles between lens and smears are not perfectly vertical due to the sample preparation. Shear-warp transformation is applied to simulate the distortion of cell images. Proposed transformation is recorded as vertical 30° (S1), horizontal 30° (S2) and original (S0). By which the dataset can be expanded three times. Sketch map of shear-warp transformation is given in Fig. 4(c).
Evaluation metrics
Proposed classification model is evaluated using 10-fold cross-validation on both the Herlev and private dataset, comparing with the baselines and state-of-the-art methods. 2-class classification was conducted on two datasets, 7-class classification was only applied on the first one. Training and testing dataset are set according the ratio of 4 : 1. Evaluation metrics of sensitivity (Sn), specificity (Sp), accuracy (Acc) and harmonic mean (H-mean) are introduced. H-mean is calculated as H - mean = 2 × (Sn × Sp)/(Sn + Sp). Confusion matrix is applied for the demonstration of performance between the proposed method and other reported results.
Methods
Cervical cell classification mainly consists of three parts, strong and abstract features extraction, feature dimensionality reduction and fusion, classification.
Feature extraction
Strong feature extraction
Strong feature is introduced by Jia et al [32], which indicates to features tightly associated with diagnosis. Texture features are applied for classification due to their significant change in lesion. Different strong feature extraction approaches and their combinations are tested. Detailed descriptions of feature extraction approaches are as follows.
(1) Gray-Level Co-occurrence Matrix (GLCM)
Cells from private dataset are binary, relationship between pixels is of great significance. GLCM reflects the comprehensive information of gray level about direction, magnitude, and adjacent interval. 14 GLCM characteristics were proposed by Haralick [45] for texture feature analysis. Energy (Ene), entropy (Ent), correlation (Corr), contrast (Con) are listed as follows. Fig. 5 shows the sketch map of GLCM.
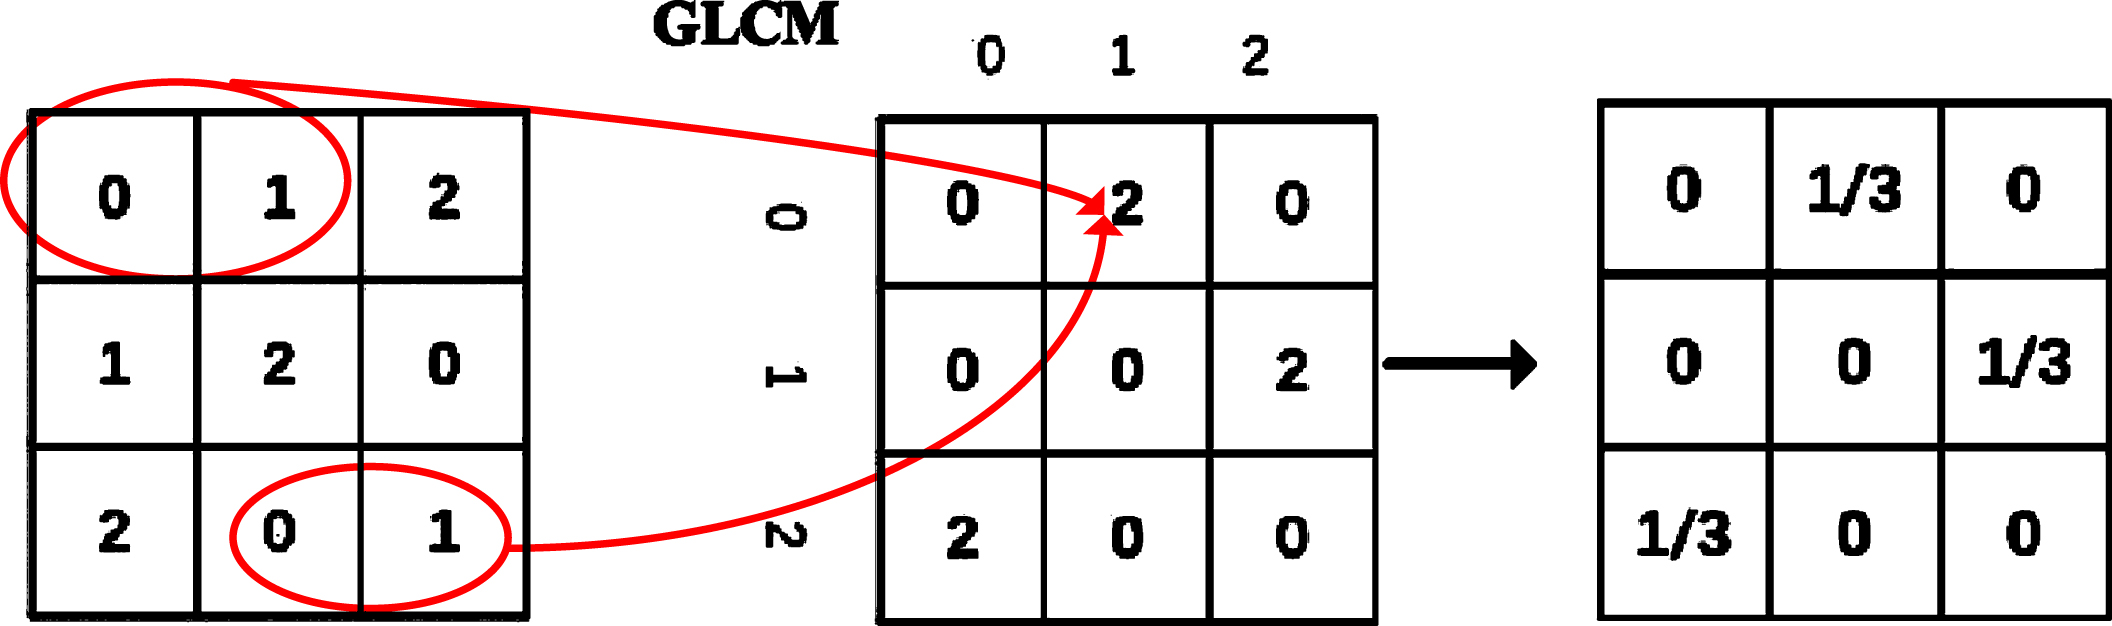
Computation process of GLCM.
P (i, j) stands for the Gray level co-occurrence matrix at the position (i, j) in image.
(2) Gabor transformation
Gabor transformation is proposed to overcome the shortcomings of Fourier transformation in non-stationary signal. Local information can be obtained by Gabor transformation by moving windows. 2-D Gabor transformation achieves the texture feature analysis by convolving with cell images, which is depicted as:
Where
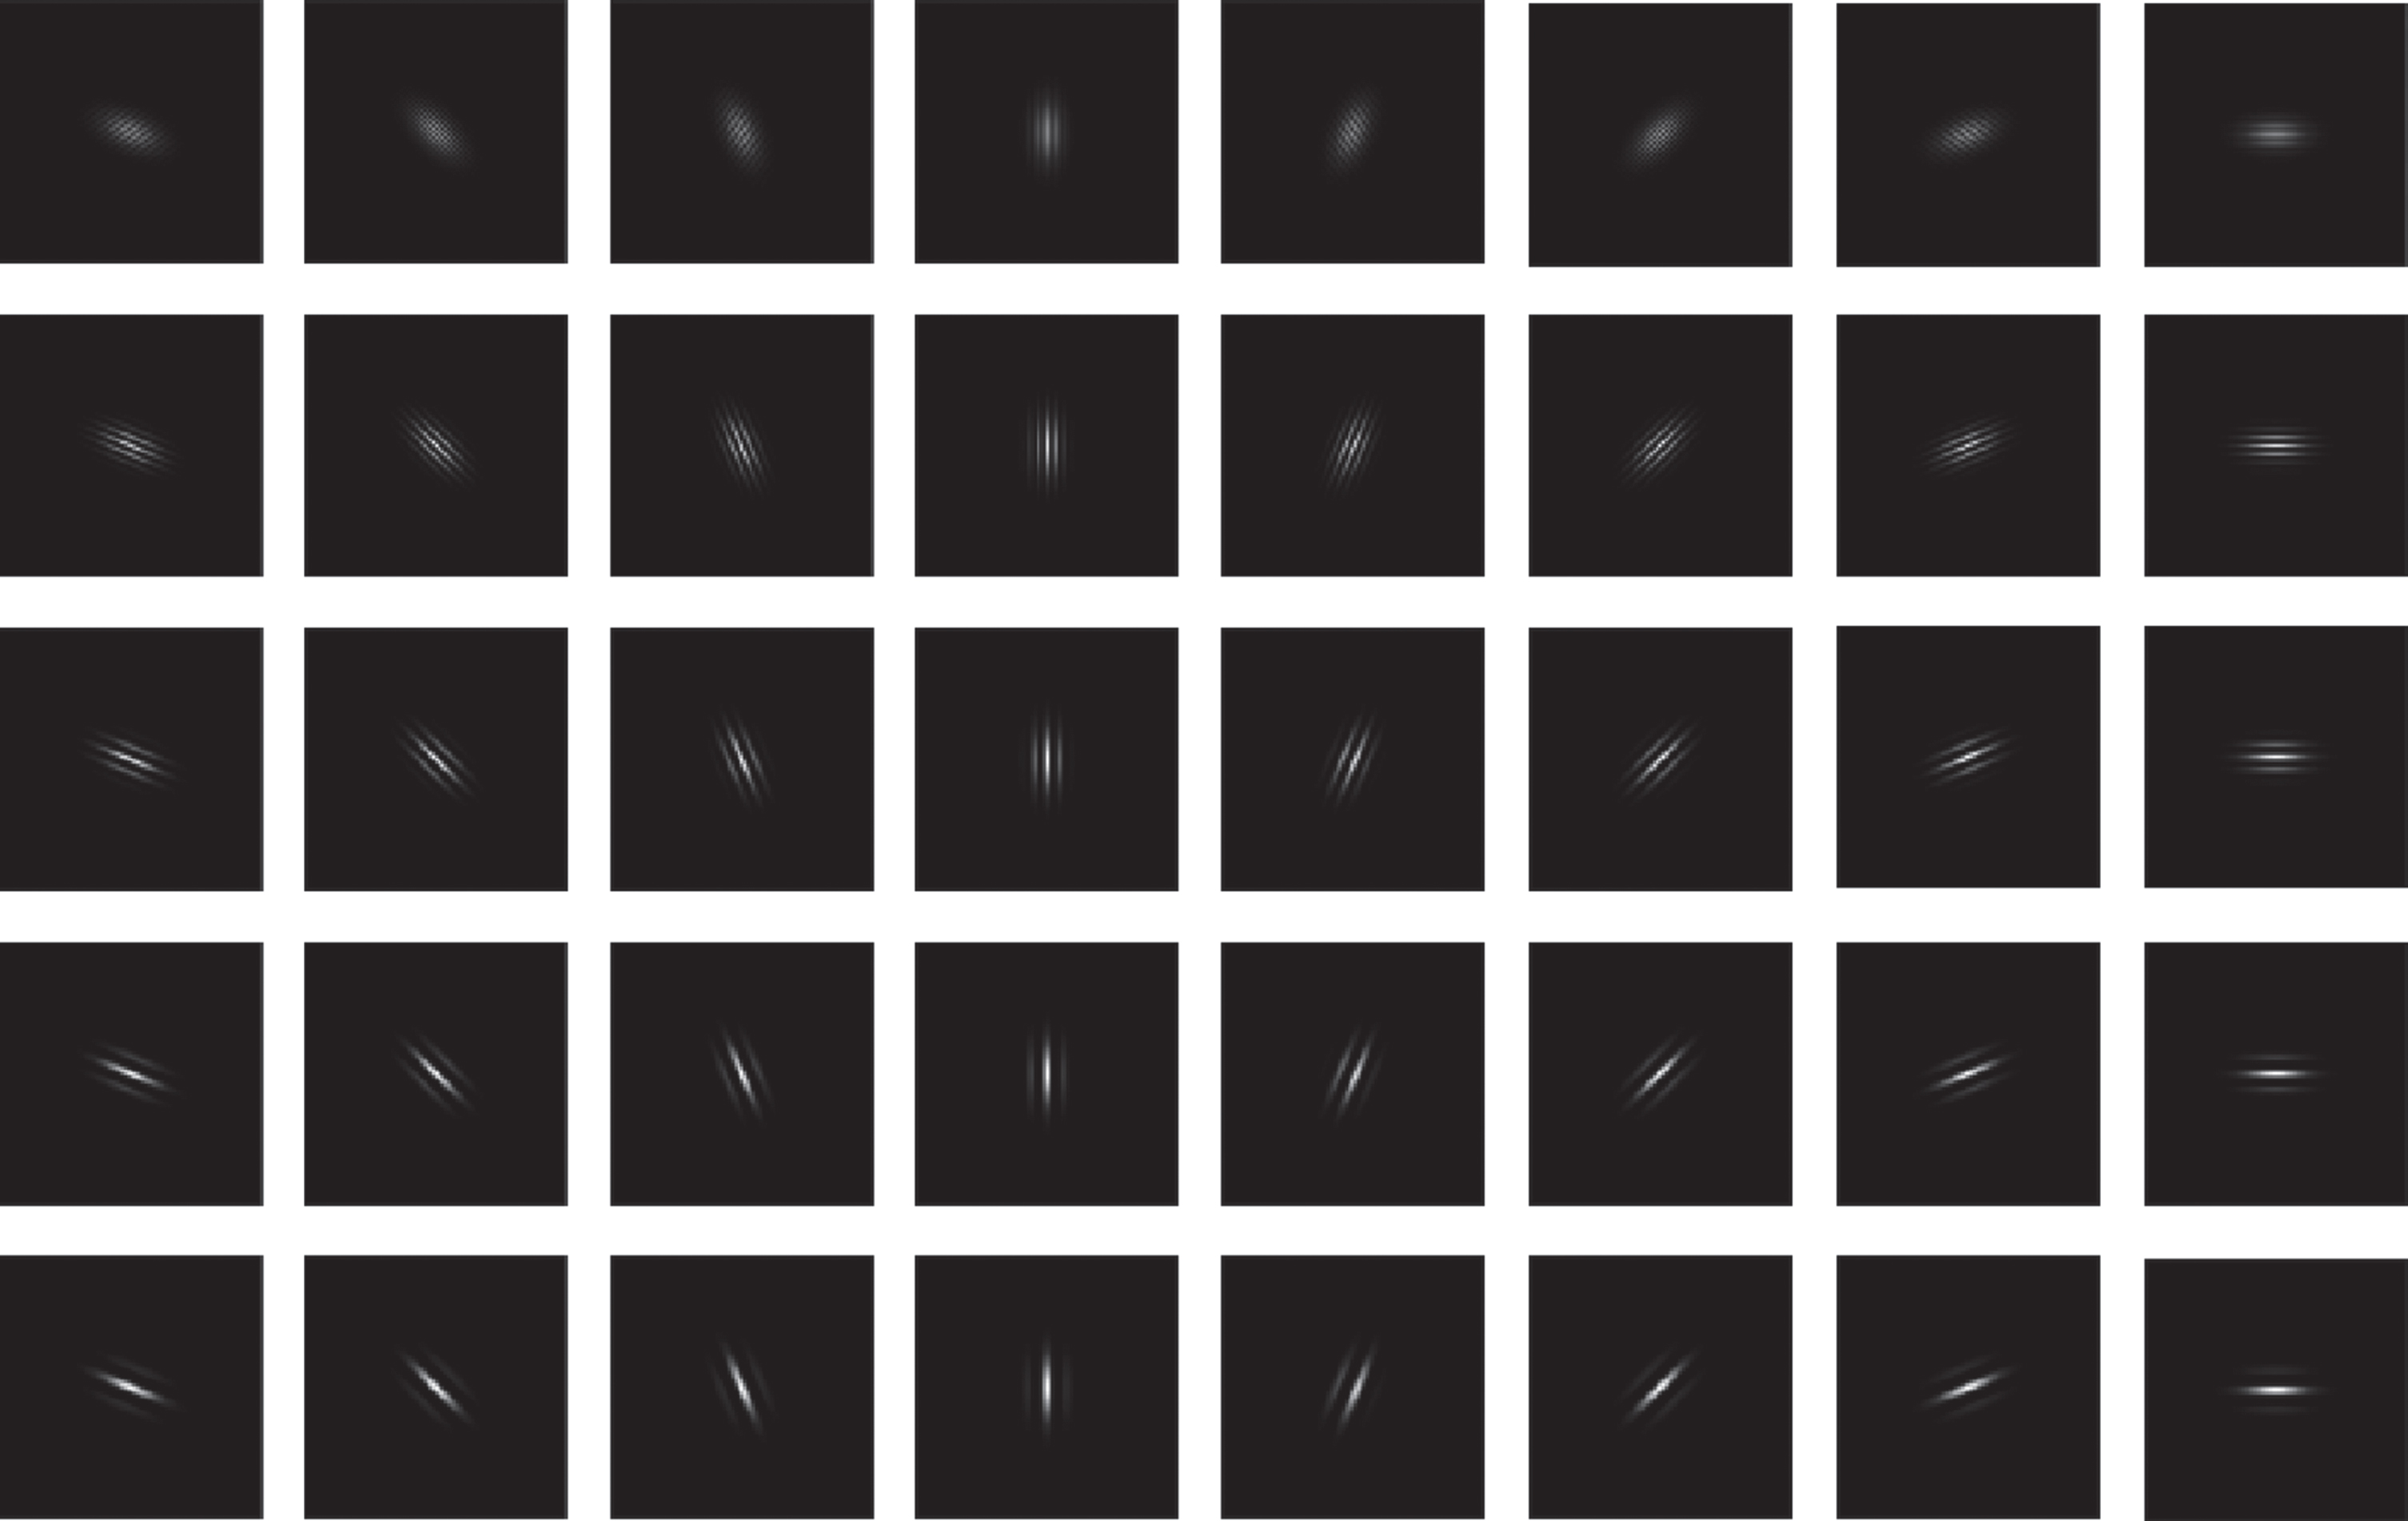
Gabor feature map with 5 filtering frequencies and 8 directions.
(3) LBP (Local Binary Pattern)
Core idea of LBP is setting the gray value of the central pixel as the threshold, meanwhile comparing it with neighboring pixels and convert them into binary code to describe the local texture feature [46]. LBP achieves the overall texture extraction by combining local structure and global statistics information. Aiming at making LBP operator have gray invariance and rotation invariance, circular neighborhood is applied. Considering the fine-grained expression and computation cost, radius and neighbor are set to 1 and 8, respectively. In Fig. 7, texture feature extraction using LBP is given. It is concluded from the histogram that the enhanced image contrast reveals more detailed features by LBP model.
(4) Fourier transformation
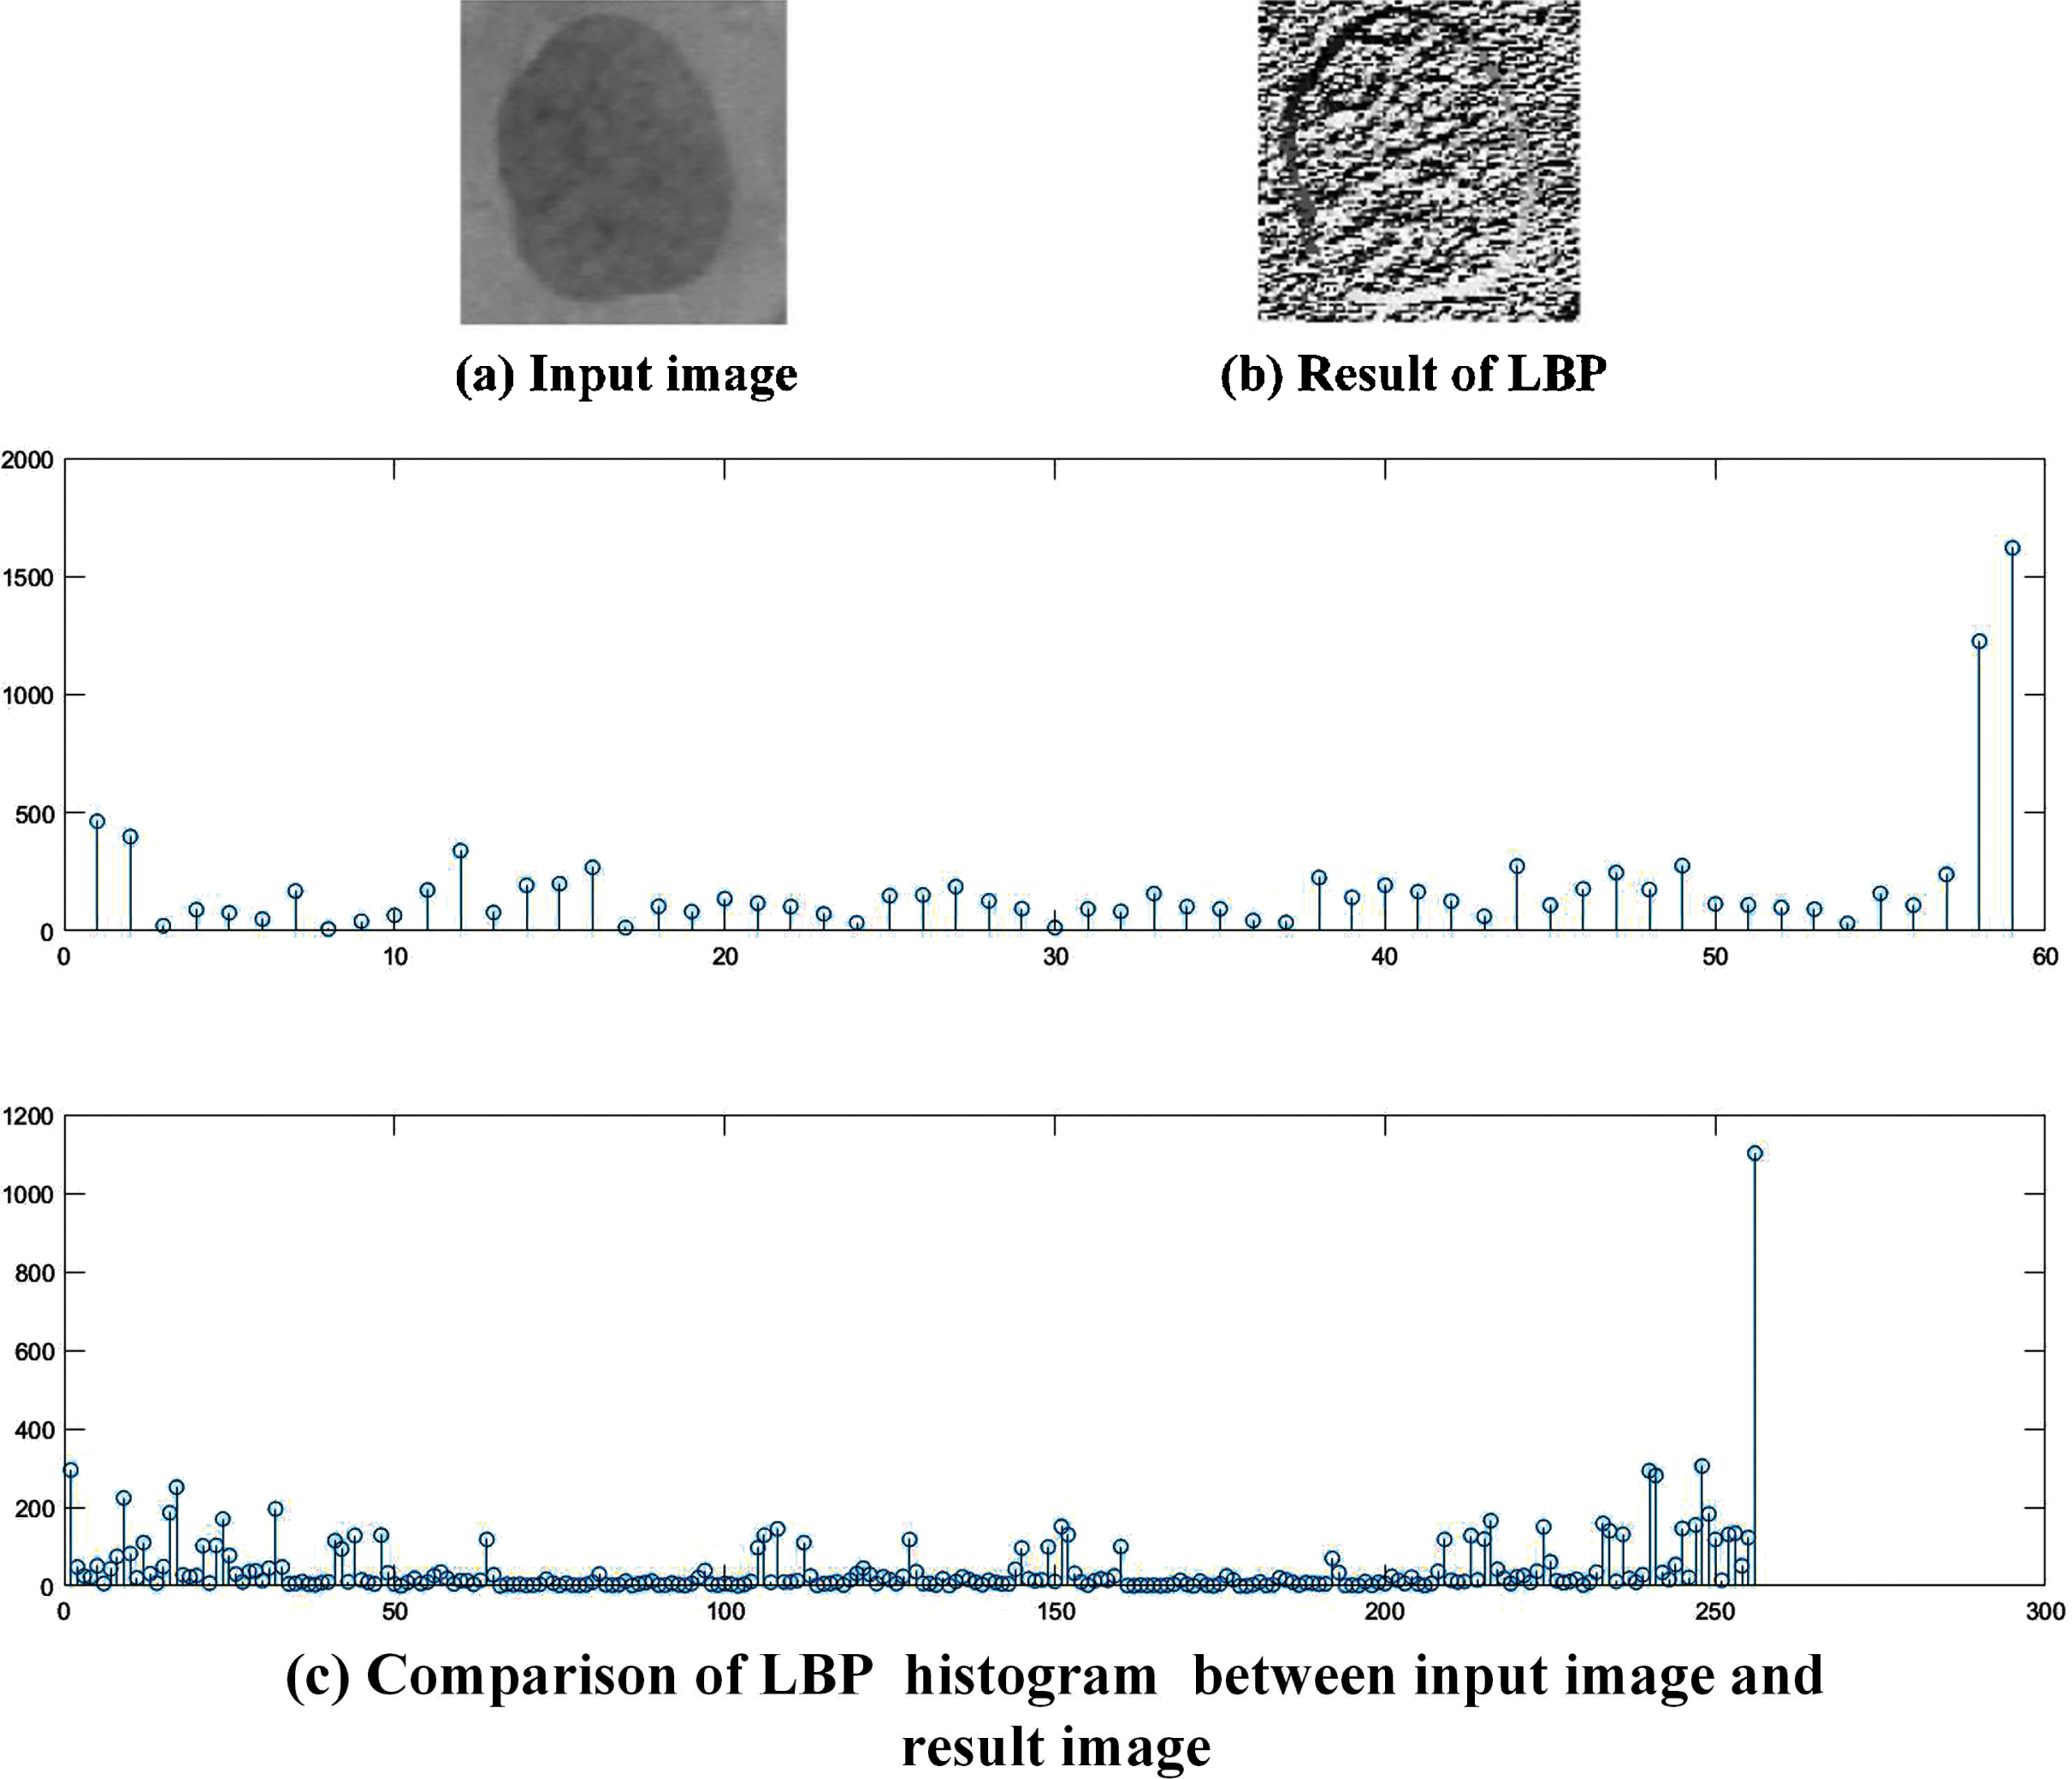
LBP for texture feature extraction (the top histogram shows the LBP results of the input image, and the bottom shows the LBP results of the output image).
Details of cells including potential cervical cancer risks are depicted by 2-D Fourier spectrum. More lighter points demonstrates that images are sharper, which brings fine border and strong contrast; while darker elements mean that there exists more lost details and blurred fragments. Fig. 8 shows the Fourier transformation process which operates on cell images.
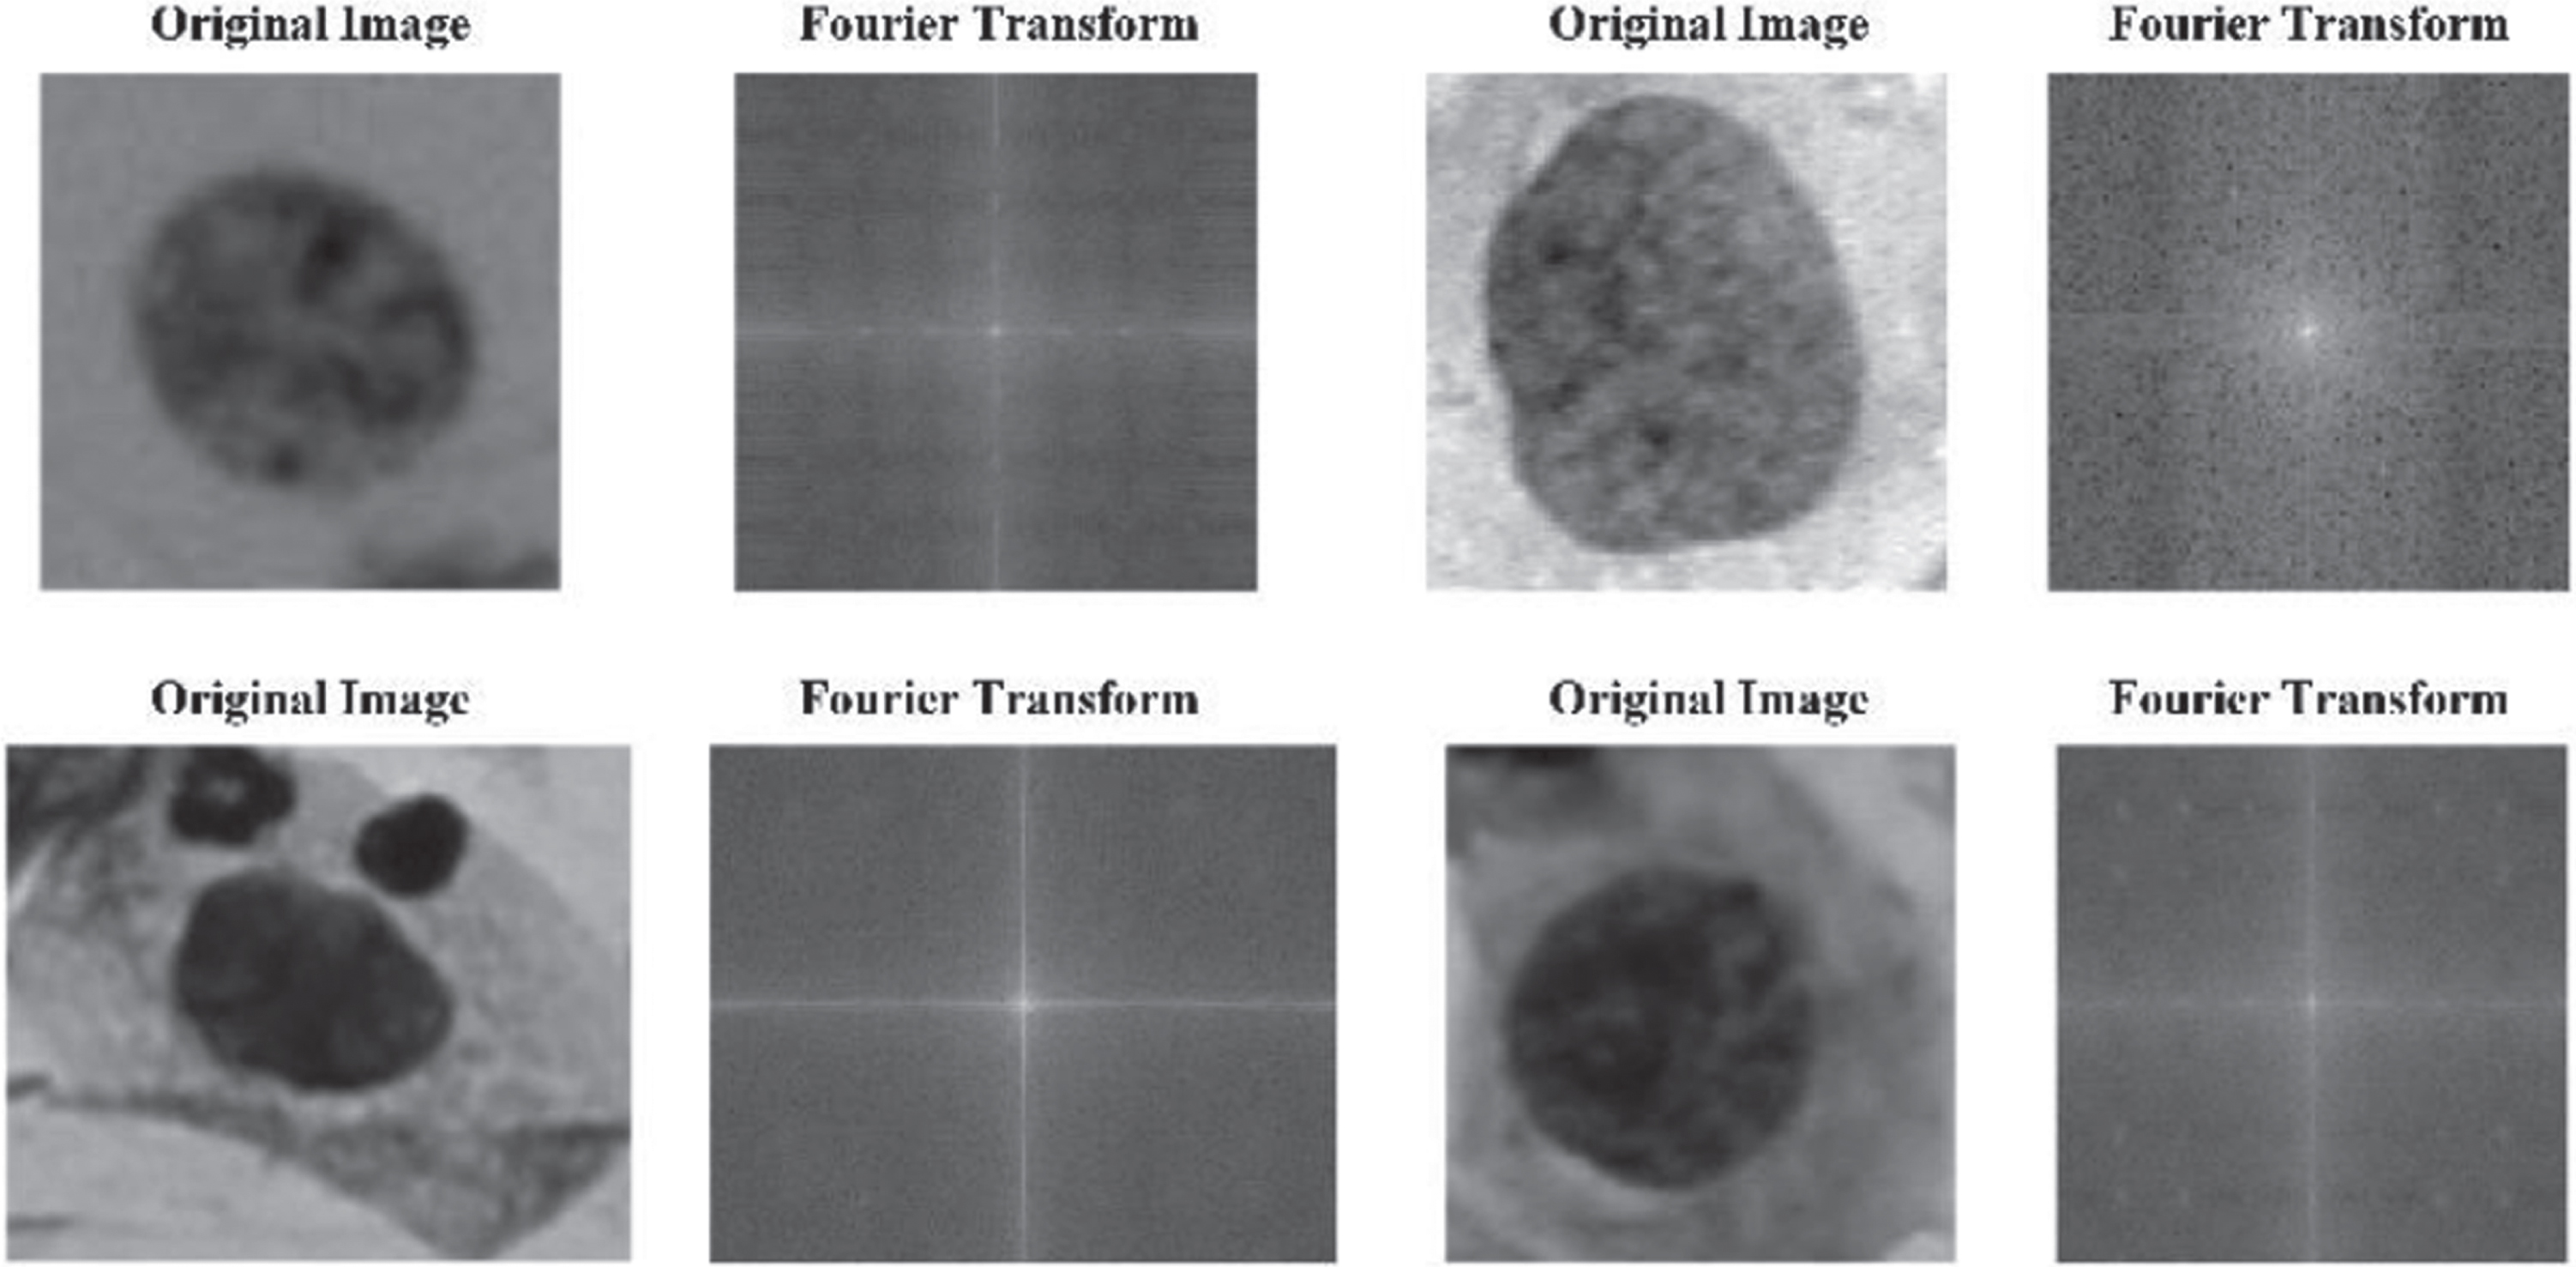
Fourier transformation results of cell images.
Designing appropriate features for clear interpretation of cells has always been a challenging task. Besides, we found that the single strong feature extraction approach cannot meet the requirements of classification in metrics like accuracy, etc. Therefore, Convolution Neural Network (CNN)-based features are applied to combine with the handcrafted features.
LeNet-5 was pre-trained in ImageNet and fine-tuned with the private dataset, then its hidden layer is used for abstract feature extraction. Features extracted from the last layer of LeNet-5 are fused and reduced, then they are input into the LSVM for classification. Fig. 9 is the diagram of LeNet-5 for abstract feature extraction.
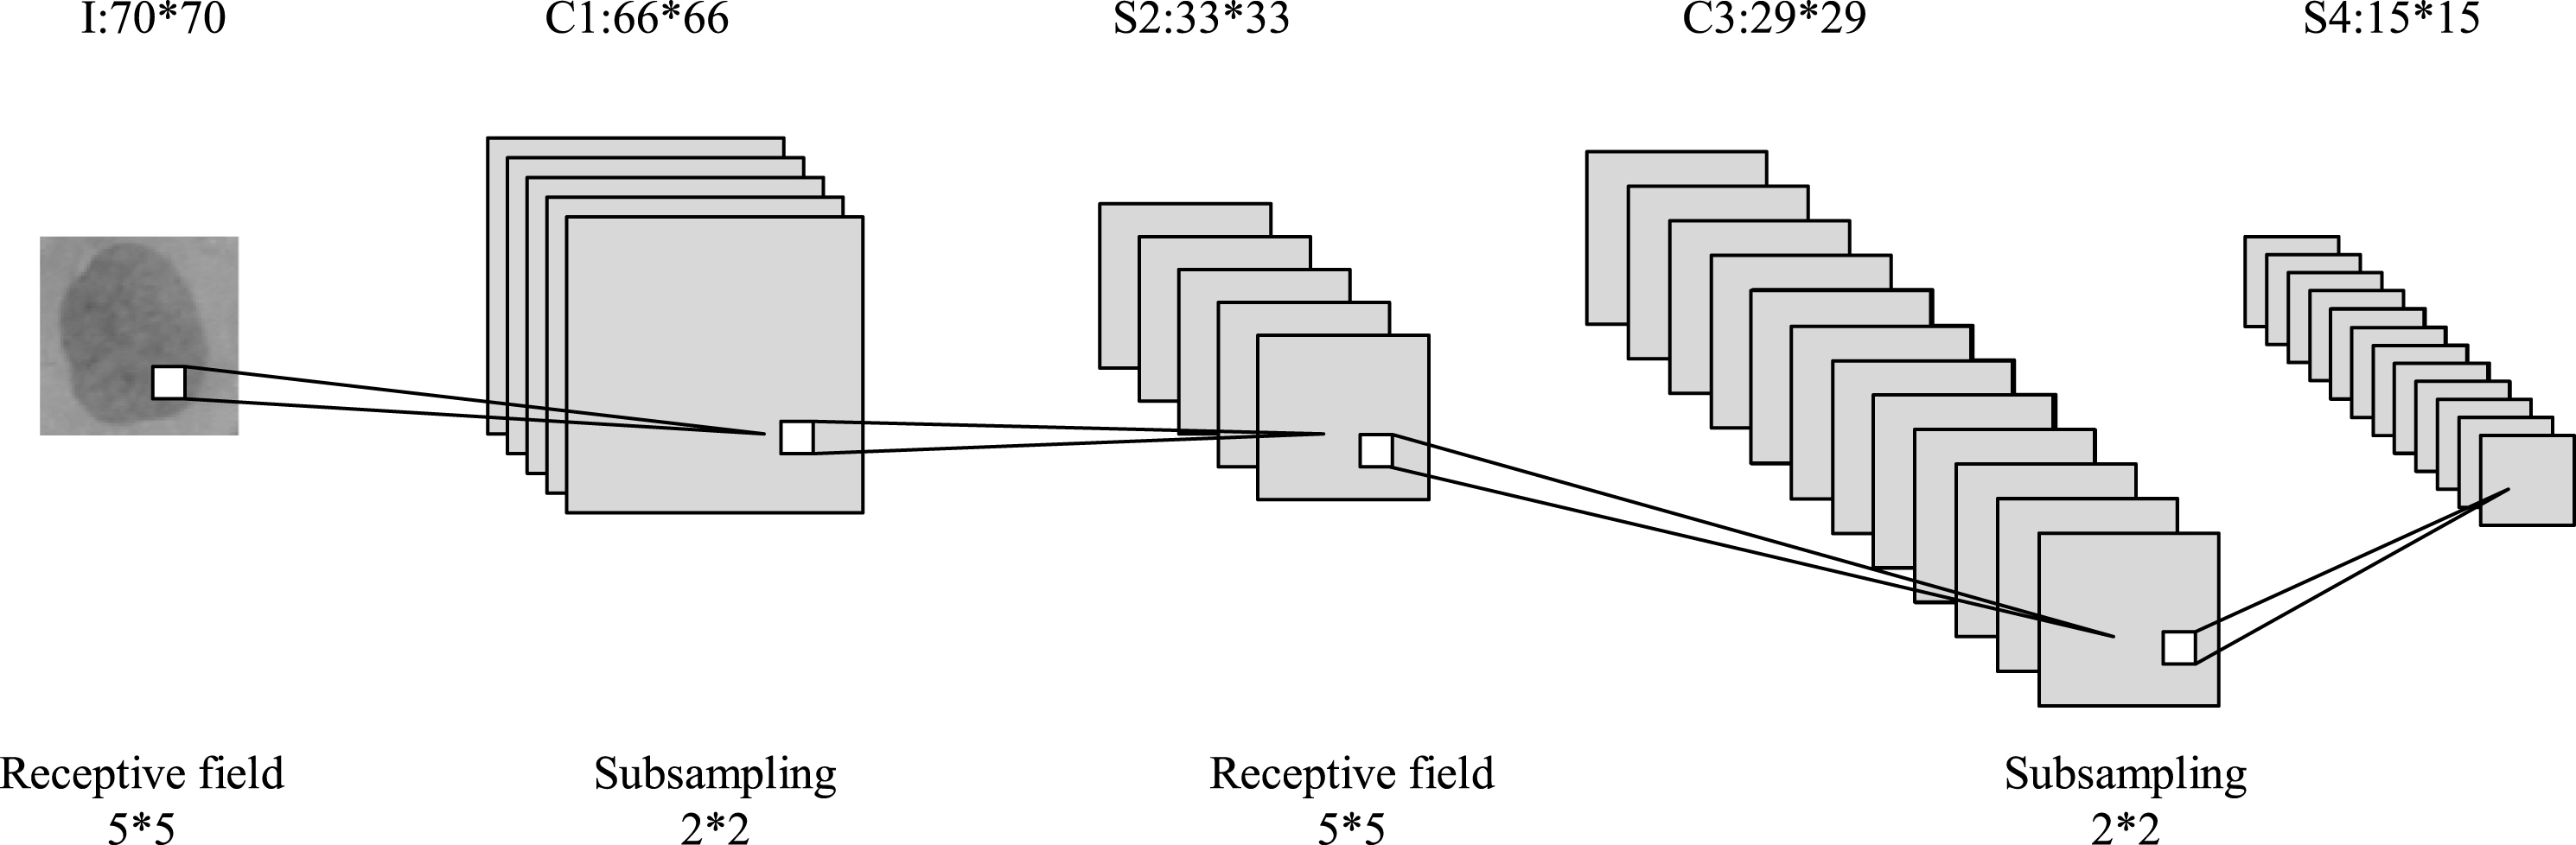
LeNet-5 model for feature extraction.
As shown in Fig. 9, the first layer I acts as the input layer with a receptive field of 5 × 5 to receive the information from 70 × 70 epithelial cells. C1 layer is constructed with 5 convolution cores and 5 × 5 visual field windows, which achieved the initial extraction by convoluting with the input image. Sliding window step is set as 1, so the output of the C1 layer are 5 feature maps with sizes of (70 - 5 +1) × (70 - 5 +1) = 66 × 66. S2 layer works as the downsampling layer which applied the max-pooling with 2 steps pooling window. 2 × 2 regions from the original feature map were chosen, the maximum is used as the representative value for the generated feature map. There are 5 feature maps in S2, dimension of S2 is (66/ -2) × (66/ -2) = 33 × 33. Feature map of layer S2 is generated by the convolution of 5 × 5 visual field window with 1 step size sliding window. Later, feature graph of layer C3 is obtained, its size is (33 - 5 +1) × (33 - 5 +1) = 29 × 29. S4 works as the pooling layer with max-pooling and a 2 × 2 pooling window, the step size is set as 2. 12 feature maps with dimension of (29 + 1) ÷2 = 15 are obtained. Therefore, final feature dimension is 15 × 15 × 12 = 2700. Different features from convolution layer C1 to subsampling layer S4 are selected in Table 7 to find the best abstract feature extraction approach. Details of the proposed LeNet-5 is given in Table 2.
Parameters of LeNet-5
Detailed descriptions of LSVM
Algorithm framework of Adaboost-LSVM
Once the strong features and features extracted by hidden layers of LeNet-5 are obtained, they would be processed with normalization, fusion, and dimension reduction, which are given as follows.
Feature normalization
Feature normalization is conducted according to equation (6), where μ, σ are the mean and deviation of the eigenvectors. x i and are the original and the normalized cell features.
14 GLCM-based features including energy (Ene), entropy (Ent), correlation (Corr), contrast (Con), Gabor feature maps of different frequencies and directions, histogram of LBP are fused together to form the feature vector. Define the GLCM+Gabor+LBP feature vector is X1 = [x11,x12, ⋯ x1,m], CNN-based feature vector is X2 = [x21,x22, ⋯ x2,n]. Fused feature W = (w1, w2, ⋯ , wm+n) = (αX1, βX2) is obtained by the serial fusion. α and β are weighted fusion coefficients, demonstrating the weight of different fusion ratio. α ∈ (0, 1) , β ∈ (0, 1) α + β = 1. Experiments of feature fusion in Fig. 12 using increments/decrements of 0.05 are conducted, optimal combination that α = 0.35 β = 0 . 65 are achieved.
Feature maps from different layers of LeNet-5.
Dimension of the fused feature vector W reached 2700 + 2840 = 5540. Computation complexity will be too large if the fused features are input into the LSVM classifier directly, Linear Discriminant Analysis (LDA) [47] as a commonly used approach for reducing the dimension while reserving the original properties is applied. Reducing the feature vector decreases the redundancy meanwhile offering computational benefits which promotes the classifier performance.
D = {(x1, y1) , (x2, y2) , . . . , (x m , y m )} represents the fused feature dataset, where x i is the n-dimensional feature vector, y i ∈ {C1, C1, . . . , C k }. Define Nj (j = 1, 2, . . . , k), Xj (j = 1, 2, . . . , k), μj (j = 1, 2, . . . , k), as the number, set, mean vector, and covariance matrix of j - class samples. Then the dimension reduction is transformed into the optimization follows:
A hyperplane is finally obtained by projecting from multiple classes to low dimensions. Theoretically, the lowest dimension is k - 1, which is determined by the correlation of eigenvectors in projection matrix. Fusion feature set with a lower dimension achieved by LDA is then fed into the model for training and classification.
The eigenvectors extracted by combining approach of strong feature and LeNet-5 will be fed into the improved LSVM model for training using the Adaboost algorithm.
Dual channel network
Classical CNN itself could achieve the task of feature extraction and cell classification, while features obtained by networks are abstract. Adding strong features extracted by combining methods to features from CNN model (LeNet-5) provides more supervised information. Fused features are fed into the LSVM classifier applying Adaboost to achieve the cervical cell classification. Schematic diagram of proposed network is given in Fig. 10.
Sketch map of strong feature CNN-LSVM model.
Proposed model is mainly divided into two paths, strong feature and CNN path. Abstract features derives from [48], whose adjacent layers are partly connected to ensure the perceptual region of a neuron comes from the prior ones. LSVM [49] classifier is the improvement version of classical SVM, which introduces a slack variable ξ to linear separable SVMs. Then the restrictions are given as:
Objective function becomes to:
Finally, cell classification is transformed into solving dual problem as shown in Equation (9).
Relevant results show the room for reducing the number of support vectors in solutions thus improving the computation efficiency. Therefore, larger dataset and data augment approaches could be applied for higher accuracy. LSVM algorithm is conducted as follows:
Eigenvectors along with labels from pathologists are applied for model training. Adaboost proposed in [50] is introduced for the optimization. Using LSVM as the base classifier of Adaboost, the integrated classifier is applied to classify eigenvectors. Therefore, overfitting caused by lack of samples in deep neural network is avoid, meanwhile a nice accuracy is achieved.
As for Adaboost, initial weights of each sample are kept the same, by which the first weak classifier is trained. Weights of misclassified samples will be increased; weights of those correctly classified samples are reduced. Whole training process is carried out iteratively, finally all the weak classifiers are combined to establish the strong classifiers according to certain weights. This paper tries to combine Adaboost with LSVM.
Proposed LSVM model will be applied for classification in both Herlev and private dataset, which includes 2-class and 7-class classification. Multi classification will be achieved by the combinations of binary classifier. The objective function is continuously optimized in training, by which the cell classification of two datasets is achieved. Framework of Adaboost-LSVM is given as follows:
Experimental results and analysis
Comparison experiment and simulation are performed on PC with 2.8GHz Intel Core i7 processor and 32GB memory, using Microsoft Visual Studio 2013 and Python 3.4.4 in Windows 10 for programming. TensorFlow is applied as the deep learning backend. Results given for illustration are the optimal ones in comparison experiments.
Comparison of different data augmentation methods
Private dataset is applied for data augmentation experiment, strong feature is extracted by the combining methods of GLCM, Gabor and LBP, fusion ratio is the optimal configuration of 7 : 13, training set to testing set keeps at 4 : 1. Metrics of 2-class classification are obtained with 10-fold cross-validation. Augment approaches including rotation (R), flipping (F), rescaling (Re), cropping (C) and shear-warp transformation (S) are combined and given in Table 5. Model A without any augmentation acts as the baseline.
Configurations and accuracy of datasets under augmentation
Configurations and accuracy of datasets under augmentation
Top results have been styled with bold.
Table 5 shows the configurations and corresponding accuracy from model A to L. Increase of accuracy on model A&B&C&D demonstrates that rotation is effective to the model training, larger dataset using rotation makes the model more sensitive to abnormal cells, accumulated accuracy has been improved by 1.4%. Model D&E&F show higher accuracy resulted by flipping, both of the flipping modes boosted the robustness. Flipping modes of F1-F2 increased the accuracy of 0.6% and 0.3%, respectively. While rescaling operation should be applied carefully, rescaling the original image to half size (Re1) decreased the accuracy of 0.6%, it is concluded that smaller image resolution reduces the recognition ability. Less effective information is extracted by the proposed model, like model G. Re2 rescaling mode obtained an accuracy of 1.1% higher than model G. Therefore, it is introduced to the data augmentation. Accuracy comparison of model H&I&J shows the effect of cropping, operation in two directions resulted the rise of accuracy. C0 to C2 are applied for the model J, which is the final augment model. The highest accuracy of model J reached 95.1%. As for the shear-warp transformation, model J&K&L show their weakness in data augmentation. This method is not stable for data augmentation, which leads to a decrease in accuracy of –1.5% and –1.1%, respectively. As a result, shear-warp transformation is abandoned.
Cervical cancer cells have obvious changes in the course of lesion, such as texture, morphology and chroma. The accurate grasping of these features can undoubtedly help to establish the training feature distribution better and obtain good classification performance. GLCM, Gabor, LBP and Fourier transformation and their combinations are applied in order to find the optimal choice for strong feature extraction. Accuracy and efficiency are evaluated. Private dataset after data augmentation with image size of 70×70 is used. Other conditions like augment approaches are set the same as section 4.1, model J.
Strong features extracted by the proposed methods are serially combined and fused with the abstract features, then the fused features after LDA process are input into the LSVM classifier for cell classification. We test the strong feature extraction methods in our proposed framework to evaluate the accuracy and efficiency for different combinations of features. The private dataset and 10-fold cross-validation is applied for testing. Overall accuracy and processing time on whole dataset are as given in Table 6.
Accuracy and efficiency of strong feature extraction methods on private dataset
Accuracy and efficiency of strong feature extraction methods on private dataset
Top results have been styled with bold.
It is concluded from Table 6 that combining method of GLCM + Gabor + LBP obtained the best accuracy of 95.1%, although its efficiency may not be optimal. The way that applied four methods achieved the accuracy of 94.4% similar to proposed model, while it is abandoned due to the decrease in efficiency. Performance of single ways including Gabor and LBP are better than GLCM and Fourier, this could be caused that multi directions of Gabor filter obtained the texture characteristics in various angles. Gray and rotation invariance of LBP help to detect the change of abnormal cells. Performance of Fourier transformation is not ideal compared with other methods, results showed that labels are not sensitive to features extracted from frequency domain, which leaded to the decrease in accuracy. Compared with the single method, the accuracy of the double combination method is improved. The maximum increase is 4.2%. However, the time consumption of the dual combination method also increases significantly. The accuracy of the three-combination method has been further improved, and the growth rate is about 5%. The combining method of GLCM + Gabor + LBP based on the combination method has the best effect, and achieves higher accuracy with relatively consistent extraction time. More complex feature extraction methods can obviously extract abundant image details, while the efficiency is further reduced as the cost.
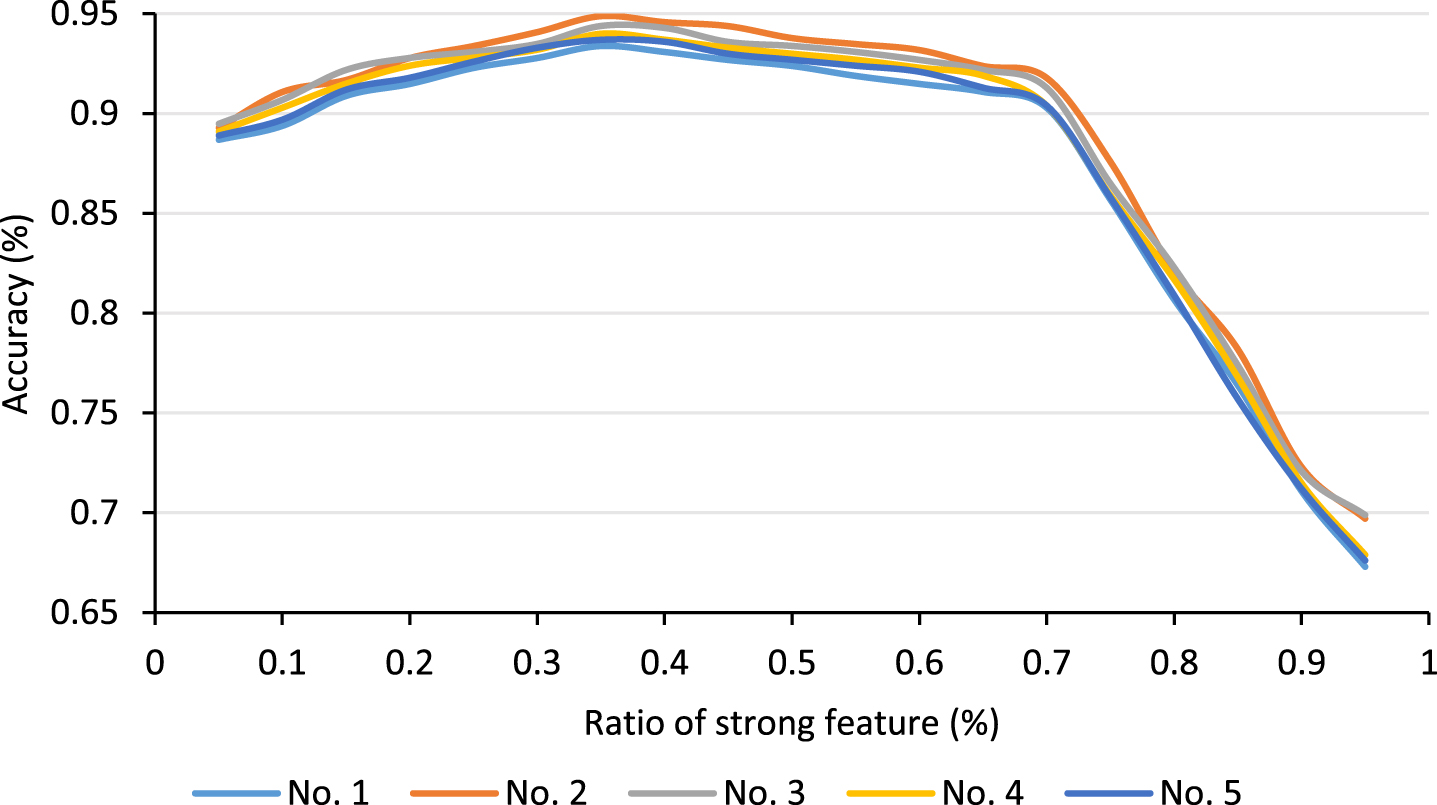
Strong features extracted by the combining methods are fused with abstract ones to create the fused feature W = (w1, w2, ⋯ , wm+n) = (αX1, βX2). Original private dataset after augmentation is applied, strong feature extraction approach, evaluation metrics and cross-validation are set the same as section 4.2. After that the fused feature processed by dimension reduction are input into the LSVM for classification, accuracy of five groups derived from the private dataset are recorded with the change of feature fused ratio, as shown in Fig. 11.
Accuracy of the proposed classification model under different fused ratios.
As given in Fig. 11, abscissa represents the proportion of strong features in fusion, accuracy is recorded using increments/decrements of 0.05. The results show that the accuracy rate increases first and then decreases. When the ratio of strong features is between 0.05 and 0.35, the accuracy increases with the increase of the ratio. It can be seen that strong features play a role in the gain, which effectively makes up for the deficiency of feature extraction based on CNN. When the proportion of strong features reached 35%, the accuracy reached the highest value. This is also the best fusion ratio and is applied to model building. After that, the accuracy continued to decrease with the increase of the proportion of strong features. When the proportion of strong features increased to more than 90%, the accuracy dropped to less than 70%. It is obvious that too many artificial features will degrade the classification performance. In general, strong features can effectively make up for the deficiency of abstract features extracted by CNN, and their performance is better than that of single CNN structure.
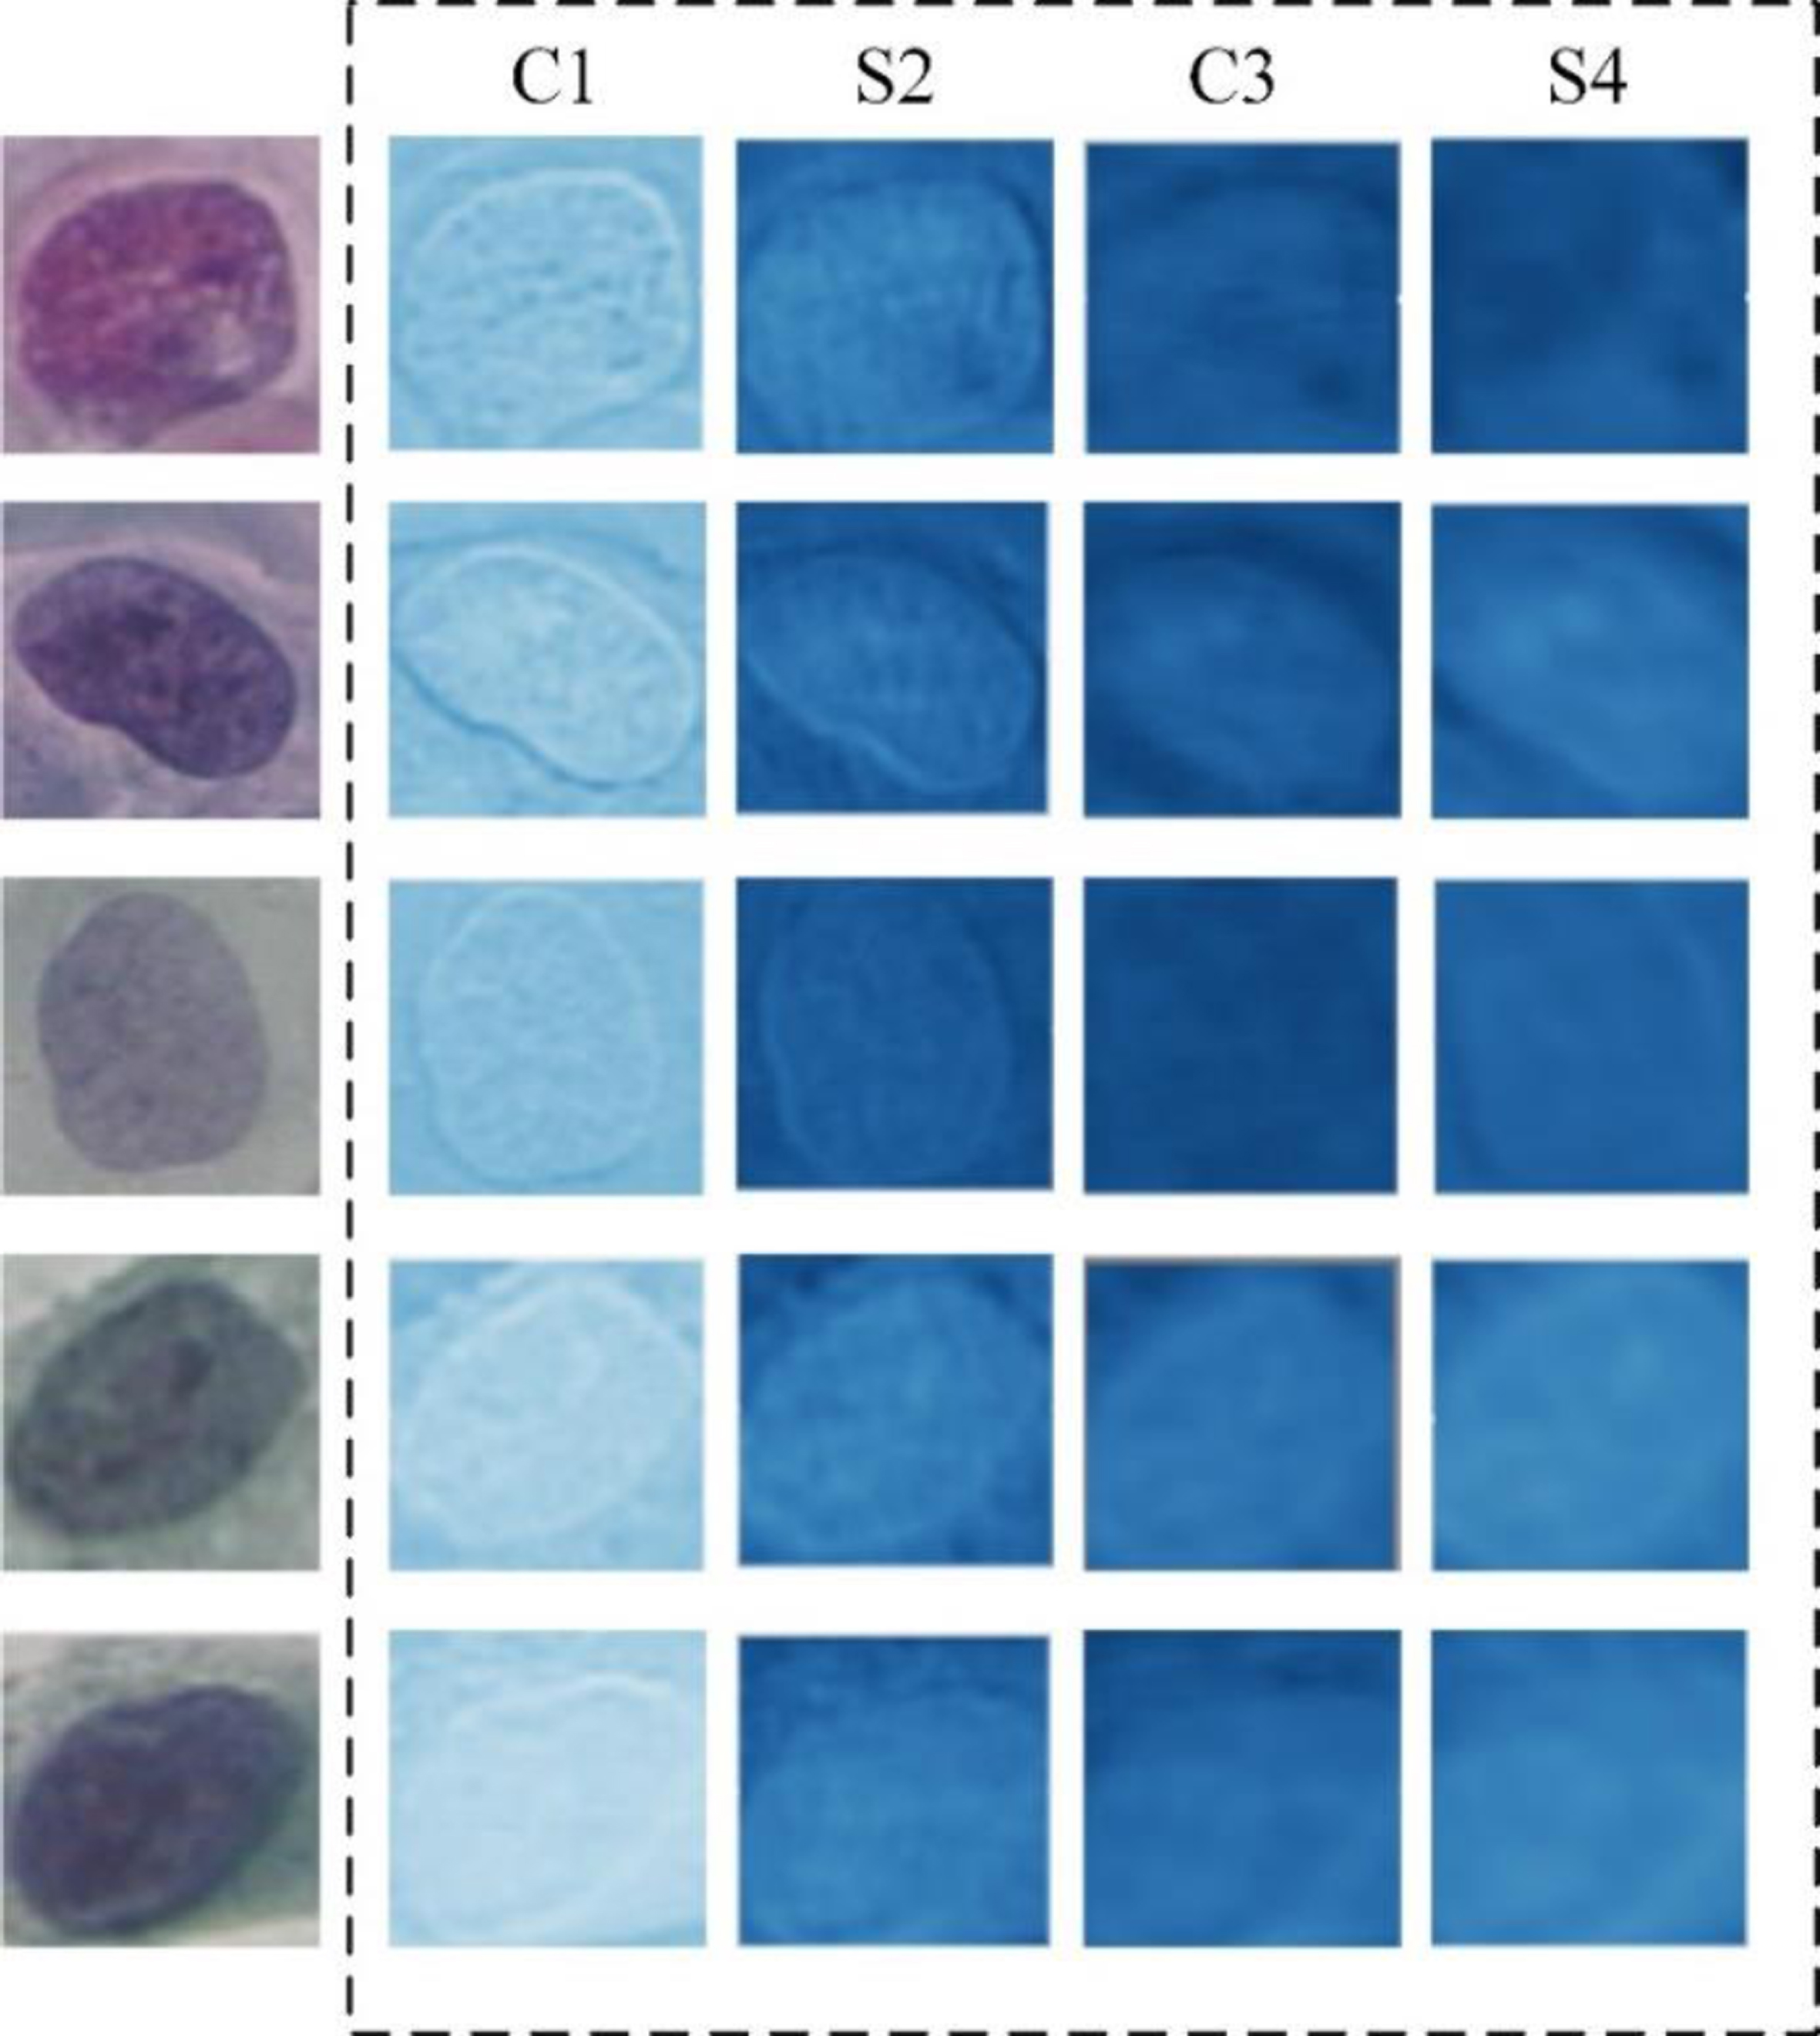
Different layers of LeNet-5 are applied for abstract feature extraction. We obtained the features from layers of LeNet-5 and fused them with strong features according to the optimal fused ratio, then the fusion features are input into the LSVM for classification. 2-class and 7-calss classification on Herlev dataset are conducted. Other experimental conditions are kept the same as section 4.1. Fig. 12 shows the feature maps extracted in blue channel from different layers, Table 7 summarized the corresponding performance.
Classification performance of different layers on Herlev dataset (2-class & 7-class)
Classification performance of different layers on Herlev dataset (2-class & 7-class)
It is concluded from the Fig. 12 that features from lower layers in LeNet-5 like C1 and S2 reflect clearer image contours, which are accurate in location but contain few semantic connotations. Cell classification mainly relies on the structure and texture information, rather than the detailed contours. As given in Table 7, features extracted by multi layers outperformed those extracted by single layers, in both 2-calss and 7-calss classification. Accuracy of lower layers like C1 is 2.1% weaker than that from S4 in 2-calssification, similar results were obtained in 7 categories. Semantic information is stronger in deeper layers, which obtains better distinguishing ability. Sn and Sp also promoted as the increase of layers. While Sp of 7-class in C3 is slightly higher than that of S4, reduction of feature dimension by layer S4 caused the underfitting for proposed model, which reduced the accuracy in certain samples. Overall, the deepest layer of LeNet-5, lower sampling layer S4, achieved the best accuracy and sensitivity, which supported the architecture of the proposed model.
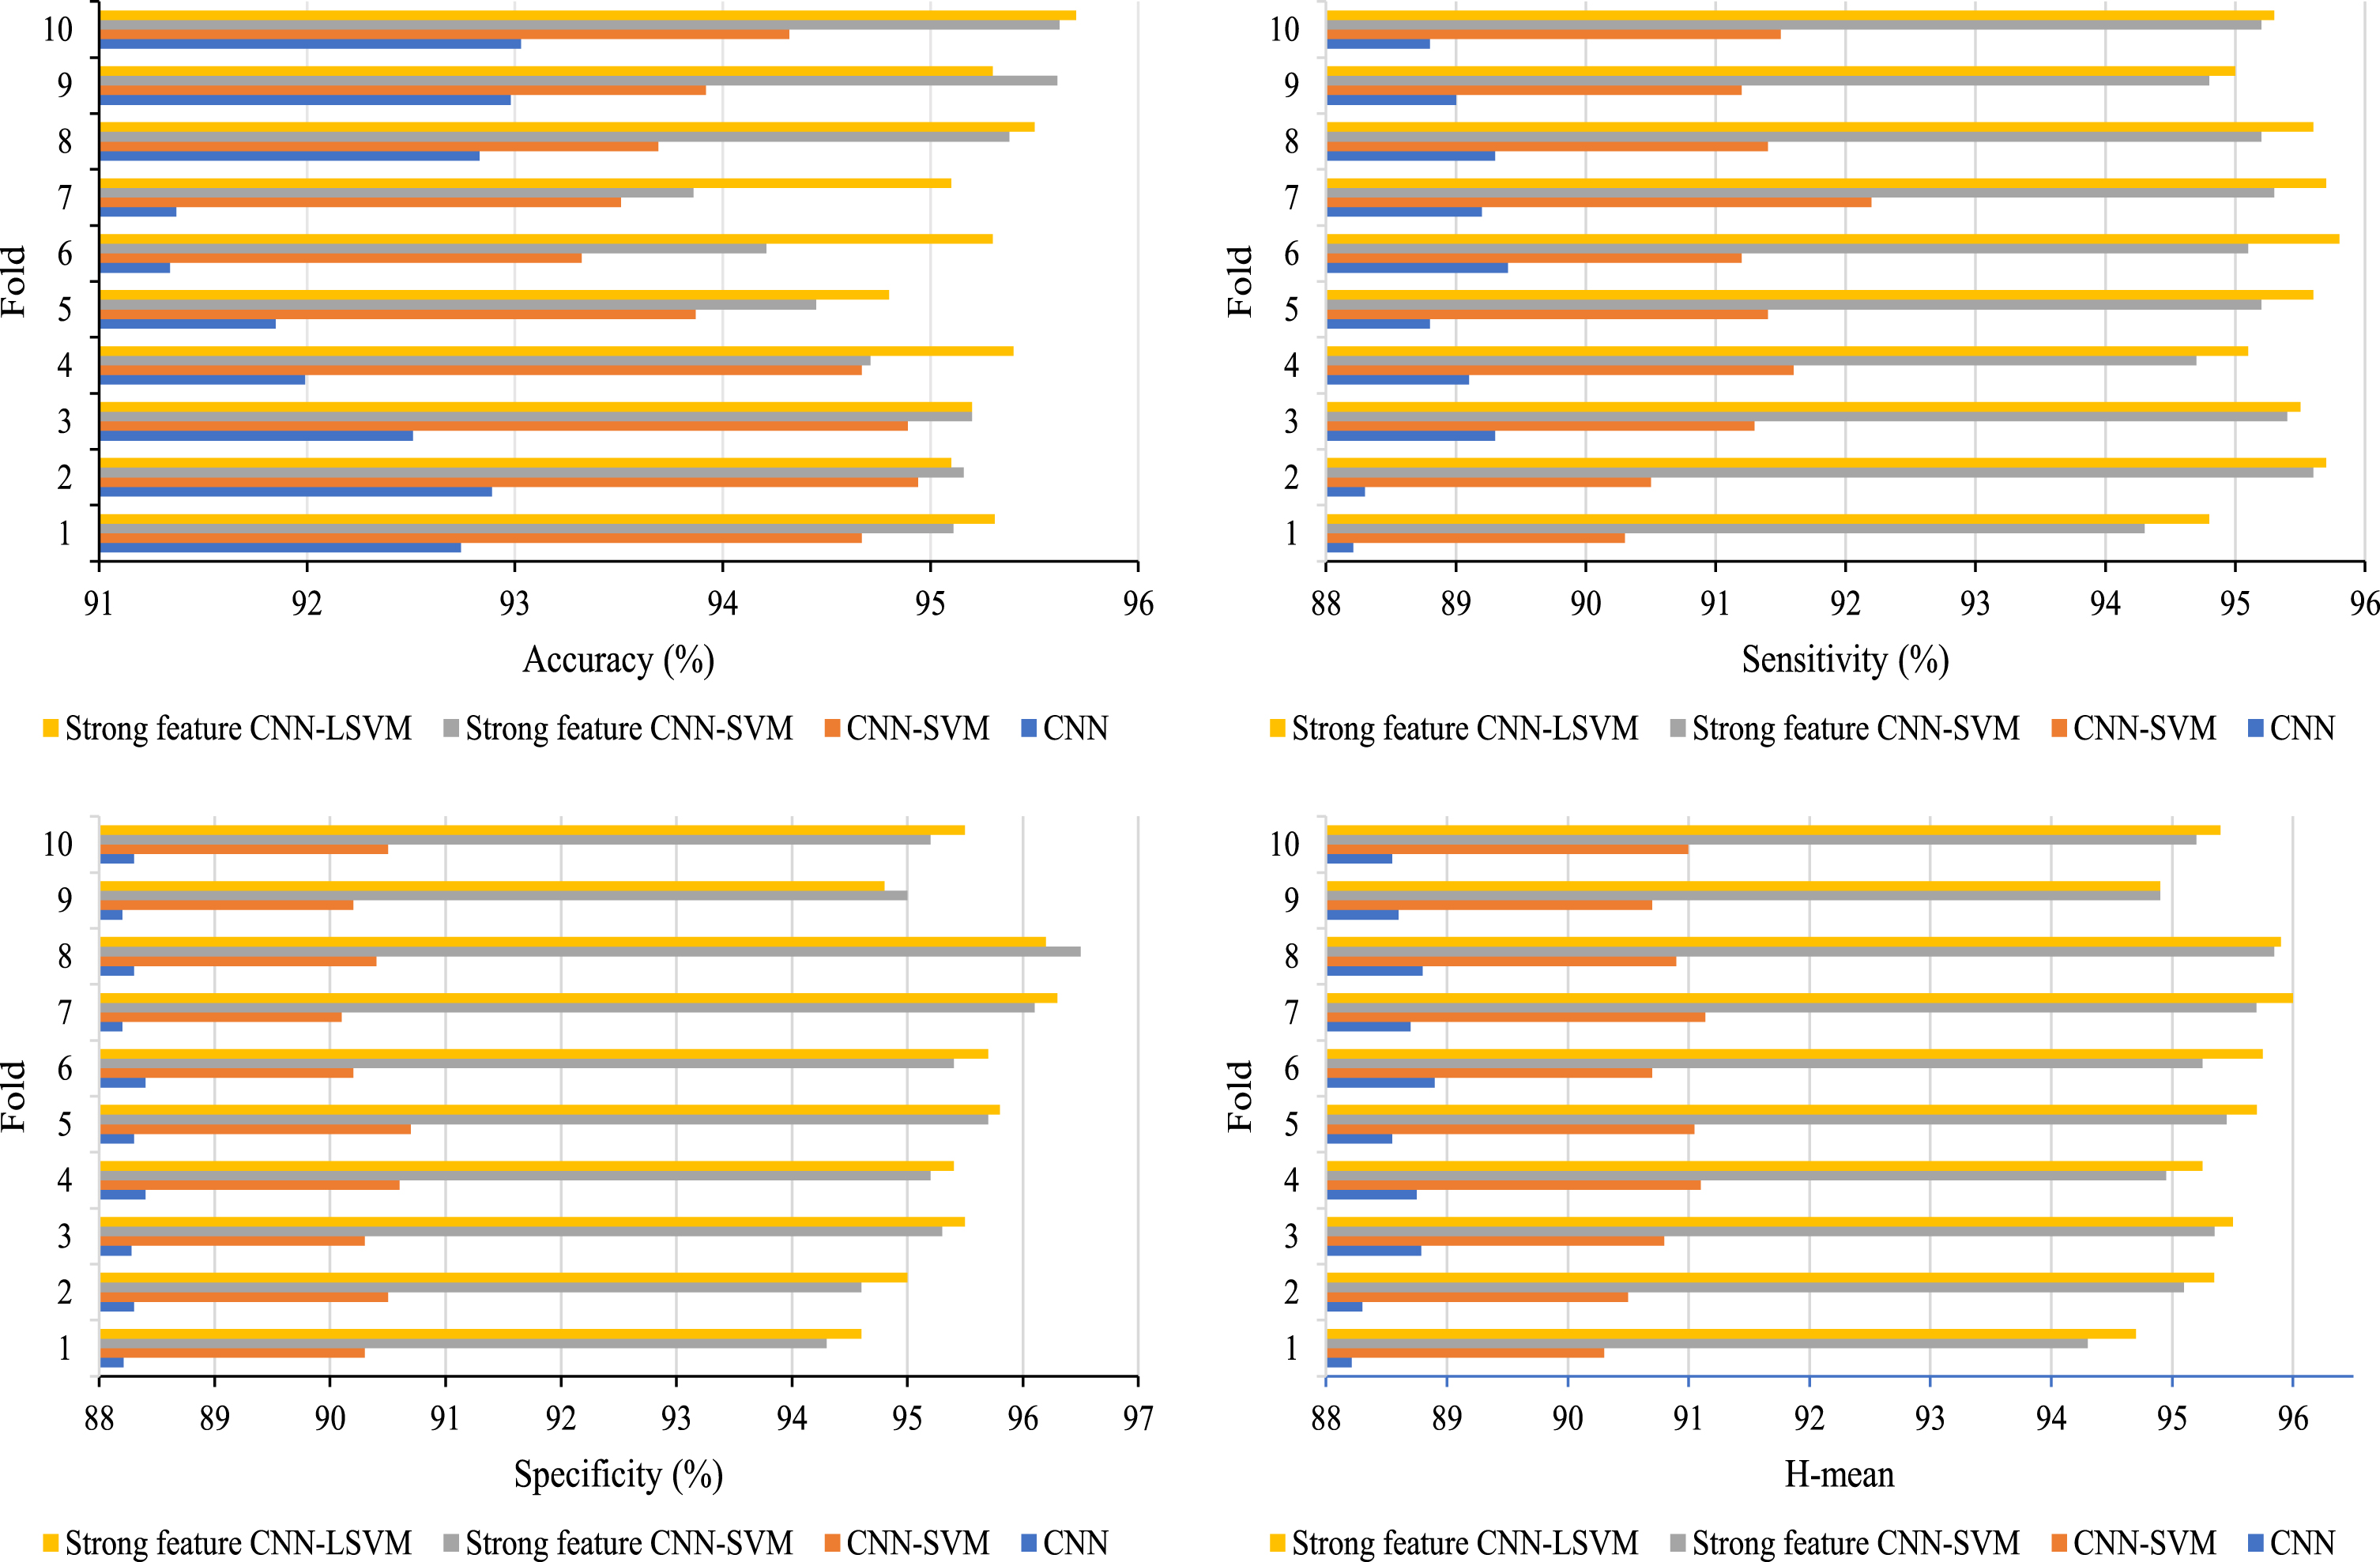
Proposed strong feature CNN-LSVM model derived from the LeNet-5 and SVM classifier, which are the baselines and can be applied solely to achieve the cell classification. Comparative experiments are conducted to illustrate the performance of the proposed model. Private dataset depicted in Table 1 are used, metrics are computed according to 10-fold cross-validation. Training batch size is set to 80, grid searching is used for the optimization. Fig. 13 shows the results.
Comparison results between proposed model and baselines.
It is concluded from the Fig. 13 that accuracy of the proposed CNN-LSVM model is higher than other three, which demonstrates that classification and generalization performance were improved by the reformative method of strong feature extraction and LSVM model with Adaboost. It can be seen from the figure that the strong feature CNN-SVM model is much better than the CNN-SVM model in all aspects of performance, which again shows that the introduction of strong features has a positive impact on classification. The introduction of strong feature strengthens the supervision effect of artificial experience, which significantly improved the generalization performance and addressed the poor robustness by injecting artificial cell features. Compared with the CNN-SVM model with strong features, the proposed model has a significant improvement in accuracy. The maximum difference was 1.5%. The sensitivity and specificity of the proposed model were improved by 0.3% and 0.15%, respectively. As for the sensitivity and specificity, proposed model gained the increase of 0.3% and 0.15%, respectively. This means lower rates of misdiagnosis and missed diagnosis in actual cervical cancer detection are achieved. Joining of Adaboost and combining method of strong feature extraction improved the performance including H-mean while ensuring the accuracy. Thus, our approach may contribute to clinical judgement to some extent.
Figure 14 reports the accuracy confusion matrix of different models. Proposed system achieved a higher accuracy for classification of positive and negative cells, with improvements ranging from 0.2% to 2.6%. Combining method of strong feature extraction and LSVM enhanced the generalization ability, meanwhile reducing the misjudgment of samples.
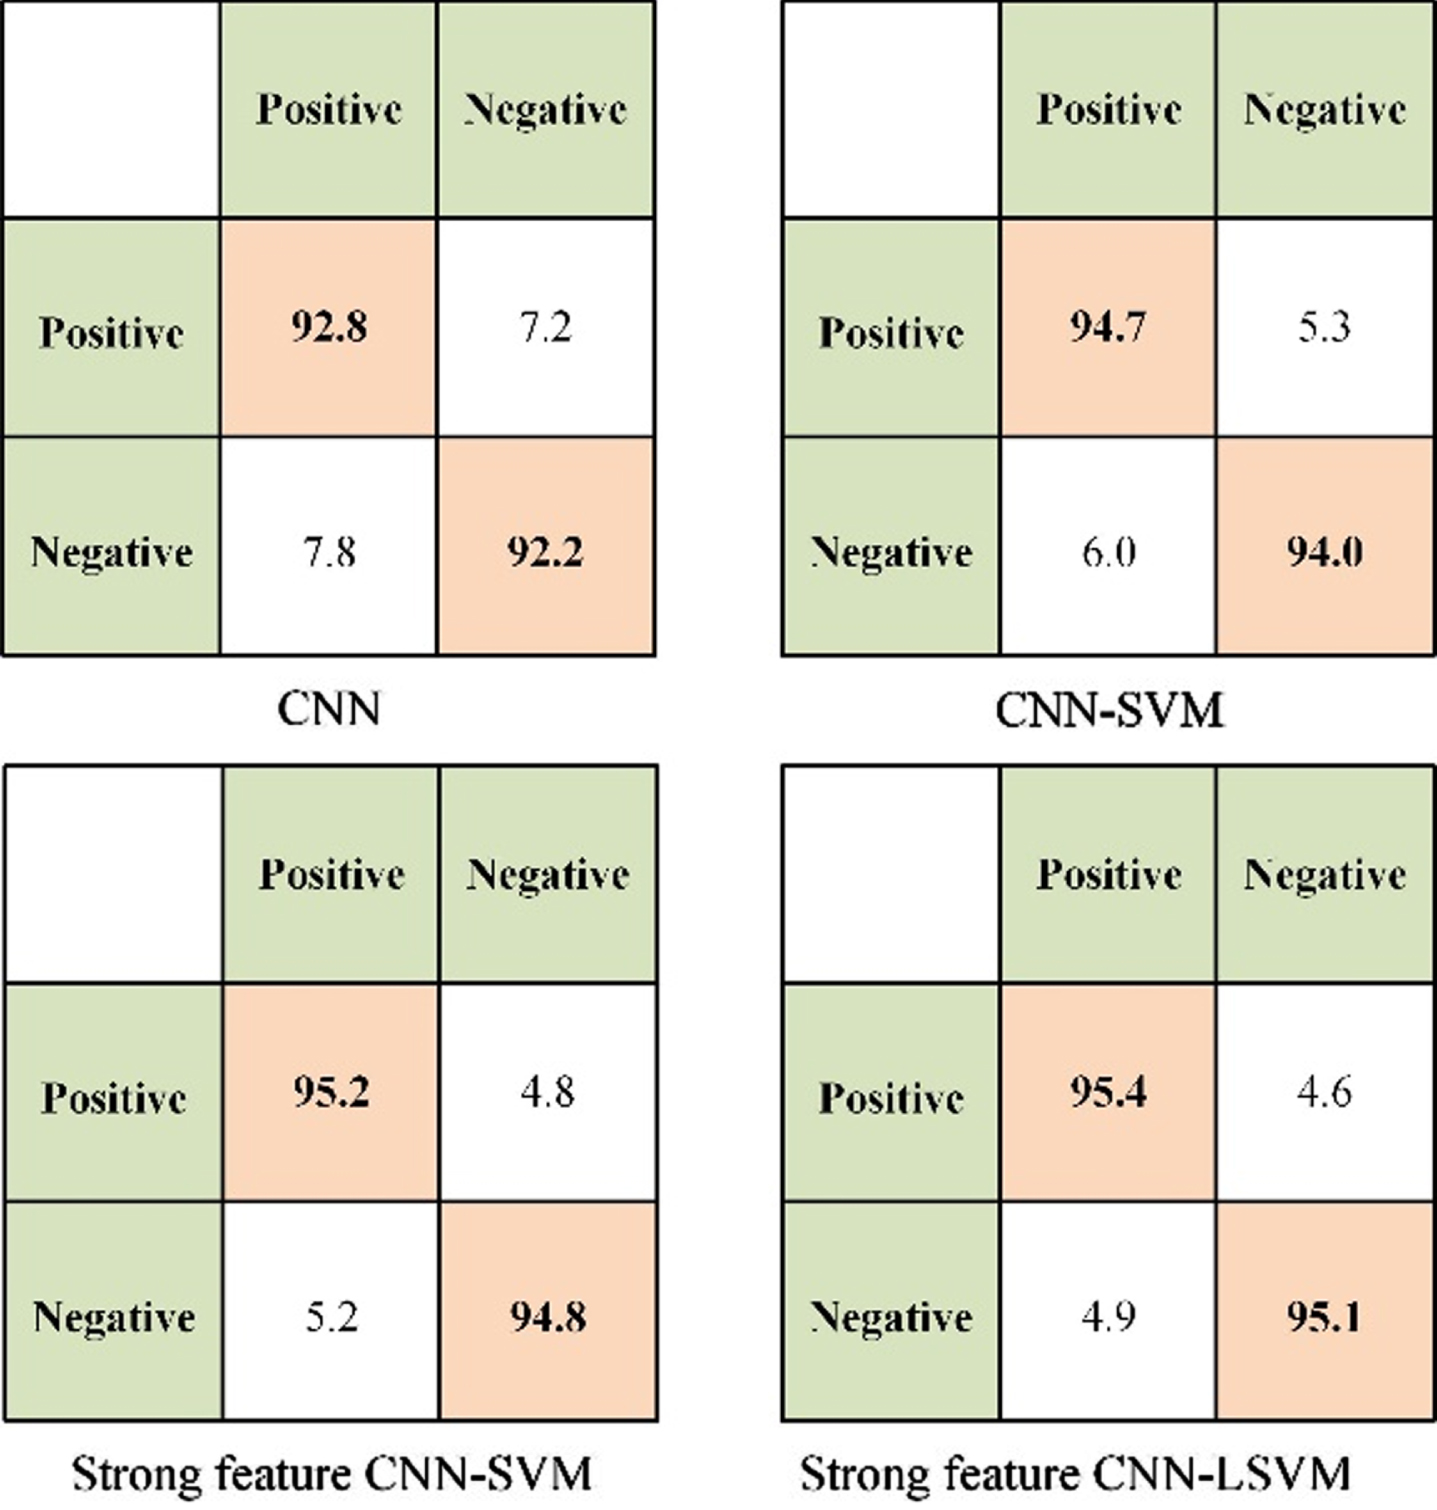
Confusion matrix of the proposed system and baselines.
Figure 15 shows the space complexity of CNN, CNN-SVM, strong feature CNN-SVM, and the proposal model in bytes. Values are obtained using Python 3.8.8, which will only be applied for comparison purposes. As can be seen from the picture. The strong feature CNN-SVM and the proposal model are significantly higher than the traditional CNN and CNN-SVM in terms of space complexity. The introduction of strong features and the addition of feature fusion make the model structure more complex and occupy more space. However, compared with strong feature CNN-SVM, the proposed model has no significant difference in space complexity. In order to avoid affecting the normal use of the model, we also made more considerations in the design process.

Spatial complexity comparison diagram.
In the comparative experiment, we can see that the introduction of strong features makes the system achieve higher accuracy in the classification of positive and negative cells, and the improvement value reaches 0.5%. The feature extraction combination used in this paper takes only 95s to process our private dataset while maintaining high accuracy. After feature fusion, we use linear discriminant analysis (LDA) to reduce the dimension of the fused features. The redundant information is removed and the computational performance of the classifier is improved. Finally, the combination of Adaboost and LSVM is attempted to avoid the overfitting caused by insufficient samples. It also achieves higher accuracy. In general, although the proposed algorithm has reduced the processing efficiency, its accuracy has been significantly improved.
Comparison of state-of-the-art models are conducted in order to evaluate the performance of the proposed model, it is tested on the private and Herlev dataset. Relevant results are as shown follows, which derived from the published work of authors in Table 8. Performance of different approaches are compared from multiple perspectives.
Performance comparison of proposed model and state-of-the-art approaches
Performance comparison of proposed model and state-of-the-art approaches
Table 8 shows that the strong feature CNN-LSVM model obtained second highest accuracy in 2-class classification with tiny difference and the best performance on 7-class classification, which denotes the superiority of the proposed model. The method in this paper obtained similar 2-calss result with [51], which applied CNNs trained with transfer learning and fine tuning to classify the Herlev cells. While proposed model outperformed their method in 7-calss classification, with an accuracy of 3% higher. As for the model in [52], our method achieved better metrics of 0.62%, 0.68% and 2.03%, respectively. Besides, time and space complexity of the proposed algorithm are relatively simple compared with [52]. Jith et al. [53] proposed CNN based on fine-tuned AlexNet, their model performed well and obtained the accuracy of 99.6%, which is 0.1% higher than our approach. While the gap between two methods is not big, our model structure is simpler and requires lower computation power compared with theirs. Strong feature CNN-LSVM model also behaved better than [54, 55], which applied transfer learning based CNN and pretrained CNN for cell classification. Accuracy of [54] is 0.2% lower than proposed method while transfer learning algorithm possesses high requirement on the scale and balance of dataset. Proposed model can be promoted with improved strong feature extraction, tuning of classifier and further augmentation on dataset.
A novel cervical cell classification frame based on strong feature CNN-LSVM with Adaboost was proposed. Strong features extracted by combining methods are integrated with features from LeNet-5, then the hybrid features are fed into the LSVM for cell classification. Through comparative experiments, we can see that the accuracy of this model is higher than that of CNN, CNN-SVM and strong feature CNN-SVM models. The average error of the model is between 0.5% 1.5%, which has higher generalization performance and robustness. Better evaluation was also achieved in the sensitivity, specificity and H-mean, which proved that the model had lower misdiagnosis and missed diagnosis rate in the actual cervical cancer cell detection. Finally, two independent datasets were evaluated for enhanced performance, and the accuracy of the proposed model for 2 classes and 7 classes was 99.5% and 94.2%, respectively, which was also better than the baseline and previous methods.
In the future, our model will be evaluated on more datasets to further improve the robustness and generalization ability of the framework. The system can also be enhanced by incorporating other hand-crafted features and applying new deep learning networks for the construction of hybrid model. In addition, our proposed deep network can be used in other areas of medical detection such as classification of patients suffering from Hepatitis C Virus or lung cancer diagnosis.
Declaration of competing interest
The authors declare that they have no known competing financial interests or personal relationships that could have appeared to influence the work reported in this paper.
Footnotes
Acknowledgment
We acknowledge that this research is supported by the Beijing Jiaotong University (grant 2022YJS020, W21ZZ200030 and W19L00130).