
Abstract
High-temperature components in power generation plant are exposed to creep, fatigue, and creep-fatigue environment during service. The components are usually under multiaxial state of stress condition. Understanding how the material behaves under these loading and environment is essential in order to sustain and keep the plant safe. The present paper aims to investigate the creep rupture and crack growth behaviours of P92 steel at 600 °C. For creep rupture test, notched bars with two different notch radii were prepared and tested under creep condition between 250 and 3500 hours at 600 °C, while the C-shaped specimen was prepared for fatigue and creep-fatigue crack growth tests. The material tested under creep condition showed notch strengthening effect where the life of notched bar specimen increased compared to smooth specimens when the net stress against creep time data was plotted. The effect was more significant as the notch radius decreased. It was also observed that the rupture life of all specimens was von-Mises stress controlled. Based on the fatigue test, it was found that the frequency in a range of 0.1 Hz–10 Hz was insignificantly affecting the crack growth rate. Under creep-fatigue, however, the material showed frequency-dependent behaviour. Observation on the fracture surface revealed that the ductile dimple associated with plasticity was dominant for all creep specimens. In addition, frequency independent specimen was associated with the transgranular fracture, thus flat appearance was evident, while fracture surface of frequency dependent specimen was roughly associated with intergranular fracture.
Nomenclature
Symbols Description
Initial, final crack length
Crack length-to-width ratio
Creep crack growth rate
Thickness, net thickness
Steady state creep cracking fracture mechanics parameter
Coefficient in Paris’ Law relation
Fatigue crack growth rate
Net diameter-to-radius ratio or notch acuity
Young’s Modulus for plain strain
Frequency
Stress intensity factor
Stress intensity factor range
Exponent in Paris’ Law relation
Number of cycles
Load, maximum load, minimum load
Inner, outer radius
Load or stress ratio
Temperature
Hold or dwell time, rupture time
Initial, final potential drop voltage
Geometry dependent parameter
Stress range
Axial creep displacement
Displacement
Skeletal maximum principal stress
Skeletal von-Mises stress
Introduction
Creep and fatigue and interaction between them in metals is a complex process involving several mechanisms which are not fully understood. Under combined variable loadings, more than one mechanism can occur at the same time, but they may operate independently on each other [3,22]. The equipment or component that operates at high temperature may be subjected to creep, fatigue, or creep-fatigue under multiaxial stress state induced by complex shape and loading direction [15]. In order to predict component life, it is essential to understand the material behaviour under abovementioned conditions.
The effects of multiaxial stress state on creep life have been widely investigated by performing creep test on notched bar specimen. Different notch radii are machined to introduce different levels of stress states which provide a range of material constraint against damage. Studies have shown that introducing the notch leads to strengthening effect or longer lifetime compared to a smooth specimen. The effect is more obvious as the notch radius decreases, however, it tends to saturate at very sharp notch [14]. The effect, however, is opposite at very long-term creep time or low stress level where notch weakening effect takes place, which may be attributed by the reduction in ductility and brittleness [2]. In another investigation, the skeletal von-Mises and maximum principal stresses have been adopted to define the representative stress in order to compare the life between notch bar and smooth specimen [4,9,25].
In real application, the component is not only subjected to purely creep environment. During engine start-up and shut-down, for instance, the material experiences continuous changes in load magnitude from constant to cyclic. In such cases, creep-fatigue behaviour has been taken into consideration by many researchers [13,19,34]. They agree that creep-fatigue interaction is one of the factors that contributes to the damage for many components in reactor, turbines, and pressure vessels operating at high temperatures [6]. The fatigue and creep-fatigue crack growth rates are influenced by many factors such as temperature holding time, frequency, strain range, strain, as well as microstructural differences such as in base metal, weld metal, and heat-affected zone (HAZ). Kim et al. [16] reported that the crack resistance in HAZ zone is less, thus the crack grows faster than weld and base metal. The effect is more significant as the holding time increases [17,32]. It implies that longer dwell time gives sufficient time for creep to occur and promotes the interaction between fatigue and creep. Obviously, creep effect during holding period cannot be simply disregarded.
The experimental results of creep-fatigue crack growth using fracture mechanics specimen have been widely reported. Razak et al. [1] performed creep-fatigue crack growth test at 600 °C and 625 °C using compact tension (CT) specimen employing holding time of 30, 60, and 600 seconds. The test was performed on as-receive and ex-service specimens, giving different microstructural properties. They reported that the contribution of creep on life cycle was only significant when the frequency was less than 0.01 Hz. Wang et al. [27] investigated creep-fatigue interaction behaviour in nickel-based superalloys at 900 °C using uniaxial-type notched sample. Interestingly, they found that the life cycle decreased with the increase of holding time, however, at 60–120 seconds, the life was slightly increased, which may be attributed by the decrease in the increment of inelastic strain. Investigation in bigger frequency range of 0.001–10 Hz and different material constraint using CT and corner crack tension (CCT) specimens has been performed on nickel-based superalloys [23]. The result showed that the crack growth occurred either through cyclic-controlled or time-dependent processes. When fatigue is dominant, linear elastic fracture mechanics description can be adopted to correlate the behaviour while the creep fracture mechanics parameter, C ∗, is the suitable parameter to characterize the cracking when the creep is dominant. In another investigation, creep-fatigue test on uniaxial sample has been performed. Alsmadi [5] studied the effect of temperature with varying holding time on Alloy 709 austenitic stainless steel and found that the cyclic life increase was attributed by the dynamic strain aging (DSA) during tensile hold period. Mao et al. [21] investigated the effect of various factors including temperature, holding time, and pre-fatigue on creep-fatigue life of P92 steel. They concluded that the temperature significantly affected the overall life of the material and the stress relaxation phenomenon was obvious as the holding time increased.
Even though many investigations on creep, fatigue, and creep-fatigue interaction have been carried out, which are not limited to the ones reported in the present article, however, only few studies on P92 can be found in the literature. Extensive data is required in order to develop a reliable prediction model which accounts all possible factors that affect the life through validation against experimental data. In the present work, the creep behaviour of P92 under the influence of multiaxial stress state, fatigue, and creep-fatigue crack growth behaviour at temperature of 600 °C has been investigated. Four notched bar specimens with two different notch radii have been machined and tested under creep condition, whereas C-shaped fracture mechanics specimen has been used for fatigue and creep-fatigue testing. The stress intensity factor range, ΔK, and the C ∗ parameter have been used to correlate the crack growth behaviour. The fracture surface of the broken specimen was also examined.
Materials and experimental setup
Materials and detailed dimension of specimen
The specimens used for the experimental testing were extracted from ex-service header. The material was exposed to the temperature of 540 °C for 22,000 service hours in a power plant. Spectrometric analysis was carried out to determine the chemical composition of the material. A sample of 20 mm × 20 mm was extracted, ground, and polished before being examined using the Oxford Foundry-Master spectrometer machine. Measurements were performed at five different locations and the average reading of weight percentage of each element was calculated. The summary of chemical composition of the investigated materials is shown in Table 1.
Chemical composition (%wt)
Chemical composition (%wt)
Figure 1 shows the detail dimension of the notched bar creep specimen used in this study. The overall length of the specimen was 92 mm. Double notches were machined to allow post-investigation to be performed on another unbroken notch. Both notches were 12 mm apart from each other. The creep rupture test was carried out according to the suggested test procedure ASTM E139-11 [12]. A dead-load creep machine was used to carry out the tests, which had a lever load ratio of 10:1. The electric furnace with temperature controller was used to provide a high-temperature environment around the specimen. Thermocouples were embedded in the furnace wall at three distinct locations: top, middle, and bottom zones so that the heat in each zone could be slightly adjusted to obtain uniform temperature inside the furnace. Two K-type thermocouple wires were locally attached to the specimen’s surface within the gauge region in order to directly measure and monitor the temperature during the tests. The temperature was monitored to be within ±2 °C throughout the test. The specimens were soaked for at least 24 hours to obtain stable high-temperature environment before the load was applied.
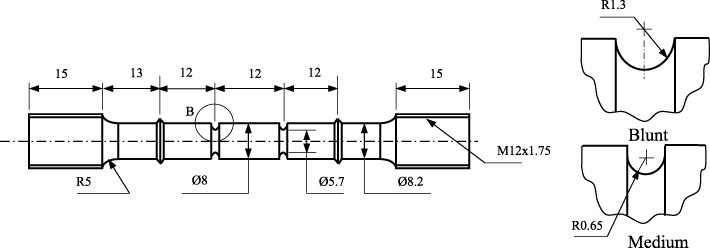
Dimension of the notched bar creep specimen.
The elongation of the material in the longitudinal direction was measured using linear variable differential transformer (LVDT) that was centrally clamped between two aluminium plates. During the load up, the readings from the LVDT were continuously recorded in the data logger for every 5 s, whereas during creep (after load up), the recording time increased to 300 s. The elongation of the specimen was monitored and the test was stopped when the specimen was broken.
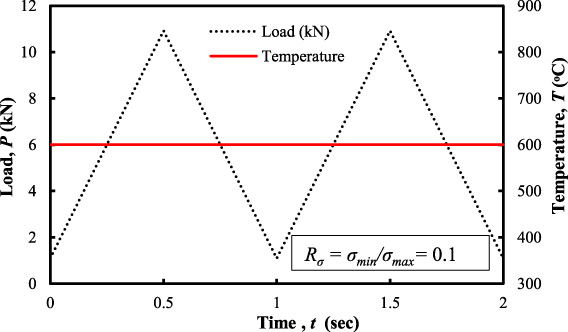
Figure 2 shows the dimension of C-shaped specimen used for fatigue- and creep-fatigue crack growth test. The potential difference (PD) output wires were spot welded 2 mm offset (top and bottom) from the electrical discharge machining (EDM) crack and side-surface of the specimen in order to measure the voltage or resistance between the two crack planes. The output value was used to estimate the crack length. To resist excessive current from flowing into the machine, the adapters and pins were coated with high temperature black paint. The pins and adapter were sprayed with black paint and were baked for 30 minutes at the temperatures of 120 °C, 200 °C, and 315 °C. There was a 30-minute cooling period between each baked temperature. The process was performed to cure the paint before the actual test in order to substantially increase the durability of the paint finish. Figure 3 shows load waveform employed in the creep-fatigue test while Fig. 4 shows the experimental setup. The test matrix, which includes the specimen ID, load levels, temperature, crack length-width ratio, and hold time (for creep-fatigue crack growth, CFCG test) is shown in Table 2.

Dimension of the fatigue- and creep-fatigue crack growth specimen.

Employed waveform in creep-fatigue test.
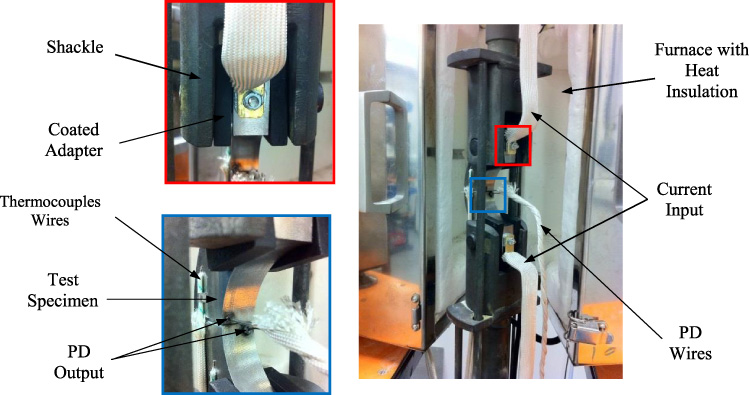
Creep-fatigue experimental setup.
CFCG test matrix
For cracked C-shaped tension (CS(T)) specimen, the instantaneous crack length was measured using the direct current potential difference (DCPD) technique. The crack length was determined by the assumption that the material resistance decreased (therefore the voltage increased) as the crack progressed. The test was stopped before the test specimen was totally broken or when the crack growth started to accelerate towards rupture. The indicator was when the PD and displacement measurement shifted from showing stable reading. Once the test was stopped, the samples were half-sliced normal to the crack plane using the EDM. The first half was used to examine the damage development in the material and the area around the crack tip while the other half was split open to measure the initial crack length, a
o
, and final crack length, a
f
, as well as for fractography observation. The split open procedure was performed at room temperature by high frequency fatigue loading. The crack length was determined based on the average of nine measurements at different points along the crack front. The crack extension, Δa, was calculated by subtracting the initial crack length from the final crack length value. Knowing the initial, V
o
, and final, V
f
, PD voltages and assuming linear relationship between PD voltage output and the crack length, the instantaneous crack length, a, at time, t, can be estimated using the following equation:
During the testing, the load, potential drop, and load-line displacement (LLD) data were logged since the information was required to determine the C
∗ and K. Experimentally, the C
∗ can be calculated using:
Load-line displacement data was required in order to determine the C
∗ experimentally. Two commonly used methods to measure the LLD are using the LVDT and/or capacitance gauge attached at the crack mouth of the specimen. In the present study, the former method was employed. It should be noted that the LLD data obtained from the experiment consisted of creep, Δ
c
, and elastic, Δ
e
, components (plastic component of LLD is generally small and can be neglected). Based on LLD and crack length data, the LLD rate and crack growth rate were calculated using seven-point incremental polynomial method. The validity criteria of
Load-controlled fatigue crack growth tests had been performed on CS(T) specimens at 600 °C according to the standard test procedure ASTM E647 [8]. Fatigue Crack Growth (FCG) test was performed at three different frequencies of 0.1 Hz, 1.0 Hz, and 10 Hz. The specimens were tested under tension-tension load control with the load ratio, R
𝜎 = 0.1 (P
min
∕P
min
). The FCG test was carried out using servo-hydraulic test machine and the triangular waveform was applied. The test specimen was loaded at the pin holes with the initial stress intensity factor range, ΔK, of 22.5 MPa(m1∕2). The stress intensity factor, K, for C-shaped specimen can be defined based on linear elastic fracture mechanics (LEFM) theory given by Eq. (5). Similar to creep and creep-fatigue tests, the PD wires were spot welded on the specimen surface in order to estimate the crack length. The temperature was measured using the thermocouples attached to the specimens. After the test, fracture surface was examined using scanning electron microscope (SEM). Table 3 shows the FCG test matrix, while Fig. 5 shows the employed loading waveform in FCG test.
Creep deformation and rupture of notched bar
Varying the notch radius induced different stress state levels, therefore its influence on creep behaviour can be examined. A total of four notched bars with two specimens for each notch radius (blunt and medium) were tested under the creep environment at 600 °C. The test lasted between 250 and 3500 hours. All tested specimens were broken only at one notch while the other notch remained intact. It can be noted that initially, the NB01 specimen was loaded with 𝜎 n = 180 MPa for 3000 hours. The stress level was found to be very low after 3000 hours, and only a slight deformation was observed. To ensure that the specimen failed within the timespan limit, the test had to be stopped before it was re-started with higher 𝜎 n = 240 MPa until fracture. As a result, the specimen was expected to have slightly higher rupture life time compared to the value reported in Table 4.
FCG test matrix
FCG test matrix
Triangular loading forms employed in FCG test (F = 1.0 Hz).
Figure 6 shows the axial displacement, 𝛿, against time at different stress levels for all specimens. The displacement at gauge length point was plotted instead of strain. This was due to complex stress distribution particularly near the notch region; therefore the displacement at the gauge length, which was directly measured during the test, cannot be simply linked to a creep strain.
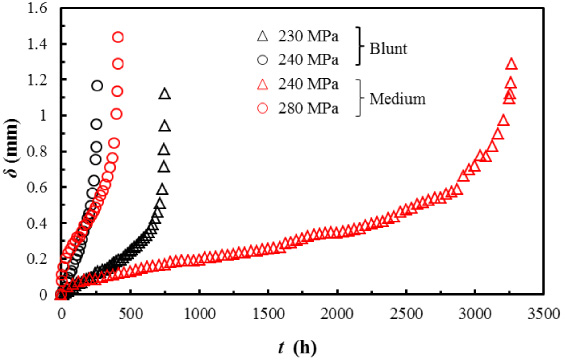
Axial displacement against time of notched bar at 600 °C.
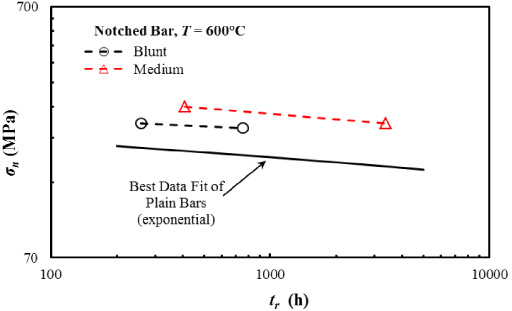
Figure 7 shows the time to rupture data with respect to net section stress. The best fit curve of plain specimen data collected from published literature is also plotted on the same figure for direct comparison to the notched bars. Clearly, at the same net section stress level, the notch bars rupture at a longer time due to the notch strengthening effect. For notched bar, the von-Mises stress across the notch plane is usually lower than the nominal net section stress [33], therefore, notch strengthening effect should be expected. As notch strengthening was observed experimentally, it showed that the rupture of the current notched bar test was controlled by the von-Mises stress. In fact, when comparing the notched bars, for example at 𝜎 n = 240 MPa, the time to rupture of medium notch was approximately 13 times longer compared to blunt notch. Even at higher stress of 𝜎 n = 280 MPa, the medium sample fractured at longer time compared to the blunt notch at lower stress of 𝜎 n = 240 MPa.
In order to compare the results of creep tests between smooth and notched specimens, the equivalent stress, such as von-Mises and principal stress, has to be considered as an alternative to the net section stress. Due to complex stress distribution, the concept of skeletal point can be used to estimate the stress field of notched bar specimen. According to this concept, there was a point (along the notch throat plane) where the stress value was constant regardless the creep index, n. Various stress fields with respect to the net section stress, including the von-Mises, maximum principal, and hydrostatic stresses, have been estimated based on comprehensive finite element analysis and the values are systematically presented in [28].
Creep rupture data of all tested notched bars.
Figure 8(a) and (b) presents the plot of time to rupture against skeletal von-Mises and maximum principal stress, respectively. All the notched bars (blunt and medium) fall on the mean data curve of plain specimen, proving the rupture is von-Mises controlled. In contrast, the rupture data are randomly distributed when plotted against skeletal maximum principal stress. However, the significant drop in creep strength of notched bars that is usually observed in long term [24] was not observed due to the insufficient long-term experimental data.
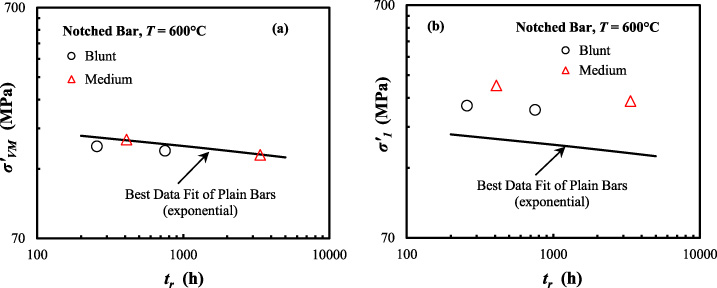
Creep rupture data of all tested notched bars as a function of (a) skeletal von-Mises stress and (b) skeletal maximum principal stress.
Summary of rupture test on notched bars at 600 °C
Since the cross sectional area within the gauge length of notched bar was not uniform, the ductility for the particular specimen was calculated based on the reduction of area, ROA. The final diameter, d f , was measured after the test, and is presented in Table 4.
The fracture profile of notched bar with two different acuities presented in Fig. 9 shows the influence of geometrical constraint on the ductility (in terms of reduction of area, ROA). Under lower stress, the material tends to fracture in creep brittle-manner with reduced ductility. Looking at Fig. 9(a) and (b), it can be seen that the sample with higher stress and acuity has lower ductility compared to the sample with lower stress and acuity.
In terms of test duration, the samples with the same acuity show a decrease in ductility as the rupture time increases. However, the comparison cannot be made between different acuities. For instance, the blunt sample NB_230_4.37 fractured in longer time but had higher ductility compared to medium notch sample NB_280_8.75, which braked at relatively shorter time. In this case, the difference in constraint between the two notched-type significantly influenced the ductility.
Further investigation on fracture morphology of NB_230_4.37 and NB_280_8.75 samples showed that number of ductile dimples associated with plasticity was dominant at the centre and edge positions. For NB_280_8.75, although with higher acuity of the voids, it was not clearly observed probably due to insufficient creep time for the voids to nucleate and growth. Figure 9(c) provides a close-up display of the fracture surface at the edge and centre positions of NB_240_8.75 specimen. The ductile dimples remained in the centre, but at the edge, smoother surface appearance with brittle-like fracture in some places was evident. Under multiaxial stress state, at longer time, the fracture mechanism tends to shift from ductile to brittle fracture, which eventually reduces the creep ductility. Moreover, examination on the region close to fracture surface at longitudinal section found that for NB_280_8.75 and NB_240_8.74 samples, the voids were found to be located along the notch throat and slightly in higher density close to the notch root. In contrast, for NB_230_4.37, the void mostly concentrated at the notch centre.
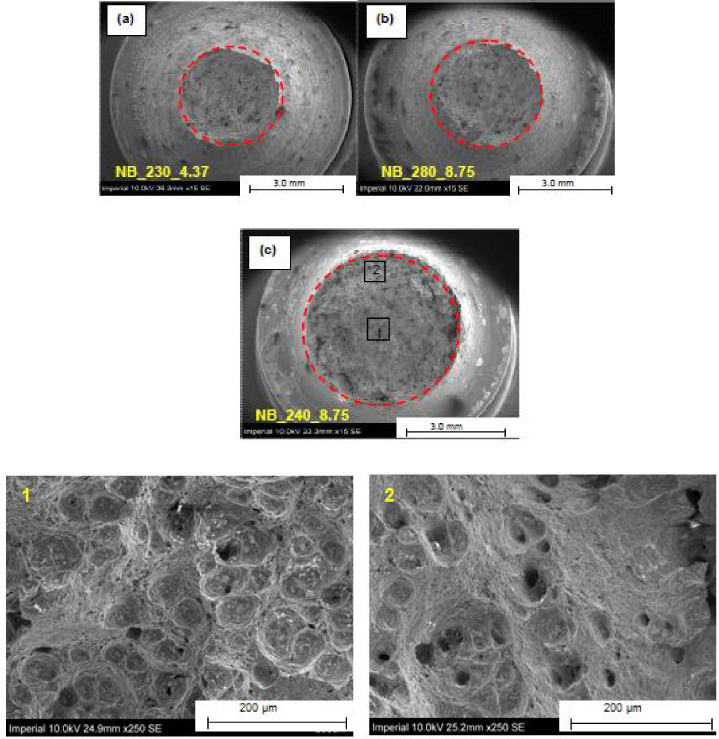
Fracture profile of notched bars (a) t r = 750 h, 𝜎 n = 230 MPa, (b) t r = 409 h, 𝜎 n = 280 MPa and (c) t r = 3264 h, 𝜎 n = 240 MPa.
Even though the discussion in this paper depends on the results from very limited creep samples, the observation clearly demonstrates that both time and geometrical constraints must be taken into account when determining the multiaxial ductility, as in the case of notched bar. The conventional method directly estimates the multiaxial ductility based on various multiaxial strain factor versus triaxiality factor relationship (as proposed by various void growth models [10,24,26]), therefore, the lifetime when predicting the long-term creep rupture time may be overestimated. To improve the prediction, consideration is needed for the reduction in ductility at longer creep time which cause to the additional local constraint due to creep void development and other microstructure degradation processes.
The characteristics of crack growth are shown in Fig. 10(a), while the load line displacement (LLD) under creep-fatigue loading condition is shown in Fig. 10(b). The horizontal-axis has been normalized so that the characteristics of crack growth and LLD can be clearly seen for all cases when the data is plotted in the same figure. N f is the number of cycles at the test duration time, t f . Note that t f is the time when the test was interrupted which corresponded to a point of significant crack growth rate. Plotting in this manner, the crack growth and LLD data show insignificant difference in the trend except during the accelerated region. It should be noted that the value of crack growth length at t f for FCG specimens was higher compared to the one tested under CFCG. It was also found that the crack started to grow as early as the load was applied. Moreover, the LLD against time shows a similar shape as creep strain accumulation in a uniaxial test.
Table 5 summarizes the fatigue and creep-fatigue experimental results. Clearly, the test duration time increases as the frequency decreases.
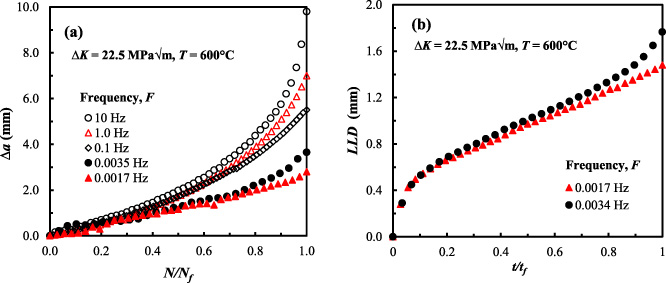
Characteristics of (a) crack growth under fatigue and creep-fatigue and (b) load line displacement under creep-fatigue.
Figure 11(a) shows the plot of crack growth rate, da∕dN, against stress intensity factor range, ΔK. Under pure fatigue loading, the frequency seems to show an insignificant effect on the fatigue crack growth rates at the frequency range of 0.1–10 Hz. The Paris’ Law relation as described in Eq. (8) is commonly used to correlate the FCG data in the secondary or stable crack growth region. The regression fit using this relation for the steels is also included in Figure 11(a), which gives the value of
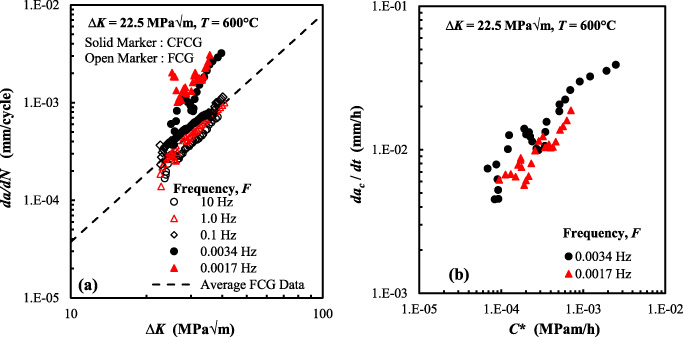
(a) Crack growth rate against ΔK and (b) creep-fatigue crack growth.
Summary of fatigue and creep-fatigue crack growth experimental results at 600°C.
Frequency dependence of crack growth rates for P92 steel was examined. Figure 12 shows the crack growth rate, da∕dN, against frequency at constant, ΔK = 35 MPa m. Under pure fatigue loading, crack growth rate shows no influence of frequency. The da∕dN value is approximately constant at 6.5 × 10⁻⁴ mm/cycle in the frequency range of 0.1–10 Hz. However, under creep-fatigue, the crack growth rate is sensitive to the test frequency and holding time. Negative correlation between crack growth rate and frequency is observed. Similar behaviour has been reported in literature at a wider temperature range [30,31]. In this study, the transition between frequency dependent and frequency independent regions is found to occur at approximately 0.05 Hz. The creep-fatigue interaction can be related to the relative creep zone and cyclic plastic zone, depending on the holding time [29]. Under pure fatigue loading or short hold time, cyclic plastic zone is dominant, resulting in fatigue dominating cracking. When the hold time is longer, the creep zone size is larger in relation to the cyclic plastic zone. As a result, the effect of fatigue on crack growth is insignificant and negligible. Moreover, it has been found that the transition frequency, where the change in fracture mode occurs, depends on the test temperature [20]. Higher temperature leads to higher transition frequency.
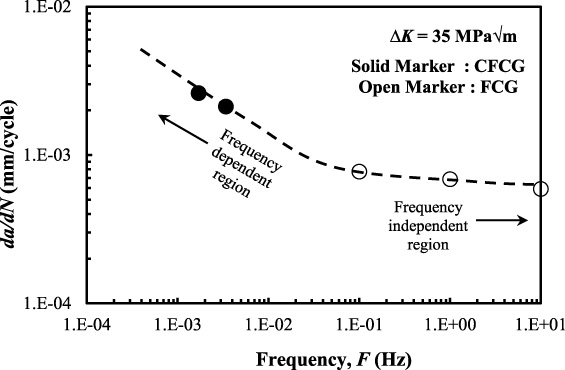
Effect of frequencies on the crack growth rates.
After the test, the fracture surface of two specimens with extreme conditions (10 Hz and 0.0017 Hz) was examined. Observations of the micrographs revealed that the fracture of frequency of independent specimen was associated with the transgranular fracture, thus flat appearance was evident. The numbers of secondary cracks were also observed. In contrast, fracture path of the frequency dependent specimen was rougher and intergranular as shown in Fig. 13. For this specimen, the fatigue striations could not be found. This suggested that the frequency independent region was controlled by fatigue and the frequency dependent region was dominated by creep. The presence of the intergranular fracture due to creep corresponded to an increase in the crack growth rate as shown in Fig. 11(a).
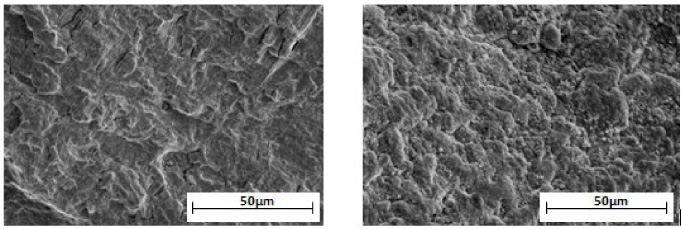
Fracture surface of the P92 steel (a) tested under FCG condition at frequency of 10 Hz and (b) tested under CFCG condition at frequency of 0.0017 Hz.
The creep rupture and deformation behaviour of notched bar have been investigated at a temperature of 600 °C. In addition, the ductility of the material in terms of ROA has been determined. At 600 °C, notched bar exhibits a notch strengthening effect in which the creep life is longer than plain specimen at given net section stress. The effect is more significant at higher acuity or smaller notch radius. Examination on the fracture surface found that the ductile dimple fracture associated with plasticity is dominant. However, at low stress and small notch radius, a brittle-like fracture is observed at the location close to notch root. In addition, it is found that creep rupture life is controlled by von-Mises stress.
FCG rate during stable crack growth against ΔK for P92 steel obeys Paris’ Law relation with the slope
Footnotes
Acknowledgements
The authors would like to express their gratitude and thanks to Ministry of Higher Education (MOHE) Malaysia for funding this research under the Fundamental Research Grant Scheme FRGS/1/2019/TK03/UMP/02/2 (RDU1901107). Special acknowledgement to Imperial College London in providing the lab facilities for high-temperature testing.
Conflict of interest
None to report.