
Abstract
BACKGROUND:
Diagnostic quality of computed tomography (CT) images depends on numerous factors. Recently, two different modalities were introduced for coronary CT angiography (CCTA).
OBJECTIVE:
This study aims to compare the performance of 16 cm wide-coverage detector CT (WDCT) using the snapshot freeze technique with a new-generation dual-source CT (DSCT) with 66 ms temporal resolution for CCTA.
METHODS:
Total 101 patients with suspected coronary heart disease were enrolled. Of these, 50 and 51 patients were examined on WDCT and DSCT, respectively. CT values, image noise, signal-to-noise ratio, and contrast-to-noise ratio were measured. The image processing efficiency was recorded, followed by statistical comparison of diagnostic accuracy and radiation dose.
RESULTS:
Ninety-nine patients (98.02%) had satisfactory diagnostic image quality. DSCT was significantly better than WDCT in terms of quantitative image quality, image processing efficiency, and qualitative analysis (P < 0.05). However, radiation dose was significantly lower on WDCT (P < 0.05) as compared to DSCT.
CONCLUSIONS:
Image processing efficiency and image quality of CCTA was higher on DSCT compared to WDCT due to the limitation of maximal tube current of WDCT.
Abbreviations
Wide-coverage detector CT Dual-source CT Coronary CT angiography Coronary artery disease Heart rate Electrocardiography Standard deviations Aortic root Proximal left coronary artery Middle left coronary artery Distal left coronary artery Proximal right coronary artery Middle right coronary artery Distal proximal right coronary artery Perivascular adipose tissue Region of interest Contrast-to-noise ratio Volume CT dose index Dose length product Effective dose Body mass index Snapshot freeze
Introduction
Coronary computed tomography angiography (CCTA) is an accurate and beneficial imaging modality for the noninvasive detection of coronary artery disease (CAD) [1–3]. CCTA is used to assess various cardiac pathologies with a wide range of indications [4]. The quality of diagnostic CCTA images is dependent on numerous technical factors, including hardware, software, and acquisition protocols, which have seen immense development in the past decade [1]. In 2017, 16 cm wide-coverage detector CT (WDCT) and a new-generation dual source CT (DSCT) became available for users. The 16 cm wide-coverage detector CT enables 160 mm longitudinal coverage with temporal resolution of 140 ms and allows data acquisition in a single cardiac cycle [5]. While, the new generation DSCT allows a faster gantry rotation time of 0.25 s resulting in a temporal resolution of 66 ms per image with a wider detector coverage acquiring 192 slices [6]. Vendors advertised their scanners as the priority scanner for users requiring CCTA. Since there were two choices, both of almost equally good quality, the choice was difficult to make.
Thus, since no previous studies have reported a comparison between WDCT and the new-generation DSCT for CCTA, in order to address this issue and make a comparison, this study aimed to investigate the best choice of scanners for patients in terms of body size, image quality, and radiation dose.
Materials and methods
Patient population
This prospective study was approved by the local ethics committee with a waiver for acquiring informed patient consent. Authors had access to information that could identify individual participants during or after data collection. A total of 101 patients with suspected coronary heart disease undergoing CCTA in our hospital from January 2018 to August 2018 were enrolled. The patients were randomly divided into group A (N = 50) and group B (N = 51). The exclusion criteria were as follows: (1) patients allergic to iodine contrast agent; (2) patients with severe hepatic and renal insufficiency; (3) patients with decompensated cardiac insufficiency; (4) patients who took drugs to control heart rate (HR) before the examination; and (5) patients with severe arrhythmia, or who could not hold their breath, or who underwent coronary artery bypass grafting; and (6) patients with a long stent affecting the CT value measurements.
Image acquisition
Electrocardiography (ECG)-triggered volume CCTA was performed for group A individuals during one heartbeat using a 16 cm WDCT (Revolution CT, GE Healthcare, WI, USA). The scanning parameter was 256×0.625 collimation. Detector coverage was smart coverage (80–160 mm) based on the scout image with a matrix size of 512×512 pixels and a reconstruction slice thickness and slice interval of 0.625 mm. The gantry rotation speed was 0.28 s/rot with an automatically selected tube voltage of 80, 100, or 120 kV by kV assist and SmartmA (40–999 mA) based on the scout image of the patients. The data acquisition window was set using the auto-gating technique. The R–R interval was selected automatically according to the patient HR. For each patient, HR was recorded as an average mean for only counting the cycles with X-ray on. A SmartPrep (GE Healthcare) was used. Threshold monitoring was set at the aortic root, with an enhancement threshold of 150 HU and a delay time of 3.5 s.
The new-generation DSCT scanner (Somatom Force, Siemens, Healthcare, Forchheim, Germany) was used for group B individuals, where the collimation was 2×96×0.6 mm and the rotation time was 0.25 s/rot. The scan range of both groups started from the lower part of the protuberance of the tracheal bifurcation to the diaphragmatic surface of the heart, and scanning was performed from the cranium till the cauda. A prospectively ECG-triggered sequential CCTA with automated tube current modulation and tube potential selection (CAREDose4D and CAREkV) was the standard of care to keep the radiation dose as low as possible. The range of exposure dose (ECG-pulsing) was 35% –80% in the R–R interval. The bolus tracking technique with ionic contrast agent was used. Threshold monitoring was set at the aortic root, with an enhancement threshold of 80 HU and a delay time of 7 s.
The delay time and the enhancement threshold were recommended by each vendor’s specialist. Specifically, contrast medium (Iopamiro, 370 mgI/mL, Bracco, Italy), 0.7 mL/kg, was injected at a certain flow rate based on patients’ weight and vein conditions, followed by 30 mL of saline using the Ulrich high-pressure syringe. The elbow vein was injected with the contrast agent and saline using a 20 G closed intravenous catheter system.
Image reconstruction
For WDCT, the optimal reconstruction phase with a slice thickness of 0.625 mm and an increment of 0.625 mm was chosen using a scanning system automatically (Smart Phase technique, GE Healthcare). For vessel segments with apparent motion artifacts, snapshot freeze (SSF) technology was applied, which could integrate image information from adjacent cardiac phases within a single cardiac cycle to characterize and compensate for coronary artery motion and get better images. All images were reconstructed using both standard algorithms and SSF with 80% of adaptive statistical iterative reconstruction-V (ASIR-V, GE Healthcare) on the target phase with the least motion artifacts.
For the third generation DSCT, the optimal phase (end-systolic or end-diastolic) of coronary artery display was reconstructed automatically using the console. A B40v kernel with advanced modeled iterative reconstruction strength 3 with a slice thickness of 0.6 mm and an increment of 0.6 mm was used. After image reconstruction, all images were analyzed using the AW 4.7 Advantage Workstation (GE Healthcare). In addition, the waiting time before the images were ready to use was recorded as the efficiency of image processing.
Quantitative analysis
The CT values and standard deviations (SD) of the lumen of the aortic root (AO), proximal left coronary artery (LCA-P), middle left coronary artery (LCA-M), distal left coronary artery (LCA-D), proximal right coronary artery (RCA-P), middle right coronary artery (RCA-M), distal proximal right coronary artery (RCA-D), and perivascular adipose tissue (PVAT) were measured thrice each by two independent observers. The average value obtained from both observers was used for further analysis. The region of interest (ROI) of the AO was set to 90 mm2, and the others were set to 1 mm2. Image noise was determined as the SD of attenuation in the ROI in the AO. The signal-to-noise ratio (SNR) was calculated as CT value divided by noise and contrast-to-noise ratio (CNR) as CT value minus CT value of PVAT divided by SD of PVAT.
Qualitative analysis
Double-blind scoring was performed using axial images and volume reading by two independent radiologists (one with 8 years of experience in cardiovascular diagnosis and the other with more than 20 years of experience) and the American Heart Association (excluding intermediate branch) segmentation standard using 15 segments (1975) was adopted. The 5-point Likert Scale was as follows: 1 point was worst, where the blood vessel outlines were not clear for accurate diagnosis; 2 points denoted poor, where most of the blood vessel outlines were not clear to perform diagnosis; 3 points denoted moderate, where the blood vessel outlines could be distinguished, and diagnosis was possible, but the accuracy might be affected; 4 points denoted good, where most of the blood vessel outlines were clear, with only a few constructed defects, which basically did not affect the diagnosis; and 5 points denoted excellent, where the blood vessel outlines were clear with no constructed defects, and had no effect on diagnosis. Images that were ≥3 points were considered diagnosable, which indicates that the image quality did not affect the diagnosis. During the image analysis, individual adjustment of the window center and window width level settings was allowed.
Diagnostic accuracy
All CCTA examination reports were approved independently by a radiologist (with 20 years of experience in cardiovascular diagnosis). The patients with suspected stenosis were picked out. Subsequently, a third observer (with 10 years of experience in cardiac CT image acquisition and image processing) measured the stenosis rate of each patient from axial images combining volume rendering, maximum intensity projection, curved planar reconstruction, and multiplanar reconstruction [1, 7] on the AW 4.7 workstation (GE Healthcare), which provided a freehand measurement for stenosis application (Fig. 1). Double references (both proximal reference and distal reference) were set on the proximal and distal sides of the plaque in the lumen. The stenosis rate was calculated as the mean area; 0% denoting no visible stenosis, 1–24% as minimal stenosis, 25–49% as mild stenosis, 50–69% as moderate stenosis, 70–99% as severe stenosis and 100% as occluded, based on the Coronary Artery Disease - Reporting and Data System (CAD-RADS). Each measurement was compared with the CCTA report.
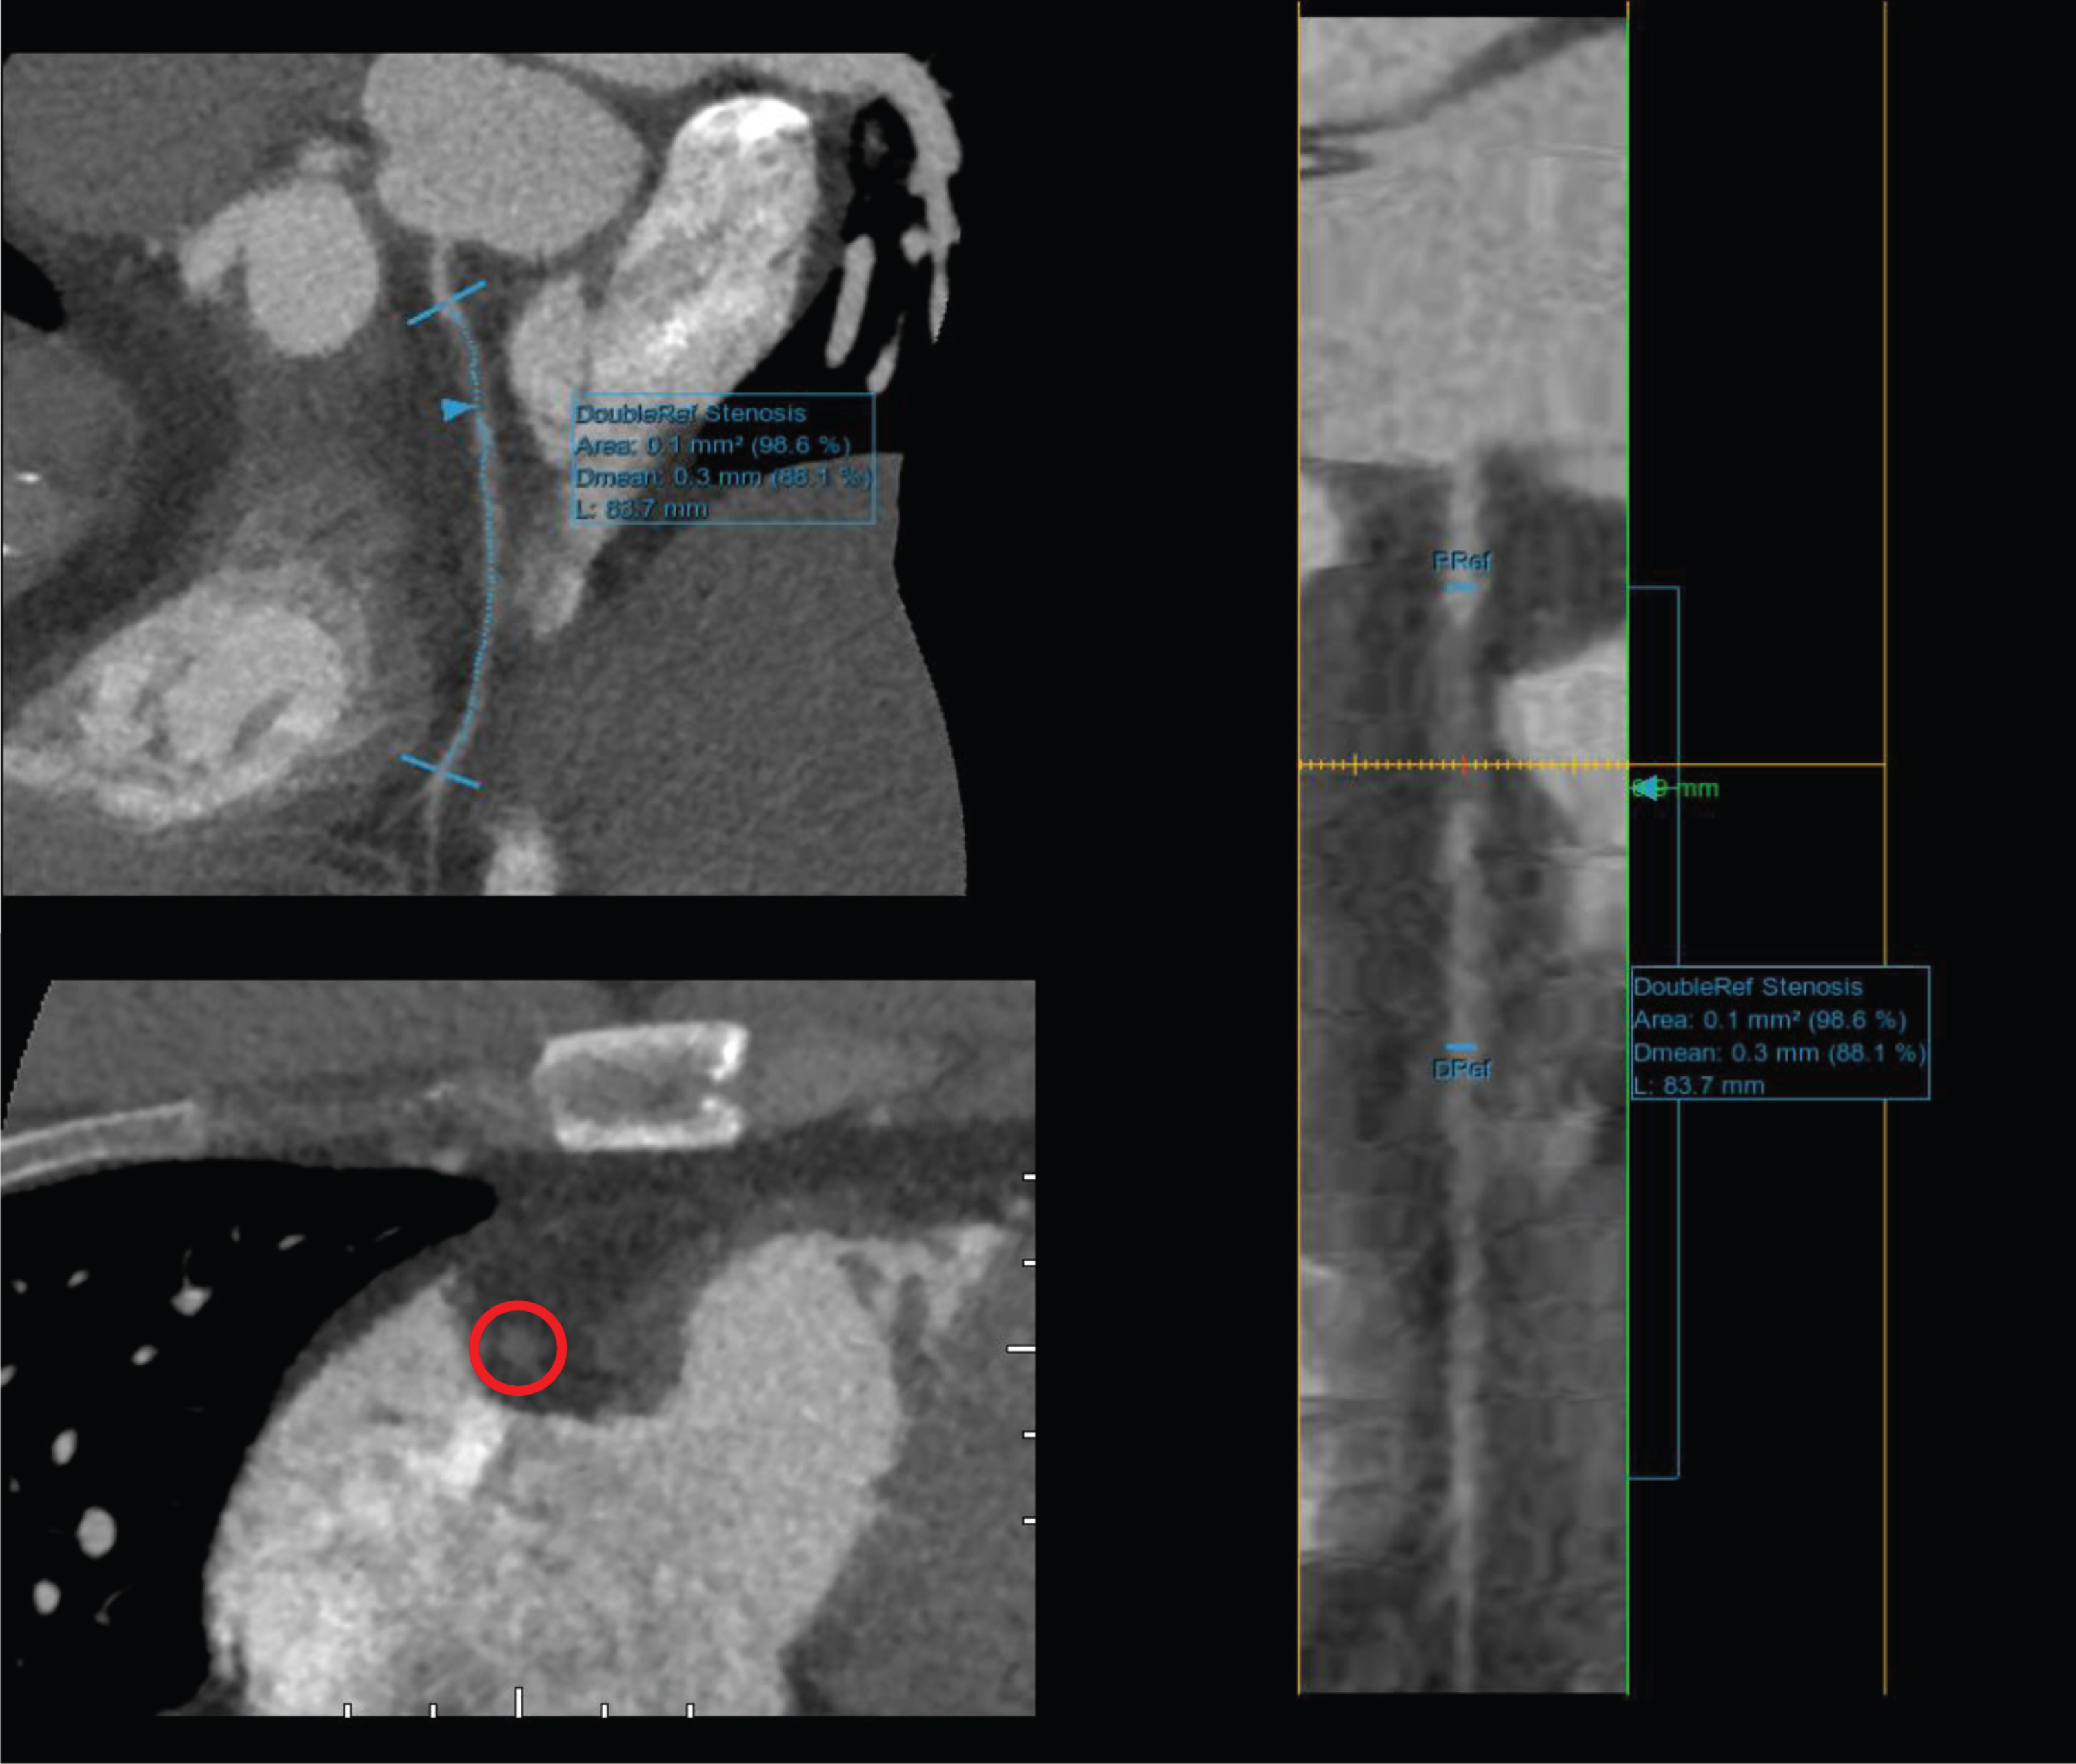
Measurements of stenosis shown on the workstation.
Only the dose of CCTA scanning was estimated. The scout view, coronary artery calcium score, and radiation dose of automatic bolus tracking were not included. Volume CT dose index (CTDIvol) and dose length product (DLP) were automatically provided by the CT scanner and recorded by radiographers after scanning. The effective dose (ED) was calculated according to the formula ED = K×DLP, where K is the conversion factor. The average value for the chest is 0.014 mSv (mGy cm–1), proposed by the European Guideline for CT Quality [8].
Statistical analysis
The IBM SPSS Statistics 22 software was used for statistical analysis. Measurement data are expressed as mean±SD. Differences between normally distributed variables were tested for significance with the independent-samples t test. Differences between non-normally distributed data were tested for significance using the nonparametric Wilcoxon signed-rank test. Kappa analysis was used to evaluate the consistency of the interreader agreement for qualitative evaluation. The Kappa value was defined as follows: <0.20, almost inconsistent; 0.21–0.40, slightly consistent; 0.41–0.60, medium consistency; 0.61–0.80, good consistency; and 0.81–1.00, perfect consistency. The chi-squared test was used to compare the diagnostic accuracy between the measurements on each scanner and CCTA reports.
Results
All 101 patients completed the CCTA examination successfully. The patient population consisted of 49 (48.5%) male and 52 (51.5%) female patients with an average age of 60.87±11.05 years (37–87 years) and body mass index (BMI) of 24.37±2.69 kg m–2 (16.71–32.11 kg m–2). The patient characteristics of the study population were expressed as normally distributed variables. The detailed parameters are shown in Table 1. In brief, Group A comprised of 50 patients (27 males vs. 23 females) with 750 segments. The average age was 61.46±12.24 years, mean HR was 72.14±10.89 bpm, mean weight was 67.63±12.19 kg, and mean BMI was 24.63±3.38 kg m–2. Group B comprised of 51 patients (22 males vs. 29 females) with 765 segments. The average age was 60.29±9.82 years, mean HR was 70.55±10.95 bpm, mean weight was 64.69±12.58 kg, and mean BMI was 24.54±2.84 kg m–2.
Patient characteristics
Patient characteristics
The study also generated following results, First, in assessing image processing efficiency, the study results shown that the time for generating images of each patient on WDCT was about 15 min while the time on DSCT was about 5 min. Thus, the image processing efficiency was two times higher on DSCT.
Second, in assessing quantitative image quality, we found that the interobserver agreements were excellent for the measurements of CT values and SD. The average of measurements from both readers was used for further analysis. The average noise was 27.70±6.98 in group A and 24.43±4.45 in group B. CT values of the aortic root, SNR, and CNR were lower in group A than in group B. CT values of the aortic root, image noise, SNR, and CNR of all the measured arteries were significantly different between the two groups (P < 0.05; Table 2).
Quantitative and qualitative image analysis results
Third, in assessing qualitative image quality, two CCTA data sets (one from group A and another from group B) were considered as being of nondiagnostic image quality by both readers. The inter-reader agreement was considered excellent (kappa = 0.88). Thus, the qualitative evaluation of a radiologist with more than 20 years of experience was used for further analysis. The subjective score of CCTA data sets was 3.94±0.64 on WDCT and 4.69±0.60 on DSCT, showing a significant difference between the groups (P < 0.05).
Fourth, in diagnostic accuracy, a total of 27 patients were diagnosed with stenosis in any of the coronary arteries in group A. Stenosis was found to be different from the CCTA report in 8 of 27 patients; the diagnostic accuracy was 70.3%. However, stenosis was found to be different from the CCTA report in 8 of 22 patients in group B; the diagnostic accuracy was 63.6%. The chi-squared test showed a significant difference in both groups (P < 0.05; Table 3).
Diagnostic accuracy comparison
Last, in assessing radiation dose and contrast-related use, tube voltage distribution is shown in Fig. 2. In group A, the average tube voltage was 115.20±8.63 kV, tube current was 547.18±115.89 kV, mean DLP was 174.61±93.41, mean CTDIvol was 13.15±6.84, mean contrast volume was 48.09±8.10, and mean flow rate was 4.78±0.48. However, in group B, the tube voltage was 82.75±12.34, tube current was 1758.96±241.87, mean DLP was 242.77±144.58, mean CTDIvol was 24.59±15.34, mean contrast volume was 45.37±8.66, and mean flow rate was 4.49±0.60. The tube voltage, tube current, DLP, CTDLvol, and flow rate between the two scanners were statistically different (P < 0.05) (Table 1 and Fig. 2).
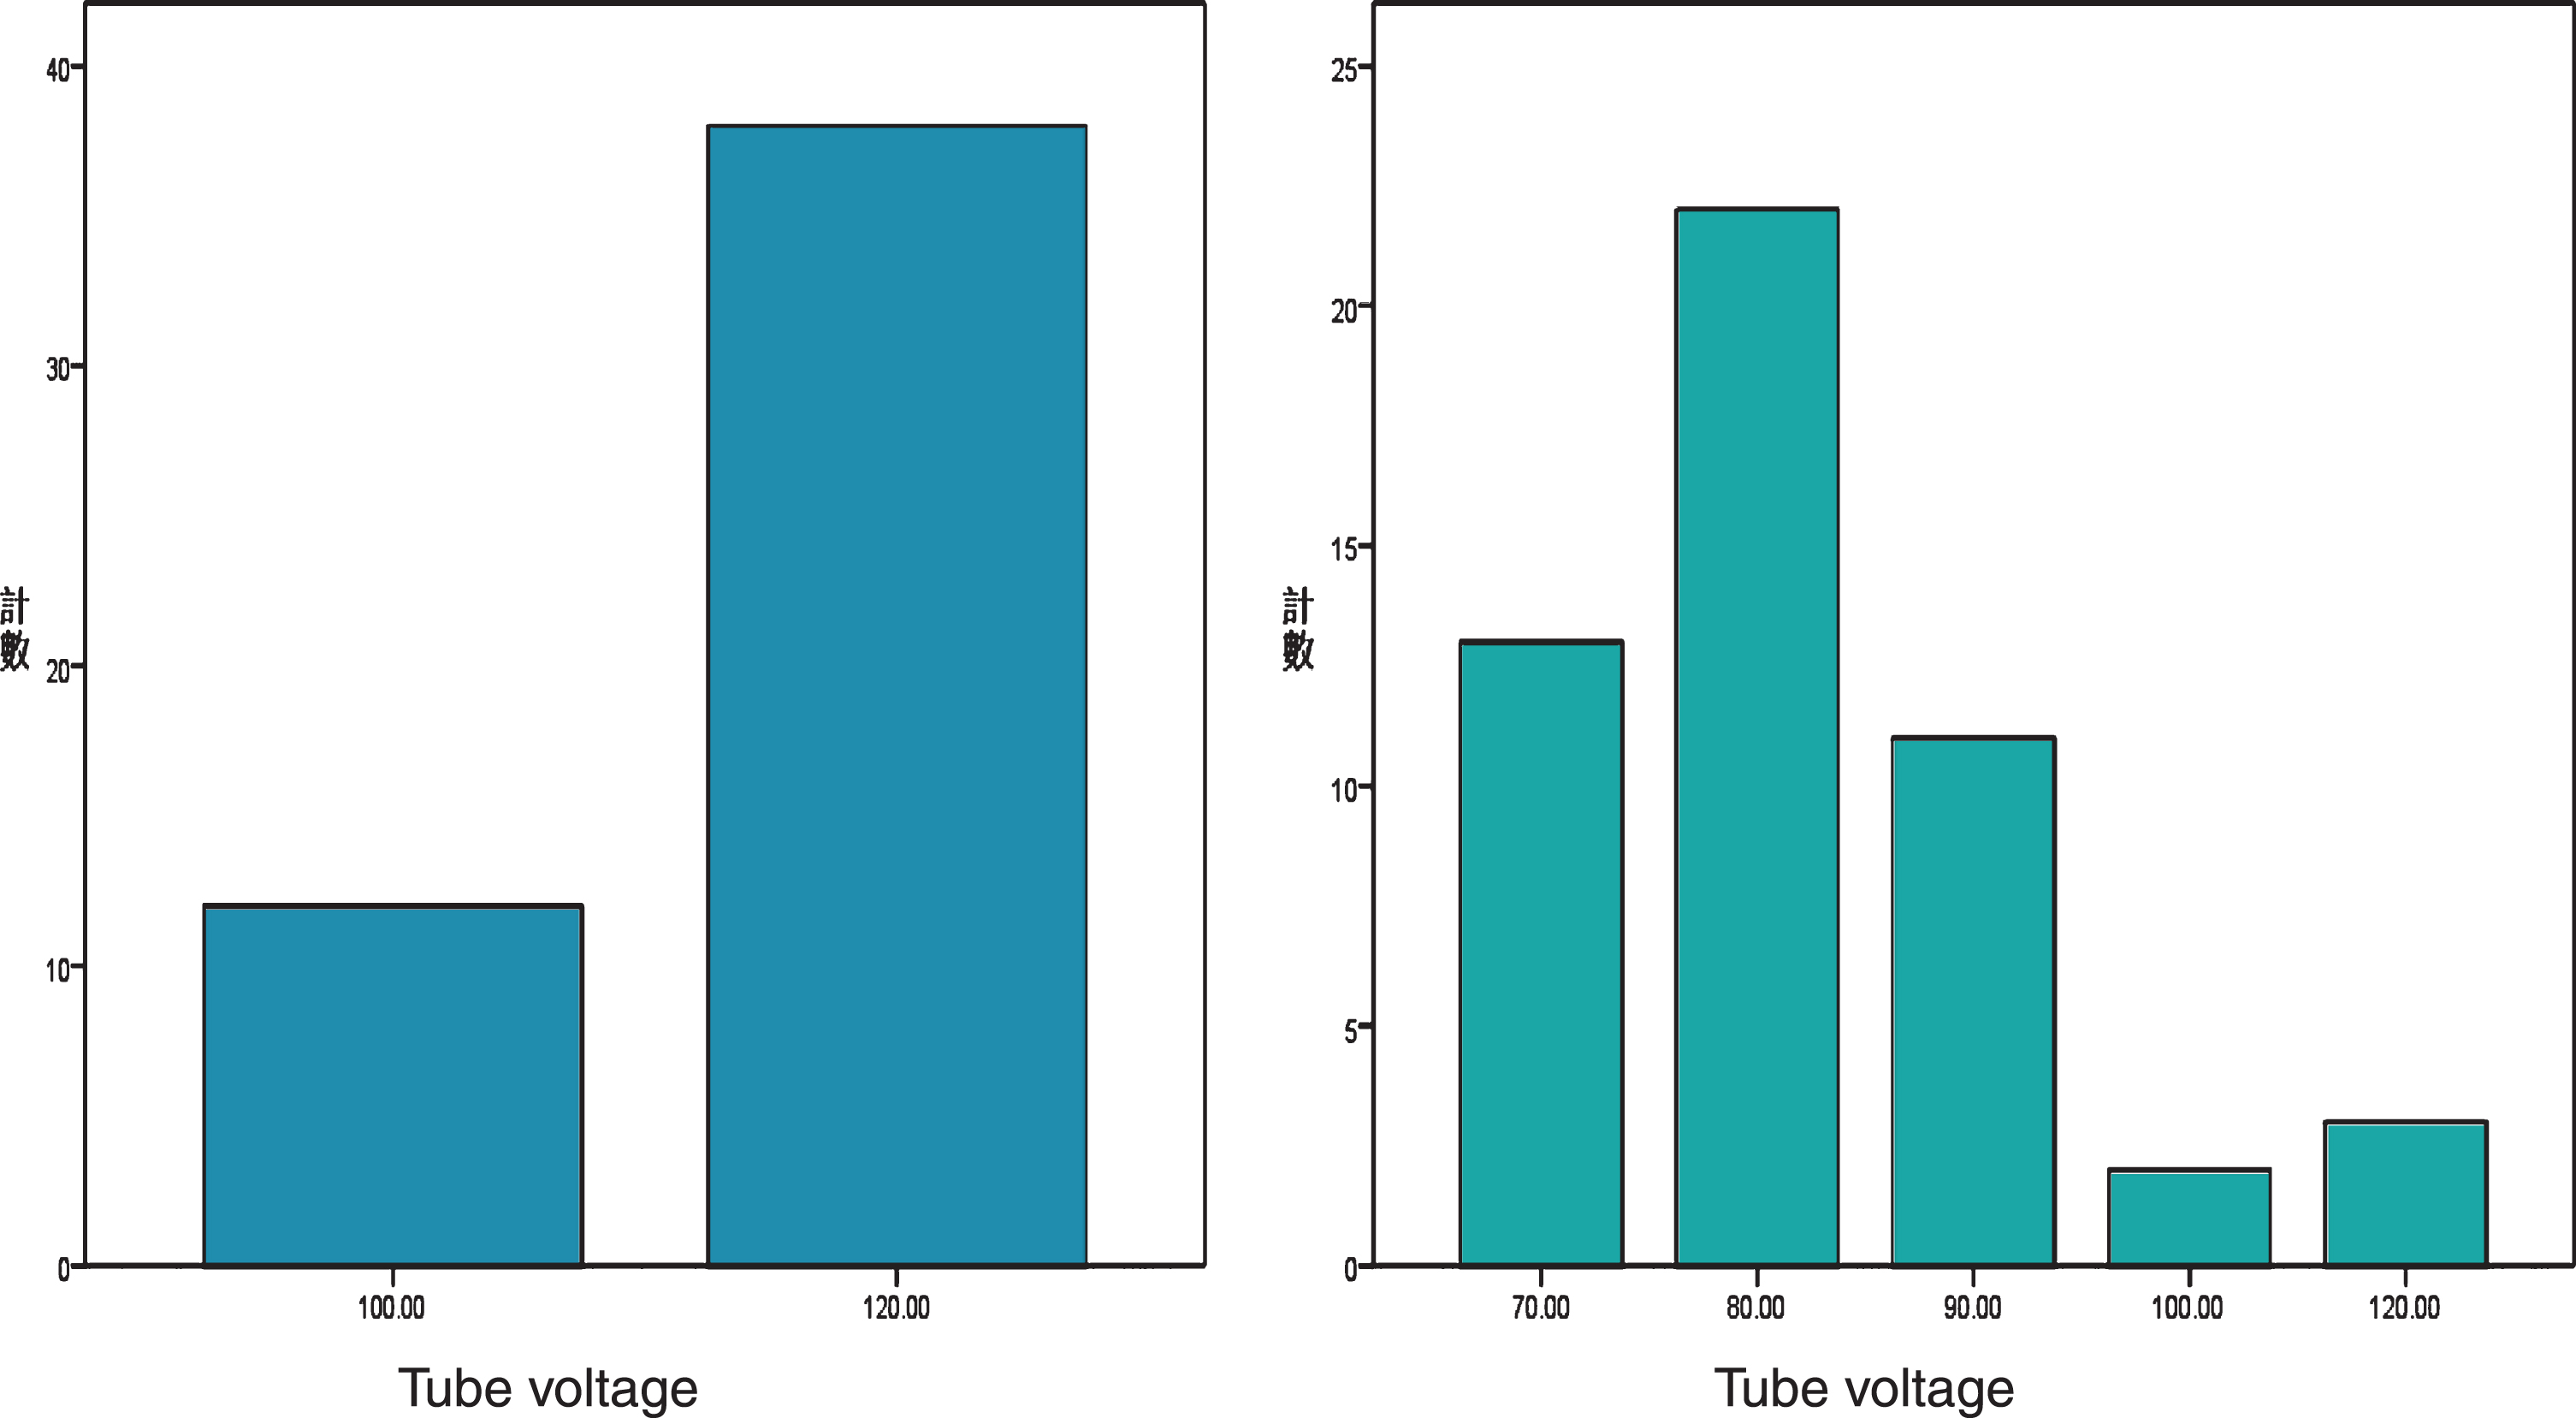
Tube voltage distribution on each scanner.
To date, a CT scanner for CCTA has not been developed without any limitations. Although enough temporal resolution is the best solution if the gantry speed increases or the triple source appears, implementation of either of them is extremely hard in physics. GE Healthcare, a vendor specific for the motion-correction algorithm, has the most advanced commercial product with a 16 cm wide-coverage detector using SSF, which helps in completing the CCTA in one beat [5, 9]. Siemens Healthcare launched the third-generation dual-source CT called Somatom Force in the market with a 5.76 cm wide-coverage detector and gantry speed of 0.25 s/rot, which has the fastest speed among commercial products with a temporal resolution of 66 ms [6, 10]. In order to address and solve this challenge, this study has following unique characteristics and/or observations.
First, in parameters of acquisition, the kV Assist and SmartmA technique on WDCT, and CAREkV and CAREDose4D technique on DSCT, were chosen through which the scanning parameters were selected automatically by the scanning system referring to scouts [11, 12]. No recommended injection protocols either in previous studies or on expert consensus were used. The study used an injection protocol suggested by a vendor’s application specialist, which was kept the same on another scanner to ensure enhancement.
Second, in examination preparation, no strict preparations were made, such as breath training, if the examination was performed on WDCT. The patients were just told to stay still and silent on the scanning table. However, DSCT had strict demands. The superiority of WDCT helped patients be more relaxed instead of cooperation for breath training, time after time and concentration on voice prompts.
Third, in assessing image processing efficiency, we found that the DSCT had higher efficiency. The images of each patient were once generated automatically on WDCT for SSF reconstructions. CCTA data sets were reconstructed with three-phase recon (left, target, and right) on the console target phase with± 80 ms phases and sent to the workstation [9]. The SSF reconstructions were finished automatically in about 15 min. The two optimal phases [13] (end-systolic or end-diastolic) were generated automatically on the console just after scanning in about 5 min on DSCT. This waiting time indicates the low efficiency during daily work, especially in big hospitals with a large number of patients.
Fourth, quantitative image analysis revealed that the SNR and CNR from each segment on WDCT was significantly different compared to DSCT due to the following factors: (1) The average tube voltage was 115.20±8.63 kV on WDCT and 82.75±12.34 kV on DSCT. Low tube voltage demonstrated improved vascular attenuation on CCTA with beneficial effects on image quality, as the effective energy of the X-ray beam in the range of maximum absorption moved closer to the k edge of iodine (33 keV) [14, 15]. (2) The average tube current was much lower on WDCT than on Force. The maximum current on WDCT was no more than 723 mA. Moreover, the patients’ BMI was 30 or higher. The 720 mA current would be available under the condition of no continuous contrast-enhanced abdominal scanning before current CCTA. Otherwise, SmartmA would force to wait for tube cooling or reduce the maximum current to be less than 700 mA, sometimes even lower. The capability of the X-ray tube may influence the photon quantity, resulting in a lot of noise [16] for some patients with large BMI or weight, although the 80% ASiR-V was applied (Fig. 3). (3) The injection flow rate was the third factor resulting in the differences between the two scanners. It helped increase the CT value of the blood vessel cross-section per unit time with higher iodine flow rate per unit time [17]. According to the 0.7 mL/kg contrast media volume for each patient, the flow rate showed no difference if the weight of the two groups was not significantly different. However, in actual scanning, patients with greater weight required higher flow rate (7.0 mL/s or even higher). The peripheral intravenous conditions did not allow a flow rate less than 6 or 5.5 mL/s, which made the flow rate higher on WDCT than on DSCT. Although the flow rate should improve image quality on WDCT better than on DSCT [18], the results did not indicate any improvement.
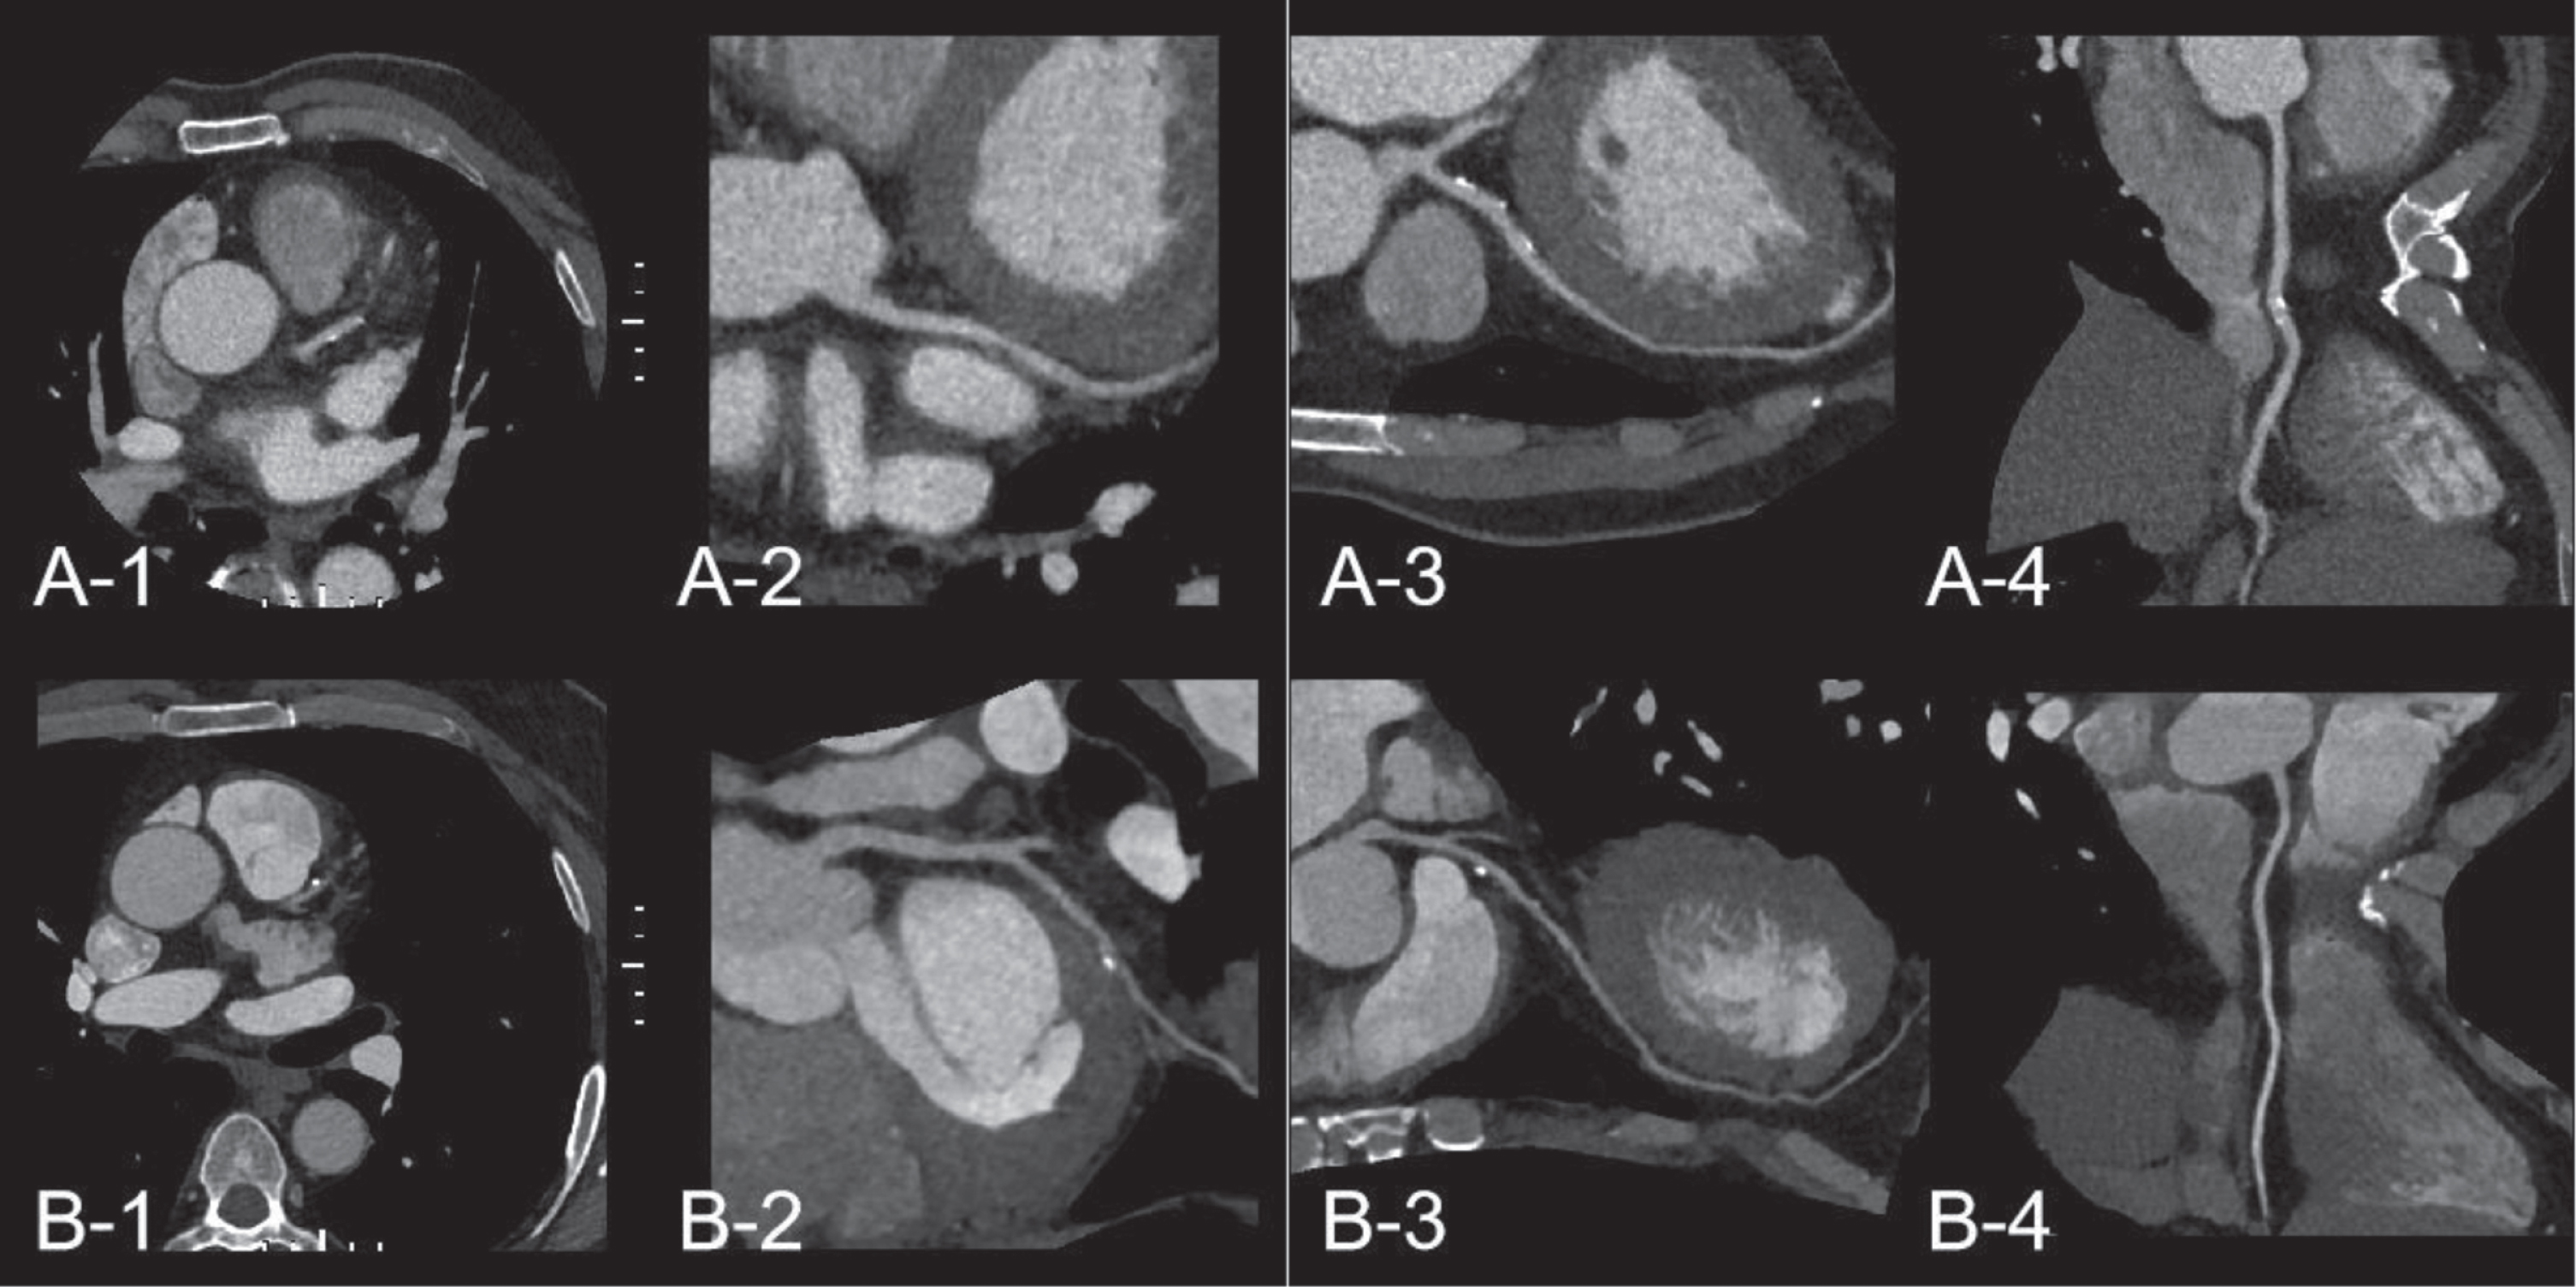
(A1–A4) A patient in group A with BMI over 30, HR 66 bpm, axial image in the aortic root, curved planar reconstruction and multiplanar reconstruction images in LCA and RCA, with subjective score 4. (B1–B4) A patient in group B with BMI over 30, HR 72 bpm, images in the aortic root, LCA and RCA, with subjective score 5.
Fifth, the qualitative analysis revealed that although the subjective scores on DSCT were 15% higher than on WDCT, the average score of both groups was above 3 points; the patients were satisfied with the diagnostic quality. In group A, scores below 4 were observed in patients with large BMI or weight; patients with small BMI or weight scored above 4. In addition, our study showed no definitive priority in diagnostic accuracy on either of the scanners. Positive stenosis rate was higher on CT than on invasive coronary angiography (ICA), as reported by previous studies [19–21]. Even the measurements on each scanner were consistent with the CCTA reports; the real accuracy in overestimation of stenosis severity was not known.
Sixth, to assess artifact caused by image acquisition, we found that images of 28 patients in group B showed a cross-sectional artifact in the joint between 2 acquisitions. Some were minimal and some were obvious, which was caused by the step-and-shoot acquisition mode [22]. The unstable HR and breath were the main factors. However, this kind of artifact was not seen in images in group A, where the data were acquired in one single beat. Most artifacts in group A were motion artifacts around the arteries caused by low temporal resolution in patients with a high HR, despite applying the SSF technique [5, 23].
Seventh, our study also found that in only 12 of 50 patients in group A, the tube voltage was switched to 100 kV. For others, it was 120 kV in radiation dose. The average tube current was 547.18±115.89 mA, compared with 70 kV for 13 patients, 80 kV for 22 patients, 90 kV for 11 patients, 100 kV for 2 patients, 120 kV for 3 patients, and 1758.96±241.87 mA in group B. A previous study reported that low kV settings improved the simultaneous reduction of radiation [15]; however, the tube voltage was much higher on WDCT than on DSCT. Due to the lower current and lesser exposure time, the radiation dose was almost 28% lower in WDCT than in DSCT. The BMI of the two groups showed no significant difference, which also was the main factor resulting in higher noise on WDCT as reported by a previous study [16]. Another reason for the differences between the two groups was the exposure range on the R–R interval, which was wider (from 30% to 80%) on DSCT than the center phase exposure on WDCT. Only one mode was available on WDCT, although the wide exposure range was applied, which was challenging on photon number for a wide coverage per unit time resulting in a further decrease in image quality. However, DSCT profited from the strong capability of the X-ray tube, providing a flexible scanning mode such as high-pitch scanning [6], and prospective or retrospective scanning with the adjustment of the exposure range, providing space for further radiation dose reduction.
Last, the study also has risk of failure. One patient in each group had a score below 3 points. The one with large BMI on WDCT had higher noise, making the lumen diagnosis difficult. The one on DSCT showed a rapid decrease in CT attenuation. This indicated that patients with small BMI and high HR may fail in the CCTA examination on DSCT (Fig. 4). In conclusion, image-processing efficiency of CCTA was higher by using DSCT than using WDCT, and the image quality on DSCT was better than that on WDCT due the limitation of maximal tube current of WDCT.
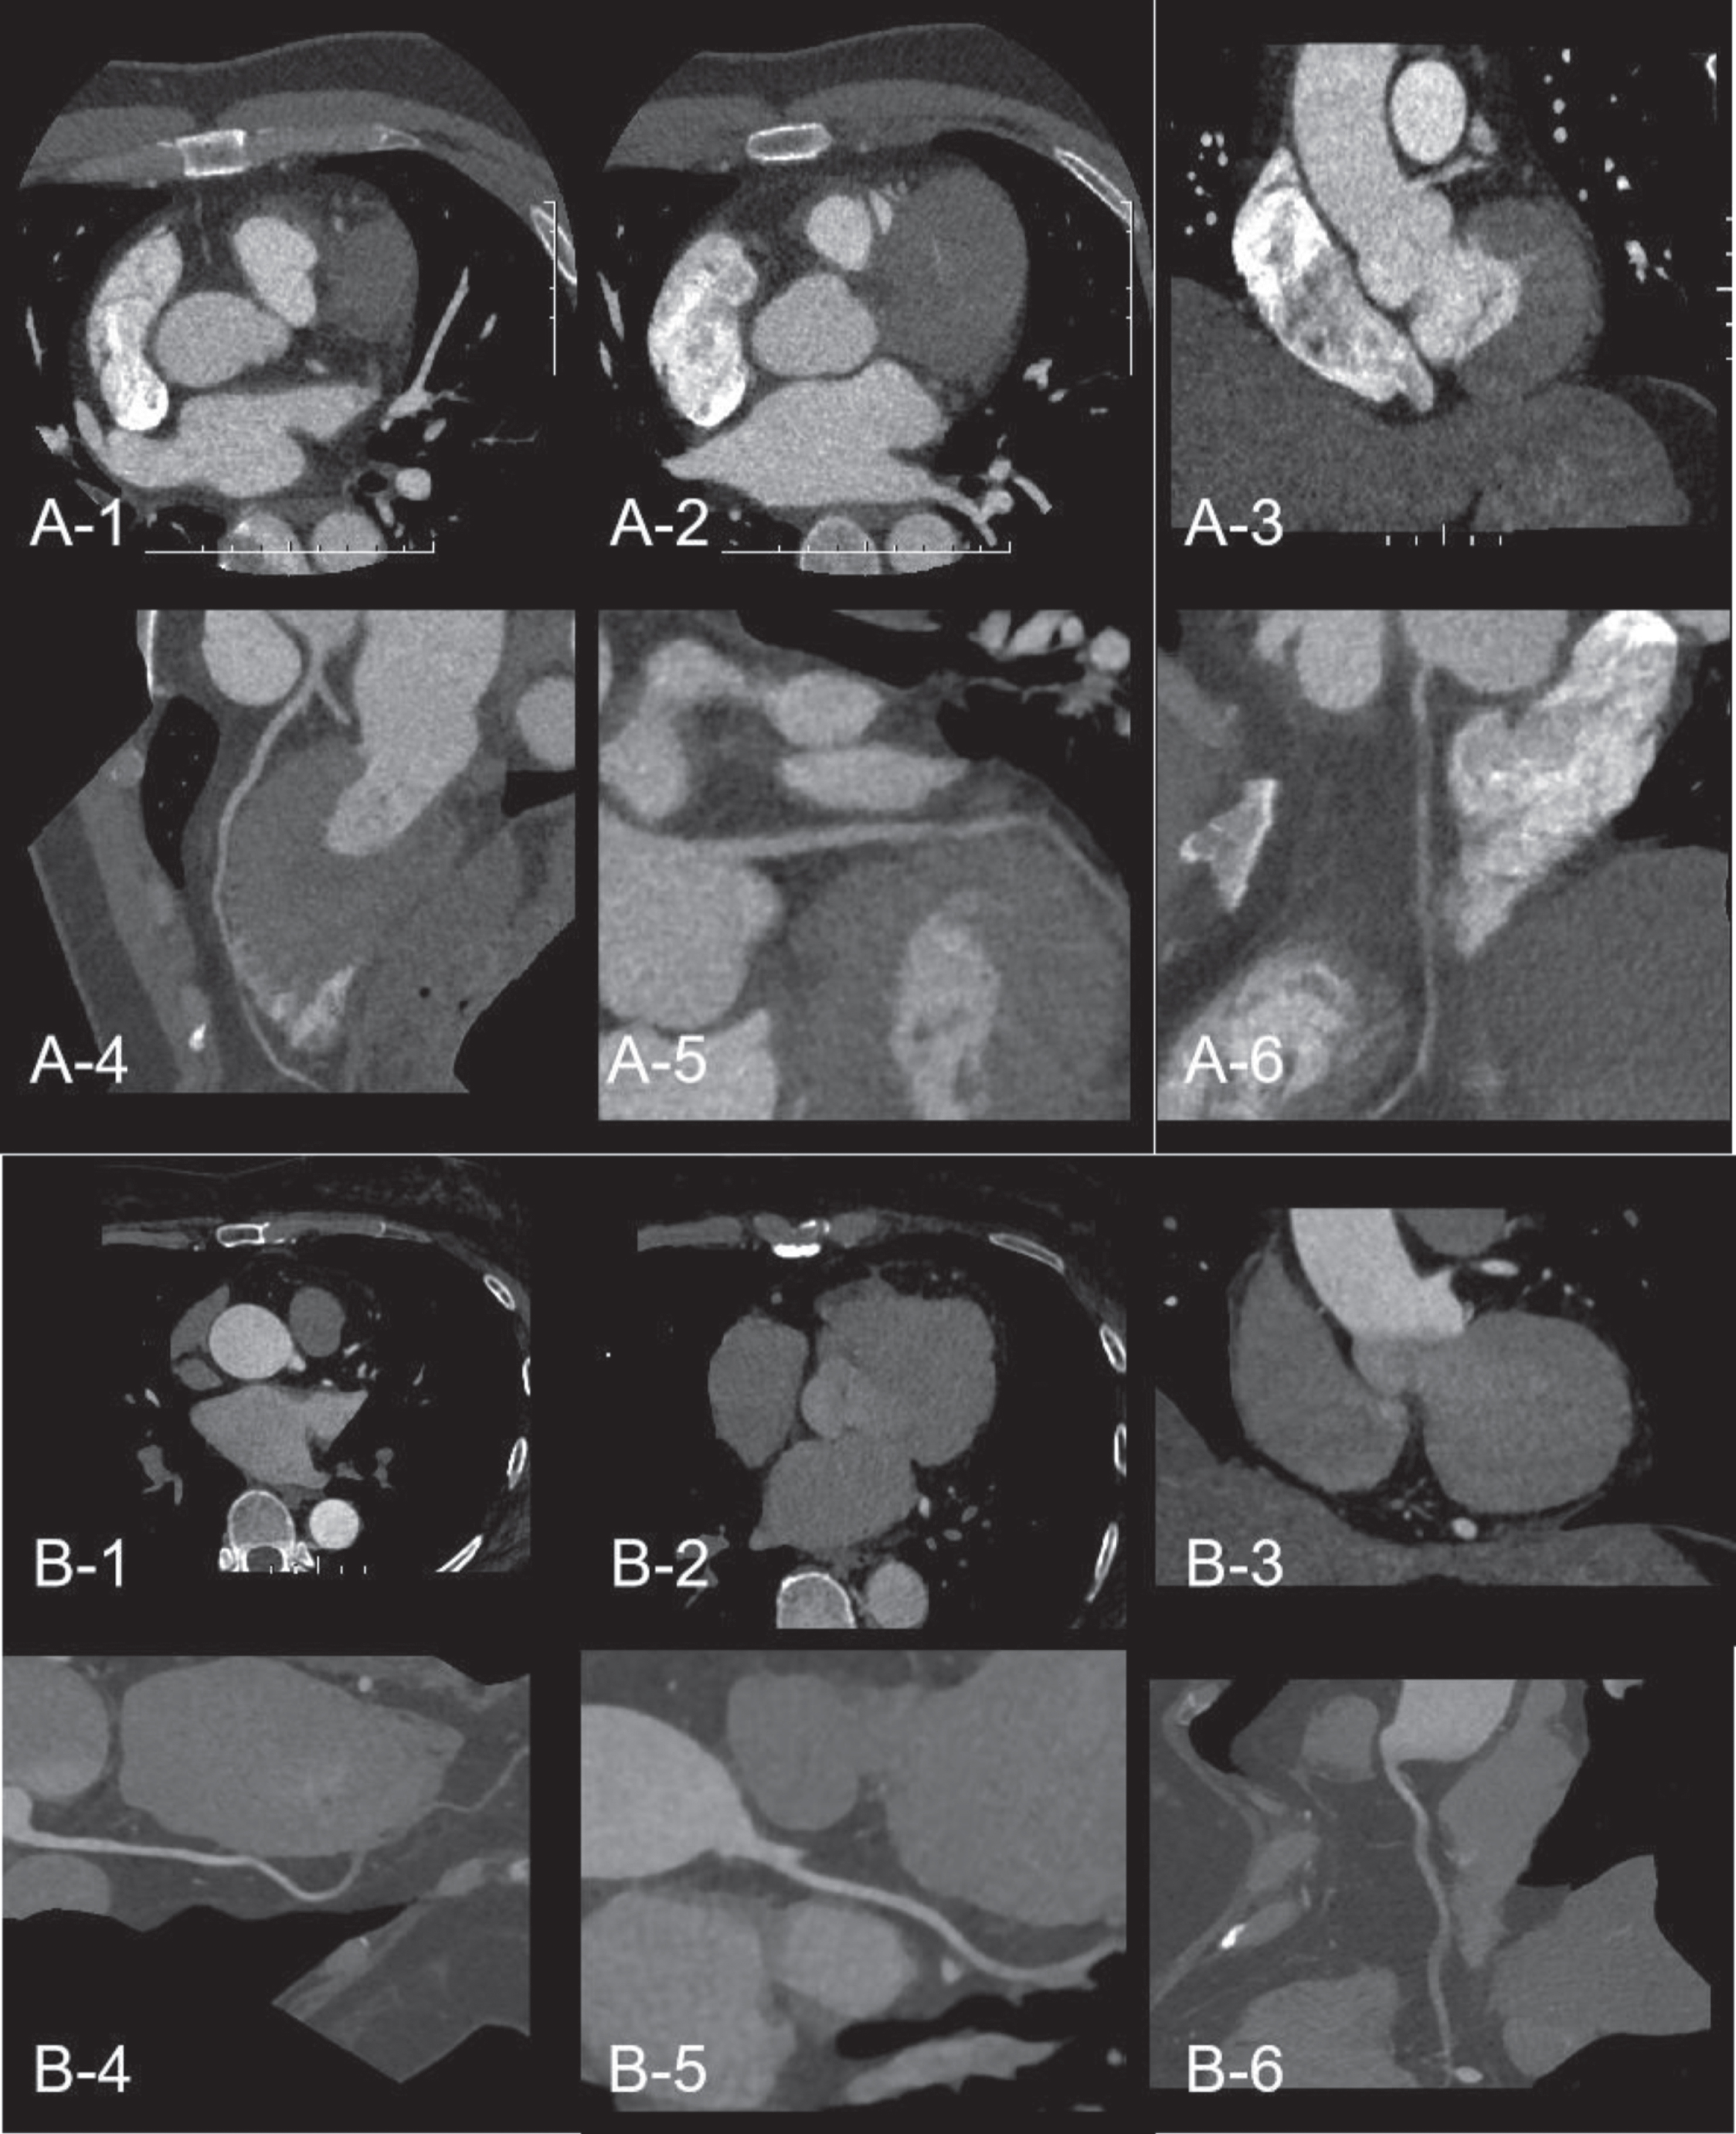
(A1–A6) A patient scored 2.5 with bad image quality and heavy noise in group A. (B1–B6) A patient scored 2 with bad image quality of attenuation decreasing rapidly in group B.
The study had several limitations. First, it involved no comparison of diagnostic accuracy between CT and DSA. The accuracy of CCTA to determine stenosis severity was inferior to that of ICA, as determined by quantitative coronary angiography [19–21]. Hence, the real accuracy in the overestimation of stenosis severity by either of the scanners needs to be explored further. Second, a large BMI of 35 or more was not tested in the study because of the body size of the Asian patients and the recruiting time. Hence, comprehensive studies are required in the future. Third, a low tube voltage may have helped reduce the volume of the contrast media in CCTA, which needs further investigation.
In conclusion, this study demonstrated that image-processing efficiency of CCTA was higher by using DSCT than using WDCT, and the image quality on DSCT was better than that on WDCT due the limitation of maximal tube current of WDCT.
Conflicts of interest
None to declare.
Footnotes
Acknowledgments
This study received funding from the National Key Research and Development Program of China 2017YFC0112800 (Peijun Wang); 2017YFC0112905 (Jinlong Shi) and the Medical Imaging Key Program of Wise Information Technology of 120, Health Commission of Shanghai 2018ZHYL0103 (Ming Li); and Youth Medical Talents –Medical Imaging Practitioner Program (AB83030002019004). The funding sources played no role in the study design; collection, analysis and interpretation of data; writing of the report; or decision to submit the article for publication. The National Natural Science Foundation of China (61976238, Ming Li).