



Abstract
BACKGROUND:
Expanding computed tomography (CT) detector coverage broadens the beam width, but inaccurate tube current application can reduce image quality at the boundaries between body regions with different attenuation values along the z-axis.
OBJECTIVE:
This study aims to develop and validate a new CT scanning technique with a fixed pitch to achieve higher imaging quality.
METHODS:
A cylindrical water phantom and an anthropomorphic chest phantom with different diameters represent a human body with different attenuation values. By optimizing the beam width and helical pitch, the pitch is fixed during scanning. The mean noise of the images and the standard deviation were calculated, and the coefficient of variation (COV) was compared to evaluate the uniformity of image noise according to the beam width.
RESULTS:
At the boundaries between regions with different attenuation values, the 10 mm beam width (COV: 0.065) in the water phantom showed a 47.7% COV reduction of image noise compared with the 20 mm beam width (COV: 0.125). In addition, the 20 mm beam width (COV: 0.146) in the chest phantom showed a 29.3% COV reduction of image noise compared with the 40 mm beam width (COV: 0.206). Thus, as the beam was narrowed, the mean noise was similar, but the standard deviation was reduced.
CONCLUSIONS:
The proposed CT scanning technique with a fixed pitch, optimized beam width, and helical pitch demonstrates that image quality can be improved without increasing radiation dose at the boundary between regions with different attenuation values.
Keywords
Introduction
Multidetector computed tomography (CT) allows fast scanning while maintaining constant image quality regardless of patient size via helical scanning [1, 2] and automatic exposure control [3, 4]. Regarding image quality, automatic exposure control targets the region of interest (ROI) before scanning to maintain a constant image quality with low variability. CT scanners rapidly evolved from 4-detector row scanners to 640-slice 320-detector row scanners. The increasing CT detector coverage has enabled faster imaging of large organs such as the heart [5, 6]. However, a larger beam width due to the increased detector coverage may undermine the image quality at the boundaries between regions with different attenuation values along the z-axis with inaccurate tube current application. For example, in the lung, attenuation changes suddenly at the boundary between the lower lung region and upper abdominal region. In regions with different attenuation values, given the difficulty in applying the corresponding tube current, the average tube current based on the beam width is commonly applied [7, 8].
However, utilizing the average tube current can impair the image quality in regions with relatively high attenuation within the beam area. Abrupt changes in attenuation also appear in head–neck and neck–shoulder scans [9]. To minimize the adverse effects of attenuation, scanning is undertaken with the narrowest possible beam width, which increases the number of scan passes per examination, thus improving image quality. However, additional scans reduce the overall scan speed, possibly resulting in motion artifacts related to respiration and X-ray tube overload. Alternatively, the image quality can be improved by reducing the pitch in a specific area. However, a reduced pitch increases the patient’s radiation exposure [10].
In this study, we propose to develop and verify a CT scanning technique that provides a fixed pitch by adjusting the beam width and helical pitch at the boundary between regions with different attenuation values. The proposed technique allows accurate tube current application to the boundary between regions with considerable attenuation changes, improving the image quality at the boundary without increasing radiation dose.
Materials and methods
Imaging principles of the proposed technique
As shown in Figs. 1a and 1b, the tube current per rotation of the X-ray tube can be estimated by calculating the attenuation along the z-axis through the patient’s CT localizer radiograph [11–13]. The average tube current corresponding to the beam width per rotation is applied to the patient, with the applied tube current varying according to the beam width. Segment b’ in Fig. 1b demonstrates that in a lung CT scan, the tube current rapidly changes along the longitudinal axis due to the variation in attenuation at the boundary (segments a′, b′, c’ in Fig. 1) between the lower lung region and upper abdominal region.

Localizer radiograph image of lung man phantom on lung CT scan (a). The boundary between the lower lung and upper abdomen (a′, b′, c′). In (b) and (c), the tube current (mA) value along the longitudinal axis according to the attenuation change of the localizer radiograph. The red solid line (certain location; b′) is the number of rotations of the x-ray tube for a 40 mm beam width. The blue solid line (certain location; c′) is the number of rotations of the x-ray tube for a 20 mm beam width.
To achieve image quality that provides the desired noise level for CT scanning at the boundary between regions, the tube current must be accurately applied depending on the attenuation. For example, a 40 mm beam width requires two rotations of the X-ray tube in segment b’ of Fig. 1b, whereas four rotations occur for segment c’ of Fig. 1c for a 20 mm beam width, doubling the number of required scan passes.
Using a narrow beam width in the same section increases the number of scan passes, allowing the application of accurate tube current according to the attenuation. Therefore, the proposed CT scanning technique performs imaging while maintaining the pitch by reducing the beam width and helical pitch at the boundary between regions with different attenuation values.
For this study, CT image acquisition was performed using a 320 row-detector CT scanner (Aquilion One PRISM edition, Canon Medical Systems, Otawara, Japan) with the following parameters: beam widths of 0.5×160, 0.5×80, 0.5×40, and 0.5×20 mm, pitch of 0.825, rotation time of 0.75 s, tube voltage of 120 kVp, and automatic exposure control (SURE Exposure 3D) with a noise index (standard deviation—SD) of 4.
Figure 2 shows the two phantoms used to model regions of the human body where attenuation changes suddenly. The setup consisted of a cylindrical water phantom with a 28.5 mm head diameter and a 25.5 mm neck diameter to perform head–neck CT scanning. In addition, an anthropomorphic chest phantom was used to obtain lung CT scans (Lungman N-01, Kyoto Kagaku, Kyoto, Japan; Fig. 2d). The water phantom was located at the isocenter of the gantry, as in routine clinical CT examination, and the chest phantom was located in the supine position, also at the isocenter.

The setup of the cylindrical water phantom and chest phantoms (a, d) on the CT scanner. Cross-sectional views showing ROI placement in the water phantom (b: 250 mm diameter and c: 190 mm diameter) and in the spine region (spinal cord) of the chest phantom (e: should region and f: lung region).
The CT images were reconstructed from raw data using filtered back-projection with a standard head kernel FC26 and standard soft tissue kernel FC08. For reconstruction, we set the slice thickness to 5 mm.
The beam width, helical pitch, and couch-top motion were optimized to maintain the pitch using the parameters listed in Table 1. According to Standard 60601-2-44:2002 of the IEC (International Electrotechnical Commission) for CT safety, the pitch is defined as the helical pitch divided by the number of slices scanned per rotation. In turn, the helical pitch is defined as the couch-top motion (in millimeters per rotation) divided by the nominal scanning slice thickness (in millimeters). The beam width is defined as the nominal scanning slice thickness multiplied by the number of slices scanned per rotation. The nominal scanning slice thickness of the CT system used in this study was 0.5 mm. Therefore, the pitch increased as the couch-top motion increased or the beam width decreased.
Scanning parameters for head & neck scan and lung scan protocol and the same pitch according to different beam widths are used. Additional scan parameters applied: helical scan mode, 120 kVp, tube current range (50–900 mA), rotation time (0.75 sec), Target noise level (SD: 4), AEC with SURE Exposure 3D, slice thickness (5 mm)
We measured the image noise, defined as the SD of the mean CT number within the ROI, in the water and chest phantoms. In other words, the mean CT number was measured several times, and the SD of these multiple measurements was expressed. The SD in the cross-section of the water phantom acquired along the z-axis was taken as the noise measurement in the central ROI with 50% of the phantom diameter in the water-filled area (Fig. 2b and 2c). Noise measurements were obtained manually by drawing a circular ROI averaging 70 mm2 (range, 60–80 mm2) in the spine region of the chest phantom, which can be done throughout the phantom as this region is uniform (Fig. 2e and 2f). The mean SD (μ) of the CT numbers in the water phantom and spine throughout the chest phantom as well as the SD (μ) of the measured SDs were calculated. To evaluate the image noise uniformity according to the beam width, the coefficient of variation (COV) was calculated as COV = μ/σ
Results
Figure 3a shows the tube current modulation results superimposed on projection radiograph images for beam widths of 80, 40, 20, and 10 mm using the cylindrical water phantom with different diameters for the head–neck scan. The tube current demonstrates that the diameter of the water phantom decreases dramatically at the boundary (attenuation location) between the large and small areas. In Fig. 3a, points a, b, c, and d indicate the decrease in tube current, and points a′, b′, c′, and d′ indicate the locations where the decrease in tube current becomes constant. Figure 3b shows that a narrower beam width causes shorter slice locations (segments a–a′, b–b′, c–c′, and d–d′). That is, the narrower the beam width, the shorter the fluctuation range of the tube current and measured SD.
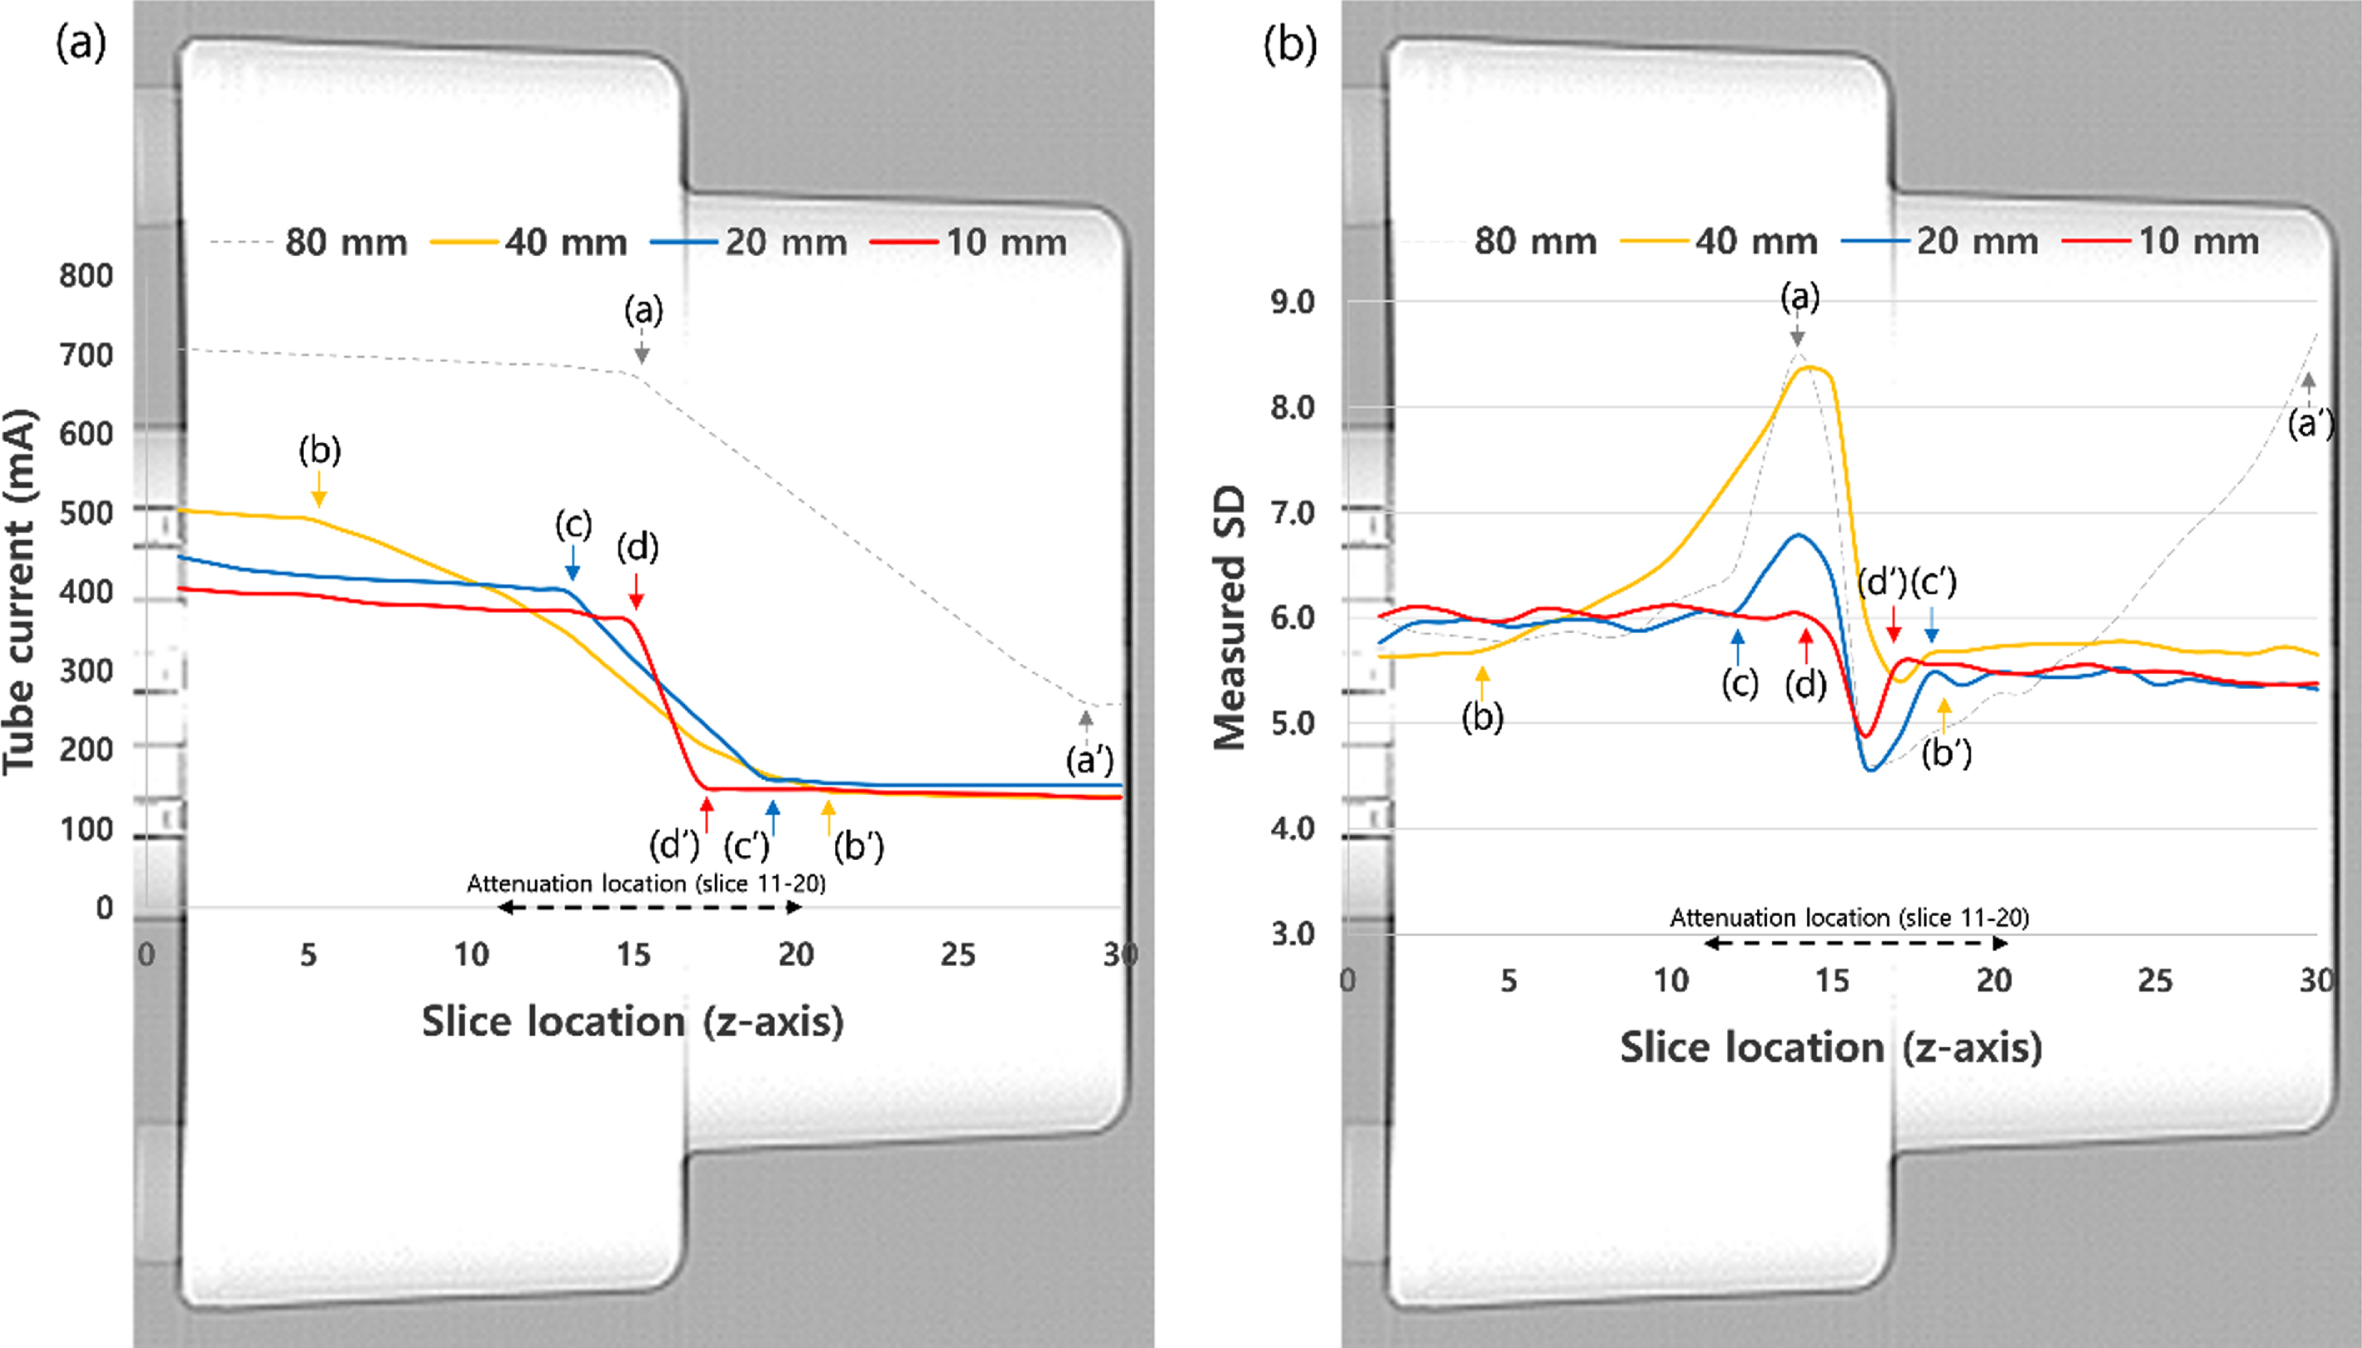
Tube current values and measured SD (image noise) overlaid on the scan projection radiographs at various beam widths (80, 40, 20, 10 mm) are plotted along the longitudinal axis of the cylindrical water phantom. (a) The points a, b, c, and d indicate the decrease in tube current, and points a′, b′, c′, and d′ indicate the location where the decrease in tube current starts to become constant. (b) The points a, b, c, and d indicate the sharply increases or decreases in measured SD, and points a′, b′, c′, and d′ indicate the location where the increase in measured SD starts to become constant.
Figure 4 shows the results of tube current modulation and measured SD for the cylindrical water phantom at 20 mm beam width, which is commonly used for head–neck CT scans. The figure also shows the tube current and measured SD at 10 mm beam width within the attenuation location (slices 11–20). Within the attenuation location, the 10 mm beam width (COV: 0.065) shows an image noise reduction of 47.7% compared to the 20 mm beam width (COV: 0.125) (Table 2).

(a) Tube current values and (b) measured SD (image noise) overlaid on the scan projection radiographs at beam width of 20 mm are plotted along the longitudinal axis of the cylindrical water phantom. Additionally, the tube current values are compared with SD corresponding to the attenuation location of partial 10 mm beam width to 20 mm beam width.
Mean tube current (mA), noise (Mean±SD), coefficient of variation (COV), scan time (sec) at various beam widths for a constant pitch (0.825) at each location of the phantoms
Figure 5 shows the mean noise (bars) and SD (whiskers) according to the beam width for the cylindrical water phantom and for the attenuation location. The mean noise for the different beam widths is similar, though the narrower beam leads to a lower SD.

Mean noise and standard deviation (Mean noise±SD) according to various beam widths in the whole location of the cylindrical water phantom and the attenuation location of the water phantom.
Figure 6a shows the tube current modulation superimposed to the CT localizer radiograph for different beam widths using the chest phantom for a lung scan. The tube current increases in the shoulder region and decreases in the low-attenuation lung region. The tube current increases sharply at the boundary (attenuation location) between the low-density lung and high-density abdomen. Points a–d indicate the locations where the decreasing tube current starts to increase, and points a′–d′ indicate the locations where the increasing tube current becomes constant. Figure 6b shows the measurements of image noise in the cross-sectional image of the chest phantom scanned using tube current modulation. Figure 7 shows the results of tube current modulation and measured SD at 40 mm beam width, which is commonly used for lung CT scans, in the chest phantom. In addition, it shows the tube current and measured SD at 20 mm and 10 mm beam widths within the attenuation location (slices 41–56). The 20 mm beam width (COV: 0.146) and 10 mm beam width (COV: 0.131) within the attenuation location show reductions of 29.3% and 36.1% in COV of image noise compared with the 40 mm beam width (COV: 0.206), respectively (Table 2). Figure 8 shows the mean noise (bars) and SD (whiskers) according to the beam width for the chest phantom and for the attenuation location. The mean noise for the different beam widths is similar, but a narrower beam leads to a lower SD.
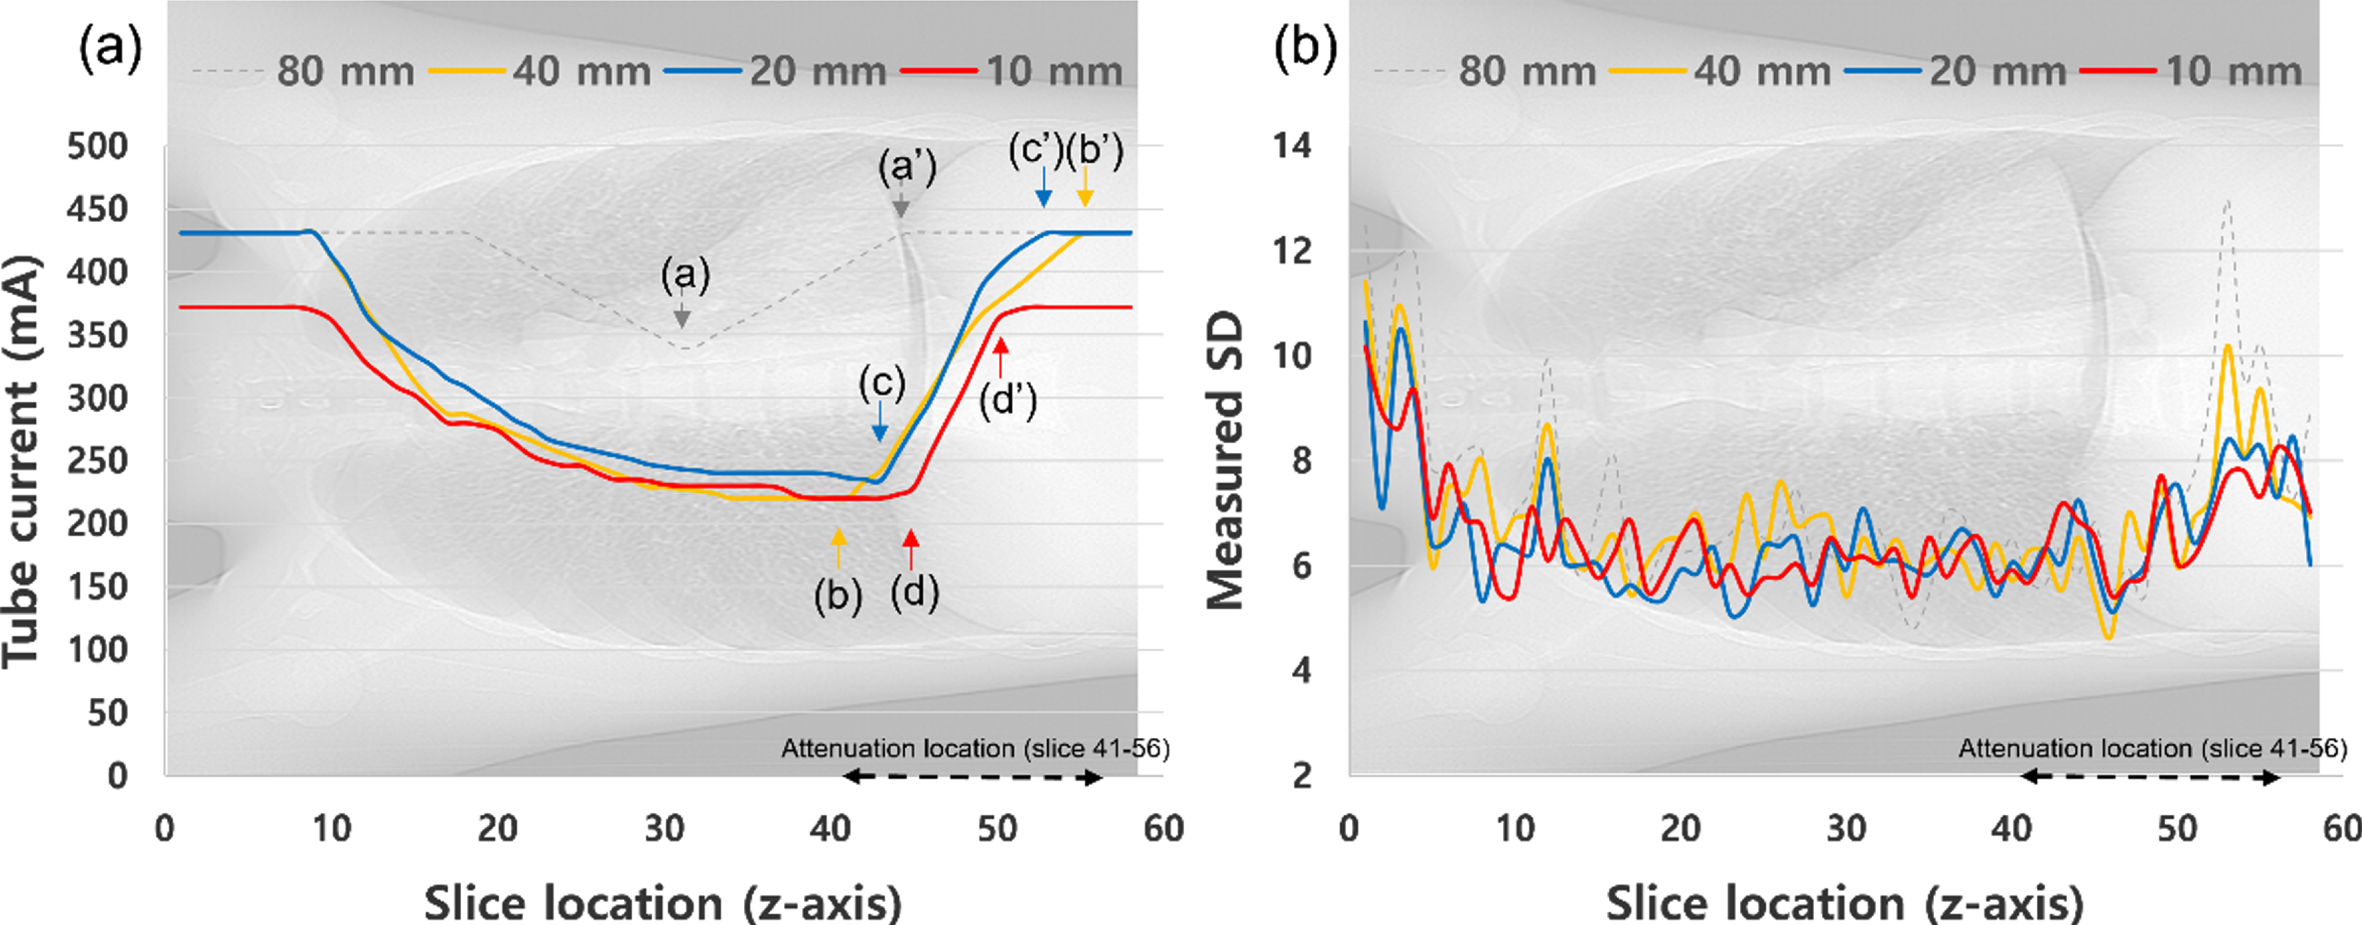
(a) Tube current values and (b) measured SD (image noise) overlaid on the scan projection radiographs at various beam widths (80, 40, 20, 10 mm) are plotted along the longitudinal axis of the chest phantom.

(a) Tube current values and (b) measured SD (image noise) overlaid on the scan projection radiographs at 40 mm beam width are plotted along the longitudinal axis of the chest phantom. Additionally, the tube current value is compared with SD corresponding to the attenuation location of partial 10 mm and partial 20 mm beam width to 40 mm beam width.
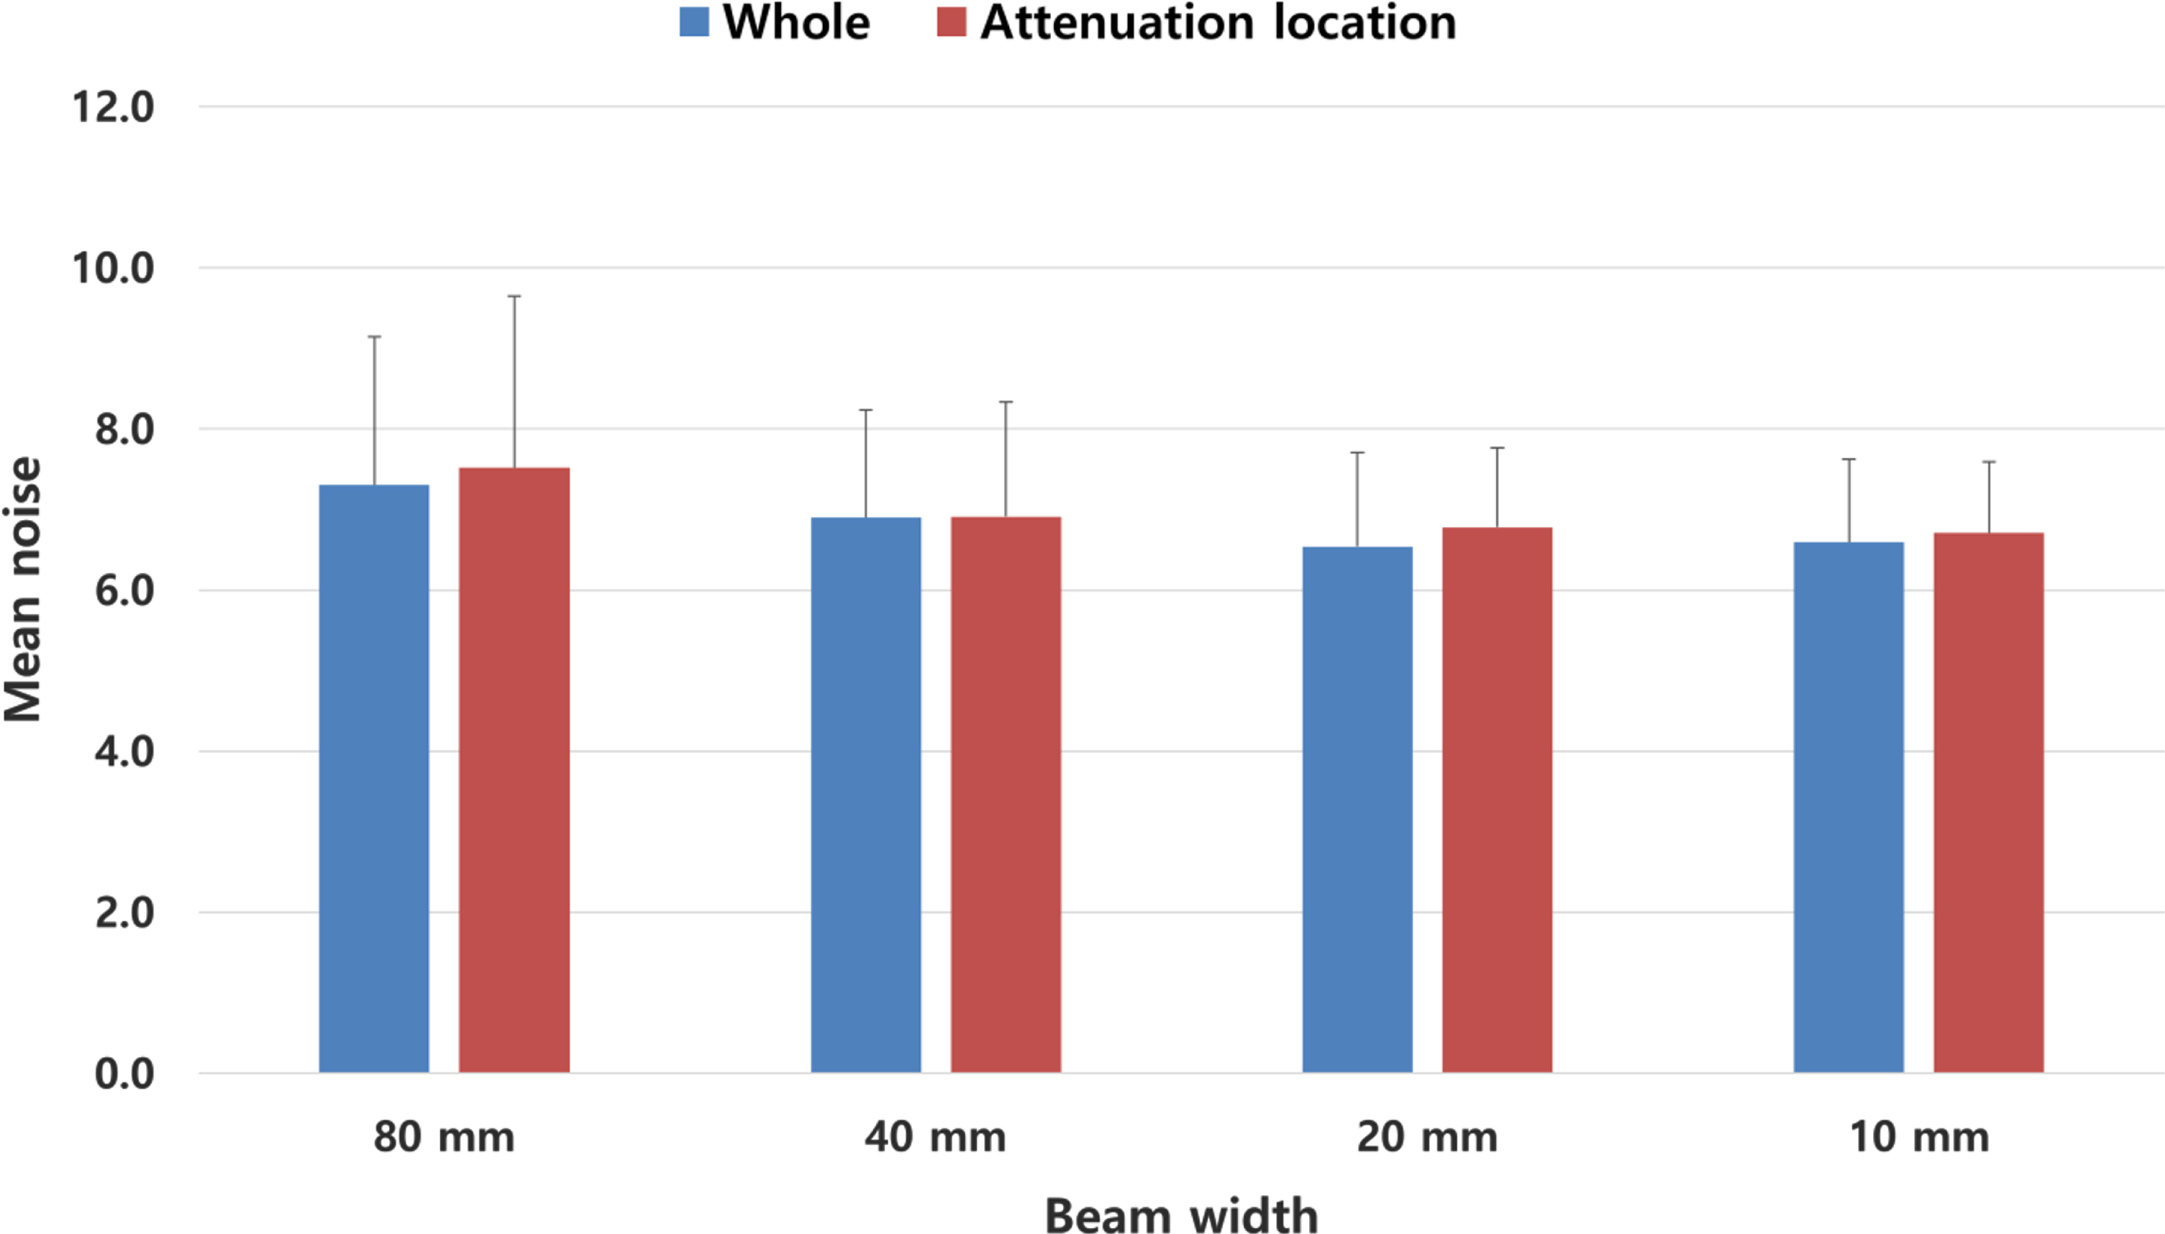
Mean noise and standard deviation (Mean noise±SD) according to various beam widths in the whole location of the chest phantom and the attenuation location of the chest phantom.
At the boundary between human body regions (attenuation locations) with different attenuation values, such as the head and neck, and the chest and abdomen, the tube current rapidly decreases or increases under modulation according to the target z-axis attenuation, as shown in Fig. 3a. Depending on the applied beam width, the points at which the tube current starts to change (points a, b, c, and d in Fig. 3) or remains constant (points a′, b′, c′, and d′ in Fig. 3) vary. The different locations of tube current changes result in different COVs of image noise (Table 2). We verified that a narrower beam is beneficial for image quality at the boundary between regions with different attenuation values.
During CT scanning, various protocols can be applied depending on the body part and diagnostic purpose. In our hospital, a 20 mm beam width is generally used for head–neck scans in helical mode, and a 40 mm beam width is common for lung scans. Figure 4 shows the tube current and measured SD for a head–neck scan with a 20 mm beam width (default scanning protocol) and a 10 mm beam width at the boundary between head and neck. Although the average tube current for the 10 mm beam width is comparatively lower than for the 20 mm beam width, the image noise shows a COV reduction of 47.7% (Table 2). Moreover, the chest phantom in Fig. 7 shows that a narrower beam substantially reduces the COV of noise. Hence, image quality improves even with similar or lower radiation doses when a narrower beam is applied at the boundary between regions with different attenuation values.
In general, the CT image quality can be adjusted by decreasing or increasing the pitch in the helical scan mode [14, 15]. For example, CT angiography for the abdominal and lower-extremity segments uses a variable helical pitch to adjust the pitch according to the area [16]. In Fig. 3b, the image quality (SD) drops sharply at the boundary between regions with different attenuation values. Reducing the pitch at this boundary can improve the CT image quality. Despite this improvement, the radiation dose increases due to the reduced pitch. Therefore, by improving the image quality without increasing the radiation dose, the helical pitch can be optimized according to the beam width, as shown in Table 1, to maintain a fixed pitch. In other words, the boundary between regions with different attenuation values is scanned with a beam width which is one step narrower than the previous one. As the pitch remains fixed with varying beam width, the image quality can be improved without increasing the dose, even if a narrower beam is used, by adopting the proposed CT scanning technique.
Despite encouraging experimental results, we recognize that various limitations of our study remain to be addressed. We used narrow beams at the boundary between regions with different attenuation values during scanning and optimized the helical pitch to match the beam width to maintain a fixed pitch. However, for this technique to be applied in clinical practice, the beam width and couch-top motion must be mechanically adjustable during scanning. In general, CT scans have a predefined scanning protocol. The collimator, which is located close to the X-ray source, is selected before scanning to match the beam width, or it adjusts the beam width by opening/closing along the z-axis direction through two apertures [17]. Dynamic or adaptive collimators are being introduced into the latest wide-beam CT scanners to reduce overranging doses, enabling a structurally similar technique [18–20]. Additionally, controlling the couch-top motion during scanning through techniques such as the variable helical pitch scanning is now commercially available [16]. Another issue with the proposed technique is the increasing scan time due to the narrower beam. When the 10 mm beam width was applied for the head–neck scan (Table 2), the scan time in the attenuation location (slices 11–20) increased from 2.58 to 4.87 s. In the attenuation location (slices 41–56) of the chest phantom, which resembles the characteristics of the human body, the scan time increased from 2.12 to 3.94 s when the 20 mm beam width was applied instead of the 40 mm beam width. In other words, at the attenuation location, the scan time was increased by 85.8% for the 20 mm beam width compared with the 40 mm beam width. However, the total chest scan time of a 40 mm beam width was 7.67 s, which increased to 9.46 s when a 20 mm beam width was applied at a specific attenuation location. Thus, the total chest scan time increased by 23.7%. Nevertheless, a shorter tube rotation time can reduce the scan time at boundaries when applying narrower beams.
Conclusions
In this study, we propose a CT scanning technique that maintains the pitch by optimizing the beam width and helical pitch at the boundary between regions with different attenuation values. We also verified that the proposed technique improves image quality without increasing the radiation dose. The study results indicate that our technique applies an existing CT scanning approach that, if adopted in clinical practice, will enable further improvement in image quality.
Declaration of interests
The authors declare no conflicts of interest.
Footnotes
Acknowledgments
We would like to express our sincere gratitude to Wonju Severance Christian Hospital for their generous support for this experiment.