
Abstract
BACKGROUND:
The polychromatic X-rays generated by a linear accelerator (Linac) often result in noticeable hardening artifacts in images, posing a significant challenge to accurate defect identification. To address this issue, a simple yet effective approach is to introduce filters at the radiation source outlet. However, current methods are often empirical, lacking scientifically sound metrics.
OBJECTIVE:
This study introduces an innovative filter design method that optimizes filter performance by balancing the impact of ray intensity and energy on image quality.
MATERIALS AND METHODS:
Firstly, different spectra under various materials and thicknesses of filters were obtained using GEometry ANd Tracking (Geant4) simulation. Subsequently, these spectra and their corresponding incident photon counts were used as input sources to generate different reconstructed images. By comprehensively comparing the intensity differences and noise in images of defective and non-defective regions, along with considering hardening indicators, the optimal filter was determined.
RESULTS:
The optimized filter was applied to a Linac-based X-ray computed tomography (CT) detection system designed for identifying defects in graphite materials within high-temperature gas-cooled reactor (HTR), with defect dimensions of 2 mm. After adding the filter, the hardening effect reduced by 22%, and the Defect Contrast Index (DCI) reached 3.226.
CONCLUSION:
The filter designed based on the parameters of Average Difference (AD) and Defect Contrast Index (DCI) can effectively improve the quality of defect images.
Introduction
Industrial X-ray computed tomography (CT) stands as an advanced tool for quality inspection within the manufacturing industry, with widespread applications across sectors such as nuclear industry, automotive, aerospace, electronics, and medical equipment. By seamlessly integrating traditional X-ray imaging with sophisticated computer reconstruction techniques, industrial X-ray CT entails the transmission of X-rays through the inspected object. Within the object, X-rays experience absorption and scattering phenomena, each material contributing differently to these processes. This divergence allows the detector to capture X-ray intensities at diverse positions, culminating in the creation of a projection image. The acquisition of multiple projection images is achieved through the rotation of both the X-ray source and detector. These images undergo meticulous computer processing, and employing advanced reconstruction algorithms, they give rise to high-resolution three-dimensional representations of the internal structure of the inspected object. In industrial applications, CT facilitates the three-dimensional characterization of diverse features, encompassing the dimensions and spatial arrangement of crystals, debris, vesicles, and pores [1–4]. Additionally, it provides insights into fracture apertures and surface roughness [5–8], as well as the structural textures [9, 10], and defects found in cast components. This technology proves especially well-suited for the meticulous quality control and assessment of intricate structures, seals, and materials [11].
In High-Temperature Gas-Cooled Reactors (HTR), a substantial amount of graphite functions as the core structural material, serving as both a reflector and shield within the reactor [12, 13]. To advance the commercialization of HTR, researchers at Tsinghua University continually refine the manufacturing process of graphite materials, resulting in significant enhancements in quality while simultaneously reducing costs [14]. However, inherent to the production, preparation, processing, and transportation of graphite materials are unavoidable defects, such as cracks and bubbles [15, 16]. These defects have the potential to expand during reactor operation, leading to structural damage and posing a threat to overall reactor safety. In response to this challenge, researchers have introduced a CT detection system based on 60Co, focusing primarily on defect identification in small to medium-sized graphite materials. This system demonstrates the capability to detect hole defects with a diameter of 2 mm and seam defects with a width of 1 mm [17].
Nevertheless, the 60Co-based detection system encounters limitations when inspecting larger graphite materials exceeding 660 mm due to its X-ray energy constraints. The Linear Accelerator (Linac)-based X-ray CT detection system emerges as the optimal solution to surmount this limitation. The Linac plays a pivotal role as an X-ray source, offering substantial advantages in both high energy and high flux compared to conventional X-ray machines. The high-energy X-ray beam exhibits superior penetration capabilities through thick or high-density materials, presenting a distinct advantage in the examination of larger-sized materials. Furthermore, the heightened flux of the X-ray source contributes to accelerated detection speed, facilitating swift and precise imaging— particularly critical for ensuring effective quality control on mass production lines.
Despite the notable advantages of Linac X-ray technology, it encounters challenges in practical applications. The X-rays generated by Linac are characterized by relatively low energy, with a significant portion falling below 1 MeV. In the case of 6 MeV Linac-produced X-rays, those below 1 MeV constitute 50.99%, decreasing to 44.9% for 9 MeV Linac-produced X-rays, and further to 42.15% for 12 MeV Linac-produced X-rays [18]. The prevalence of low-energy X-rays with limited penetration capability in Linac-generated X-rays can result in variations in material CT values, especially when imaging sizable objects [19–21]. The common occurrence of the hardening effect in X-ray detection poses a challenge, leading to diminished image contrast and potentially impacting the accuracy of defect detection. The application of filters at the exit position of the X-ray source effectively mitigates the hardening response. Recent studies, such as the work of O.M.H.Ahmed, have employed the average energy comparison method to carefully select the optimal filter material and thickness [22]. Similarly, researchers like Maximilian B.Kiss have incorporated filters to enhance image quality in a CT system designed for artifact detection [23].
The existing literature on filter design lacks quantitative analysis of defect detection capabilities and often overlooks the flux in X-rays, significantly influencing detection efficiency. In this paper, we introduce a novel approach to Linac filter design that meets the requirements of detection efficiency and conducts a thorough quantitative analysis of defect identification capabilities in images, intending to minimize the impact of hardening effects. This method effectively addresses accuracy issues in defect detection for graphite materials, as demonstrated in practical applications.
In the Method section, we provide a comprehensive description of the spectrum simulation model, the geometric structure of the Linac-based CT detection system for graphite materials, and the indicator parameters necessary for optimizing filters. Moving to the Result and Discussion section, we present the effects of different filters in the CT detection system, delving into the impact of various filter parameters on defect identification and hardening effects.
Method
X-ray computed tomography
When X-rays pass through an object, Beer’s Law mathematically describes how the intensity of X-rays attenuates with the thickness and composition of the material. This fundamental principle finds extensive application in the detection of internal structures, such as cracks, voids, or other density variations. In the case of a single material, the expression of Beer’s Law is given by:
Here, I is the transmitted light intensity, I0 is the incident light intensity, μ is the linear attenuation coefficient, and x is the thickness of the transmitting material [24]. In practical applications, objects are typically composed of multiple materials, and the energy of X-rays is continuous. Therefore, the formula for Beer’s Law is appropriately expanded to:
Here, E represents the continuous energy of incident X-rays, I(E) is the transmitted light intensity, I0(E) is the continuous spectrum of incident light intensity, μj(E) is the linear attenuation coefficient of the jth material at energy E, and xj is the thickness of the jth material.
In the detection of internal defects within an object, defects typically manifest as abrupt or varying changes in material density, leading to variations in X-ray transmission intensity. This variation enables precise detection and imaging of internal defects within the object. In CT imaging, the energy spectrum of the X-ray source plays a crucial role in image quality and the transmissive capability for different materials. Different X-ray energies can penetrate materials of varying densities and thicknesses, directly impacting imaging resolution and the ability to detect fine structures. Therefore, the optimization of the X-ray source spectrum is paramount in the design and application of CT systems.
The detection system in this study is designed to meet the requirements for inspecting graphite materials up to 1000 mm thick. By referencing the imaging quality standards of ASTM E1735-19 [25] and considering the energy spectrum of Linac and the attenuation coefficients [26] of graphite materials, it has been determined that the 9 MeV accelerator can penetrate graphite to a thickness of 1102.3 mm. This preliminary finding meets the detection requirements, and thus, the filter design in this paper will be based on a 9 MeV Linac. The X-ray source’s energy spectrum is modeled and simulated using the GEometry ANd Tracking (Geant4) software, which employs Monte Carlo techniques extensively utilized for simulating and calculating the spectra of various linear accelerators, including X-ray beams [27–30], and electron beams [31, 32].
The computational simulation model comprises a target, an outer shielding for the target, a primary conical collimator, filters, and an ideal detector. Tungsten is selected as the target material with a thickness of 2.5 mm. The choice of tungsten as the target material is based on several key factors: materials with higher atomic numbers produce X-rays with relatively higher energy, making them suitable for penetrating denser substances, allowing X-rays to penetrate deeper into objects and enhancing imaging depth; tungsten has an extremely high melting point (3422 degrees Celsius), making it resistant to melting under the impact of high-energy electron beams. tungsten has a lower absorption cross-section for X-rays, meaning that relatively less energy is absorbed by the target material during the X-ray production process, and more energy is converted into X-rays. This helps improve X-ray production efficiency; tungsten as a target material for X-ray sources has been widely applied and validated in many applications.
Lead is chosen as the outer shielding material surrounding the target. Radiation scattering may occur around the target material, necessitating shielding material to reduce the propagation of radiation. Lead is a typical choice for shielding material because of its excellent X-ray absorption performance. The primary collimator employs tungsten material and is positioned behind the target material. Its purpose is to minimize X-ray beam scattering and guide the X-ray beam downstream to the detection system. Tungsten is a common choice due to its sufficient heat resistance and high atomic number since the primary collimator needs to withstand high-energy X-ray beams. The distance between the filter and the primary collimator is 1 mm, with material choices including lead, copper, iron, and aluminum. The thickness of the filter ranges from 0 to 100 mm. The detector is positioned 1000 mm away from the target, covering a cone angle of 23° for the X-ray beam. The simulated incident electron count is 5×10⁷. The schematic diagram of the model’s planar structure and the simulation model are illustrated in Fig. 1.

Planar structure diagram of the energy spectrum simulation model.
The CT system designed for detecting defects mainly consists of three parts: the Linac X-ray source, graphite materials, and a gas detector. The energy of the X-ray source is 9 MeV, and it has been optimized with the addition of the filters described above. The object under examination is the graphite material used in HTR, with a density of 1.8 g/cm3. Due to the numerous types of materials, we have chosen one type with a relatively higher quantity for detection. Considering the geometric parameters of the object, the distance between the X-ray source and the rotation center of the object (DSO) is 2092 mm, with a maximum thickness to penetrate of 834 mm. The distance between the X-ray source and the gas detector (DSD) is 4000 mm, arranged in an arc, and the pixel size of the detector is 3 mm×5 mm. The primary goal of this detection system is to identify 2 mm defects, so the design of the detector leans towards enhancing contrast. Larger detector sizes contribute to increased contrast by collecting more X-ray information, thereby accentuating density differences between different tissues in the images. Additionally, gas detectors typically exhibit good tolerance to radiation, enabling them to operate normally in high-radiation environments. The schematic diagram of the CT system is shown in Fig. 2.
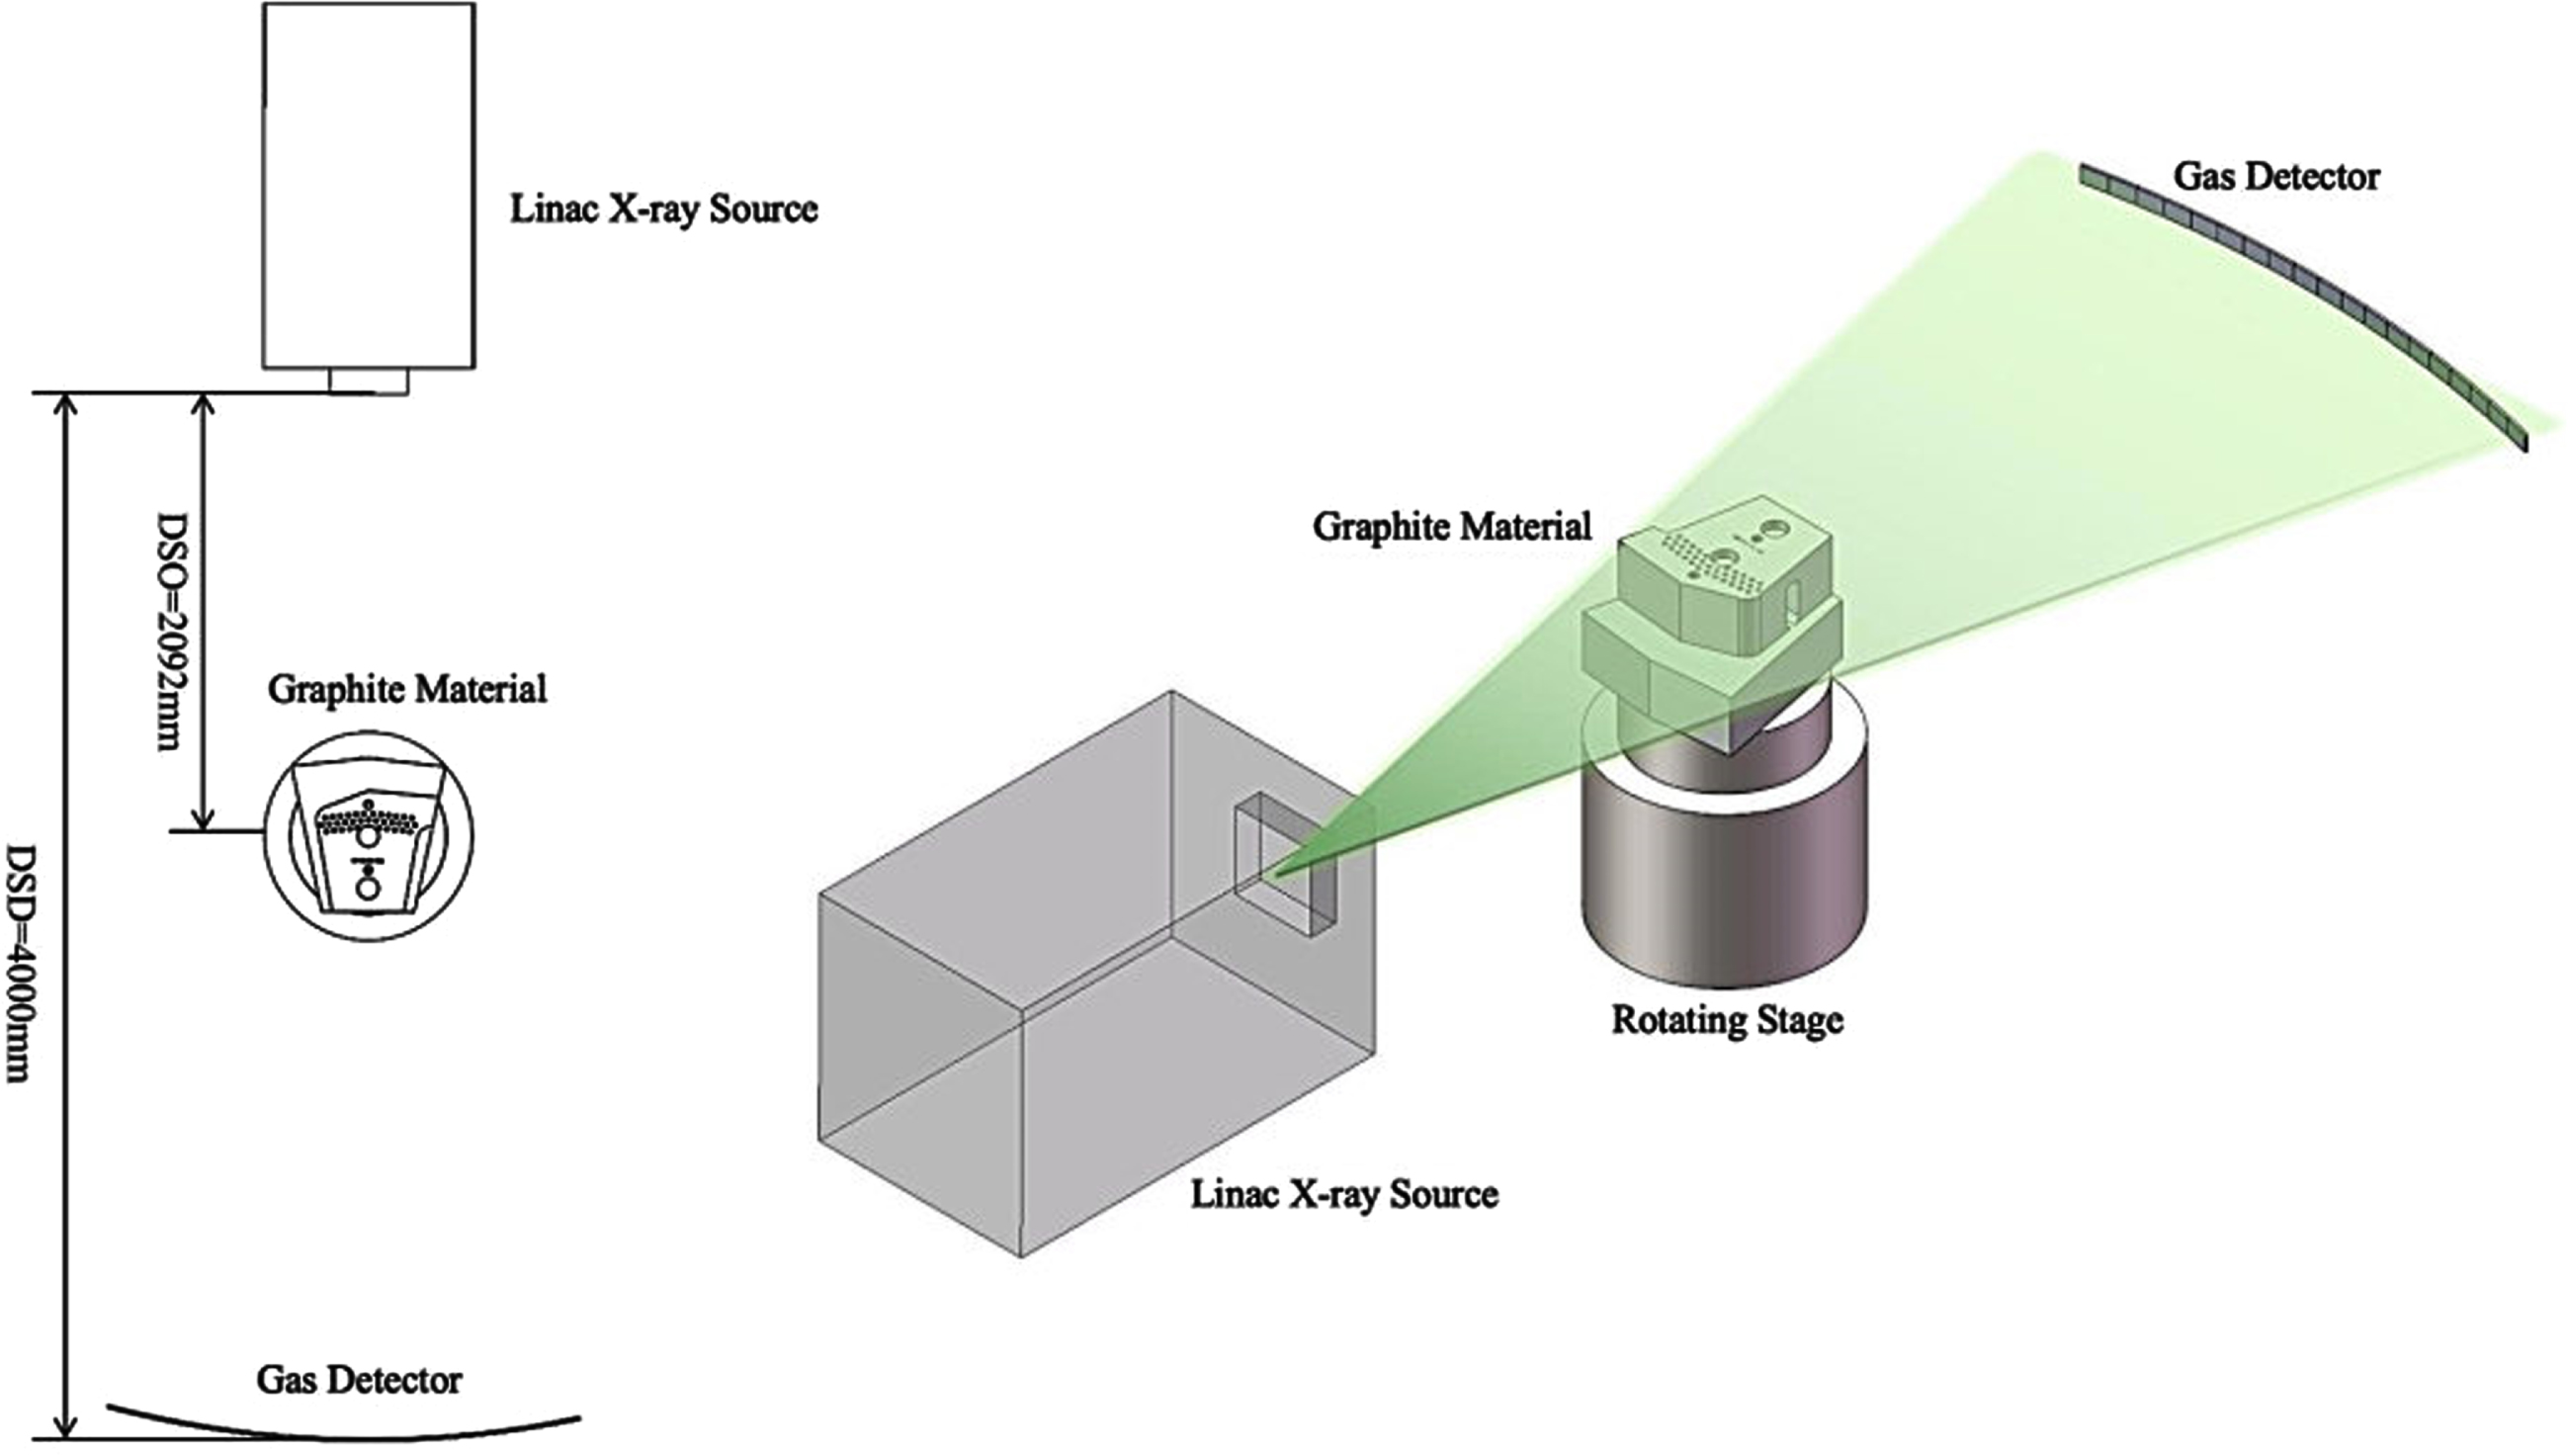
Graphite material CT detection system structure.
Hardening artifacts arise in the physical imaging process of CT images, primarily due to the interaction of polychromatic X-rays when penetrating materials. Low-energy X-rays are more readily absorbed by atoms in the object, while high-energy X-rays are relatively more transmissive. This results in an increase in the average energy of the X-ray beam after passing through the object. In the internal regions of the object, the higher average energy of X-rays leads to relatively minor radiation attenuation, making X-rays more easily transmissible, reflected as smaller values in the images. At the edges of the object, increased radiation attenuation causes X-rays to be relatively more absorbed, reflected as larger values in the images. Figure 3 displays the original and reconstructed images of graphite materials, with a resolution of 1177×1184 pixels, where each pixel corresponds to a physical size of 0.4 mm. A single row of image data from Fig. 3a and 3b is processed, with the position of the blue and red lines in the figure, intersecting with the object in the range from pixel (589,113) to pixel (589,1074). Figure 4 provides ideal image data and image data with hardening effects. In the ideal scenario, without hardening effects, as seen in the blue curve in Fig. 4, sourced from Fig. 3a, image data is consistent at the edges and the central position. The red curve represents the presence of hardening effects, sourced from Fig. 3b, where it is noticeably observed that the image values are smaller in the middle of the object and larger at the edges, consistent with the description of the impact of hardening effects on images.

Graphite Material Images: a) Original graphite material image; b) Reconstructed graphite material image.
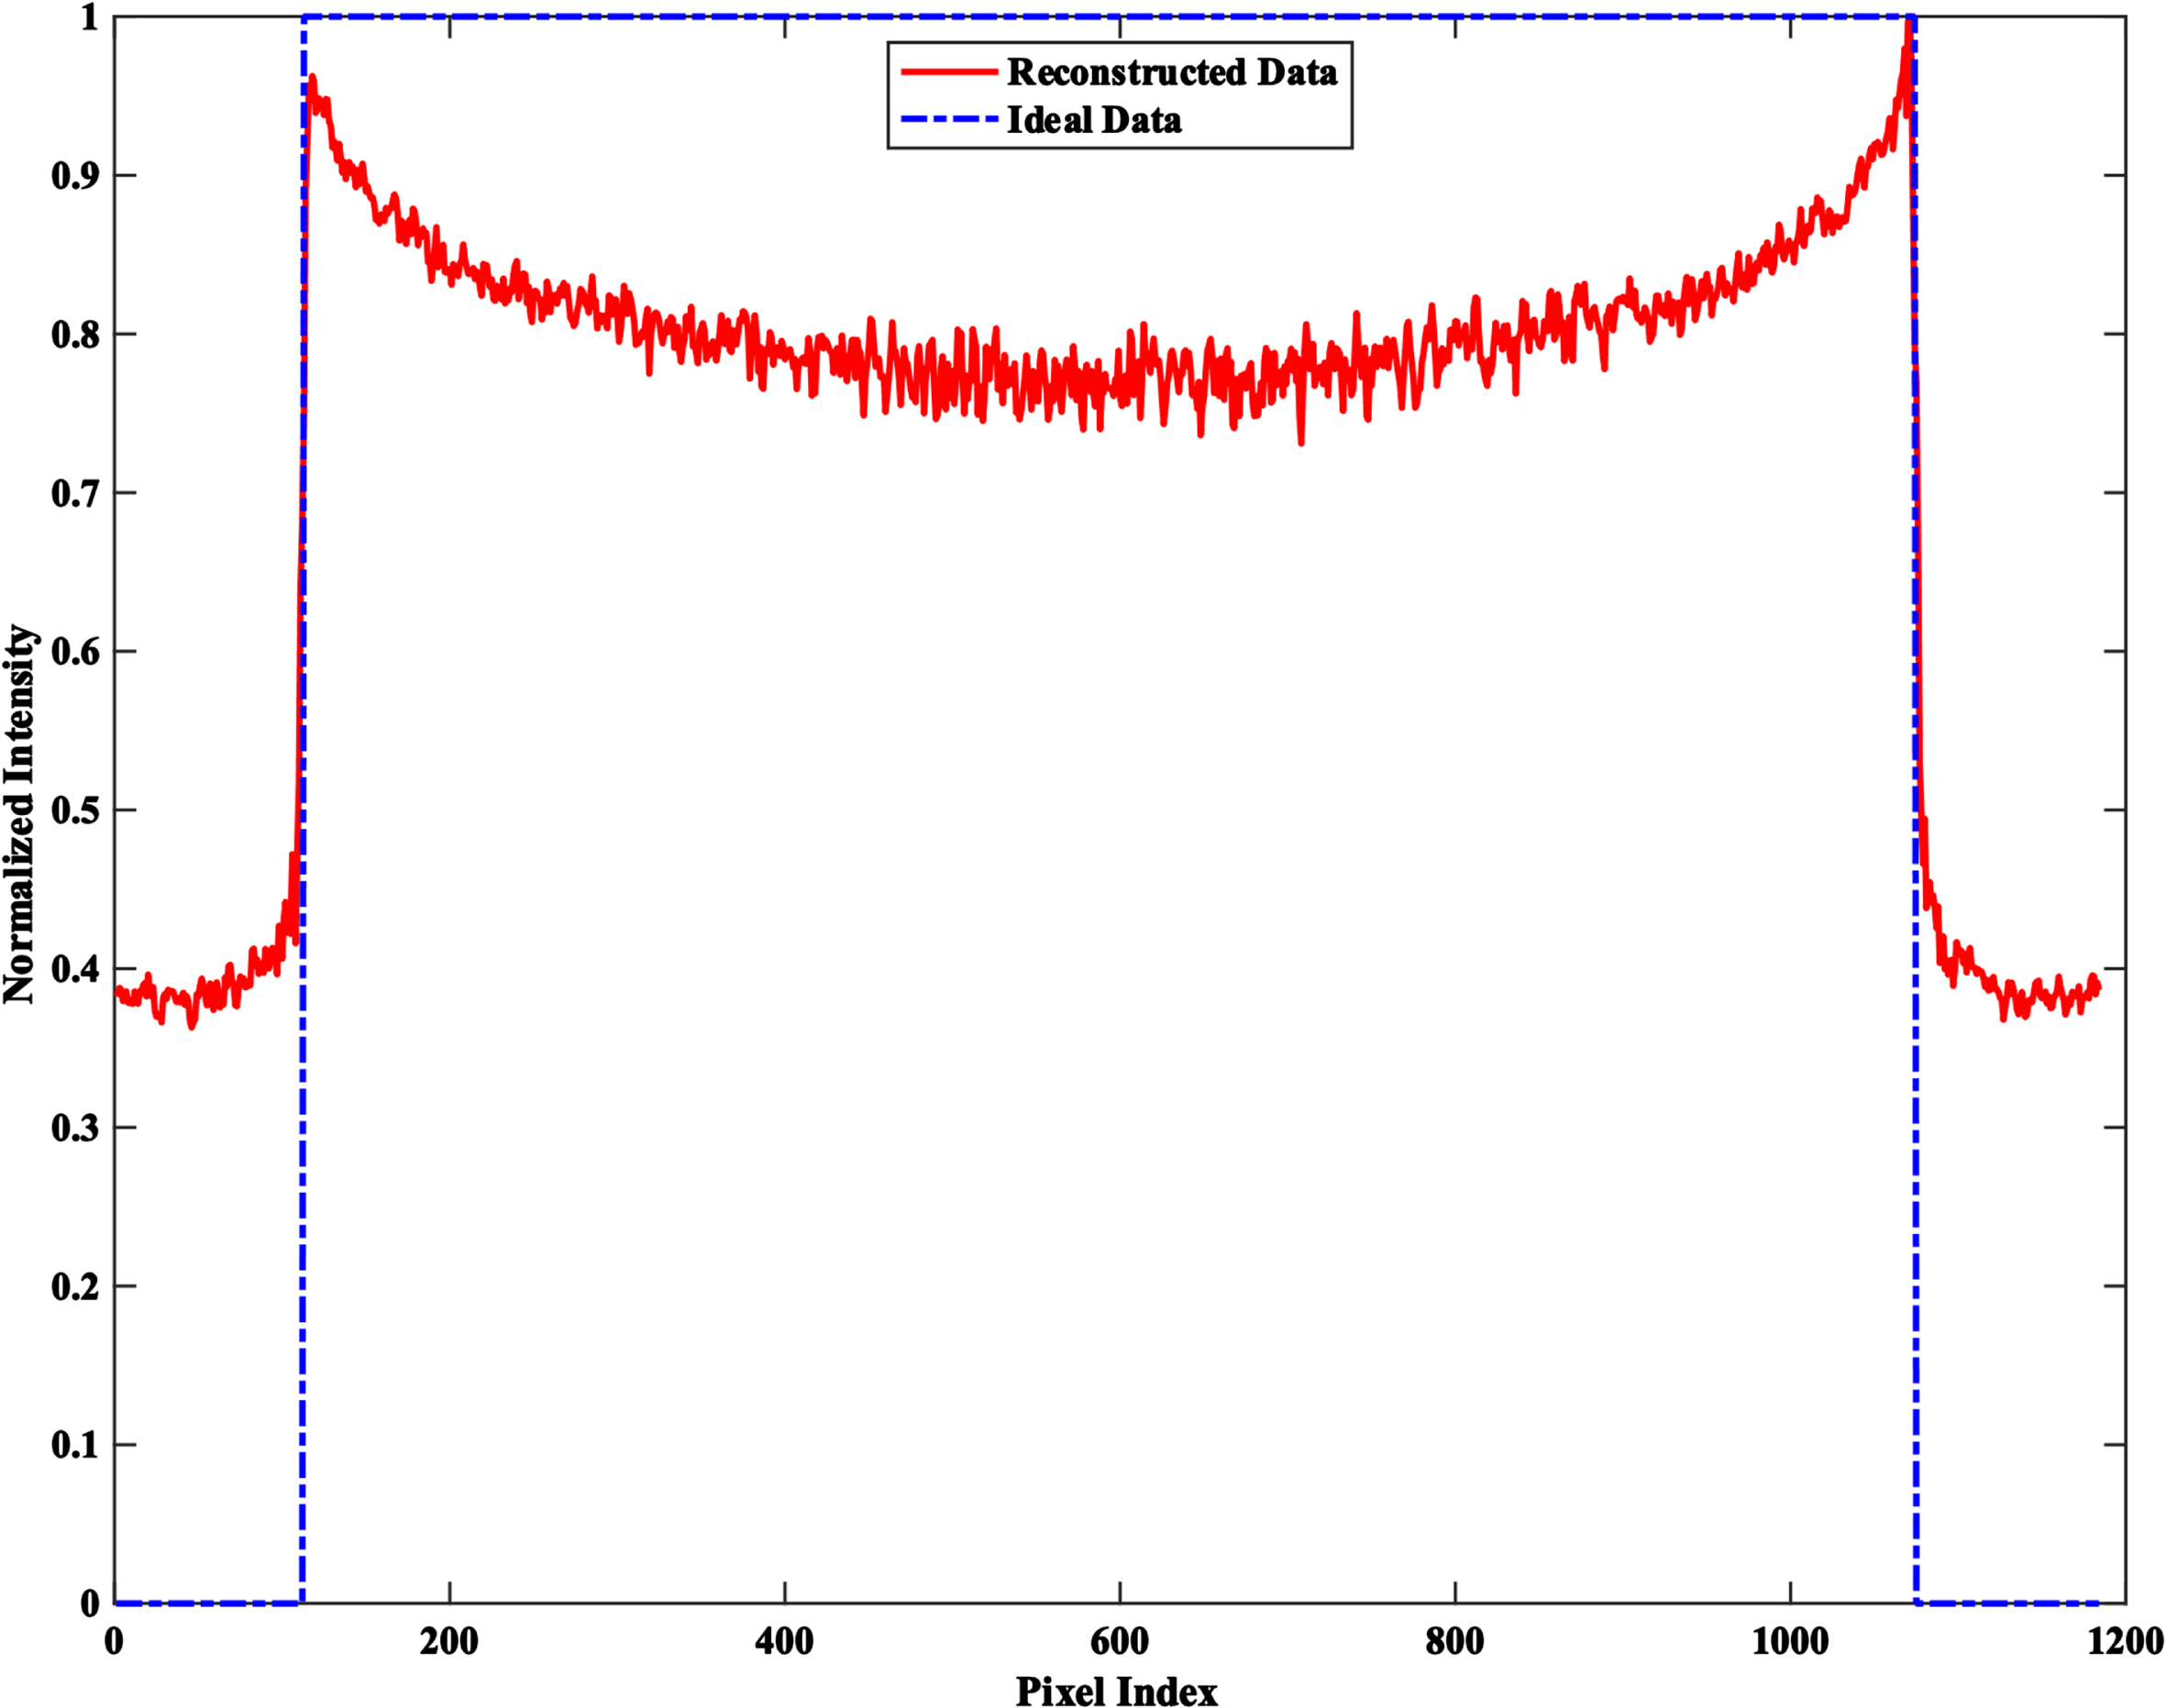
Image values under ideal conditions and at various positions with the hardening effect.
Our primary consideration in determining the material and thickness of the filter is the hardening effect, as shown in Fig. 4. Different materials and thicknesses of filters result in corresponding reconstructed data. The smaller the gap between the reconstructed data (RD) and the ideal data (ID), represented by the curve consisting of n pixels in Fig. 4, where the value of the ith pixel is ai (ID = [a1, a2, a3, . . . , an]), the less the hardening effect. The reconstructed data, also represented by a curve consisting of n pixels, with the value of the ith pixel being bi (RD = [b1, b2, b3, . . . , bn]), indicates data with hardening effects. We calculate the difference ai – bi for each pixel, using the difference vector DV (DV = [a1 – b1, a2 – b2, . . . , an – bn]), and then sum up all pixel differences, dividing by the number of pixels n to obtain the Average Difference (AD) between the two curves. A smaller AD indicates a more effective role of the filter in mitigating the hardening effect. The calculation formula is as follows:
Industrial CT image quality assessment metrics typically cover various aspects, including Peak Signal-to-Noise Ratio (PSNR) and Structural Similarity Index (SSIM). PSNR serves as a metric for evaluating the quality of image reconstruction or restoration by comparing the mean square error between the original and reconstructed or restored images. A higher PSNR value indicates better image quality. SSIM is a more comprehensive metric that considers brightness, contrast, and structural information. The SSIM value ranges between [–1, 1], with a higher value indicating better image quality. However, PSNR is insensitive to the loss of some details and structural information, and SSIM has a higher computational complexity, making it unsuitable for all scenarios. PSNR and SSIM values do not always align with human perception.
These metrics are primarily used to compare the overall differences between original and reconstructed images. However, in the context of defect detection, specialized metrics are required to better reflect the contrast and significance of defect regions. Here, we propose a new metric called the Defect Contrast Index (DCI). In the calculation of this metric, the brightness characteristics of the defective region are first measured by computing the average value μdefect of the defective area image. Subsequently, the image features of the non-defective region are further described by calculating the average value μnon - defect and its standard deviation σ
non - defect. The calculation formula for DCI is as follows:
DCI focuses on the contrast between defective and non-defective regions in the image, reflecting the significance of defects. DCI comprehensively considers the characteristics of the entire image by comparing the average values and standard deviations of the defective and non-defective areas.
The increase in filters results in a decrease in the flux of the X-ray source, which will impact the value of σ non - defect. Therefore, we will jointly consider both AD and DCI metrics to determine the optimal filter. This approach will enhance the ability to detect defects in HTR graphite materials more effectively.
Insert defects of two different sizes into the original image in Fig. 3a, as depicted in Fig. 5b. The red region includes defects with a side length of 1 mm, and the blue region contains defects with a side length of 2 mm. The quantity of defects for both sizes is 120 each.
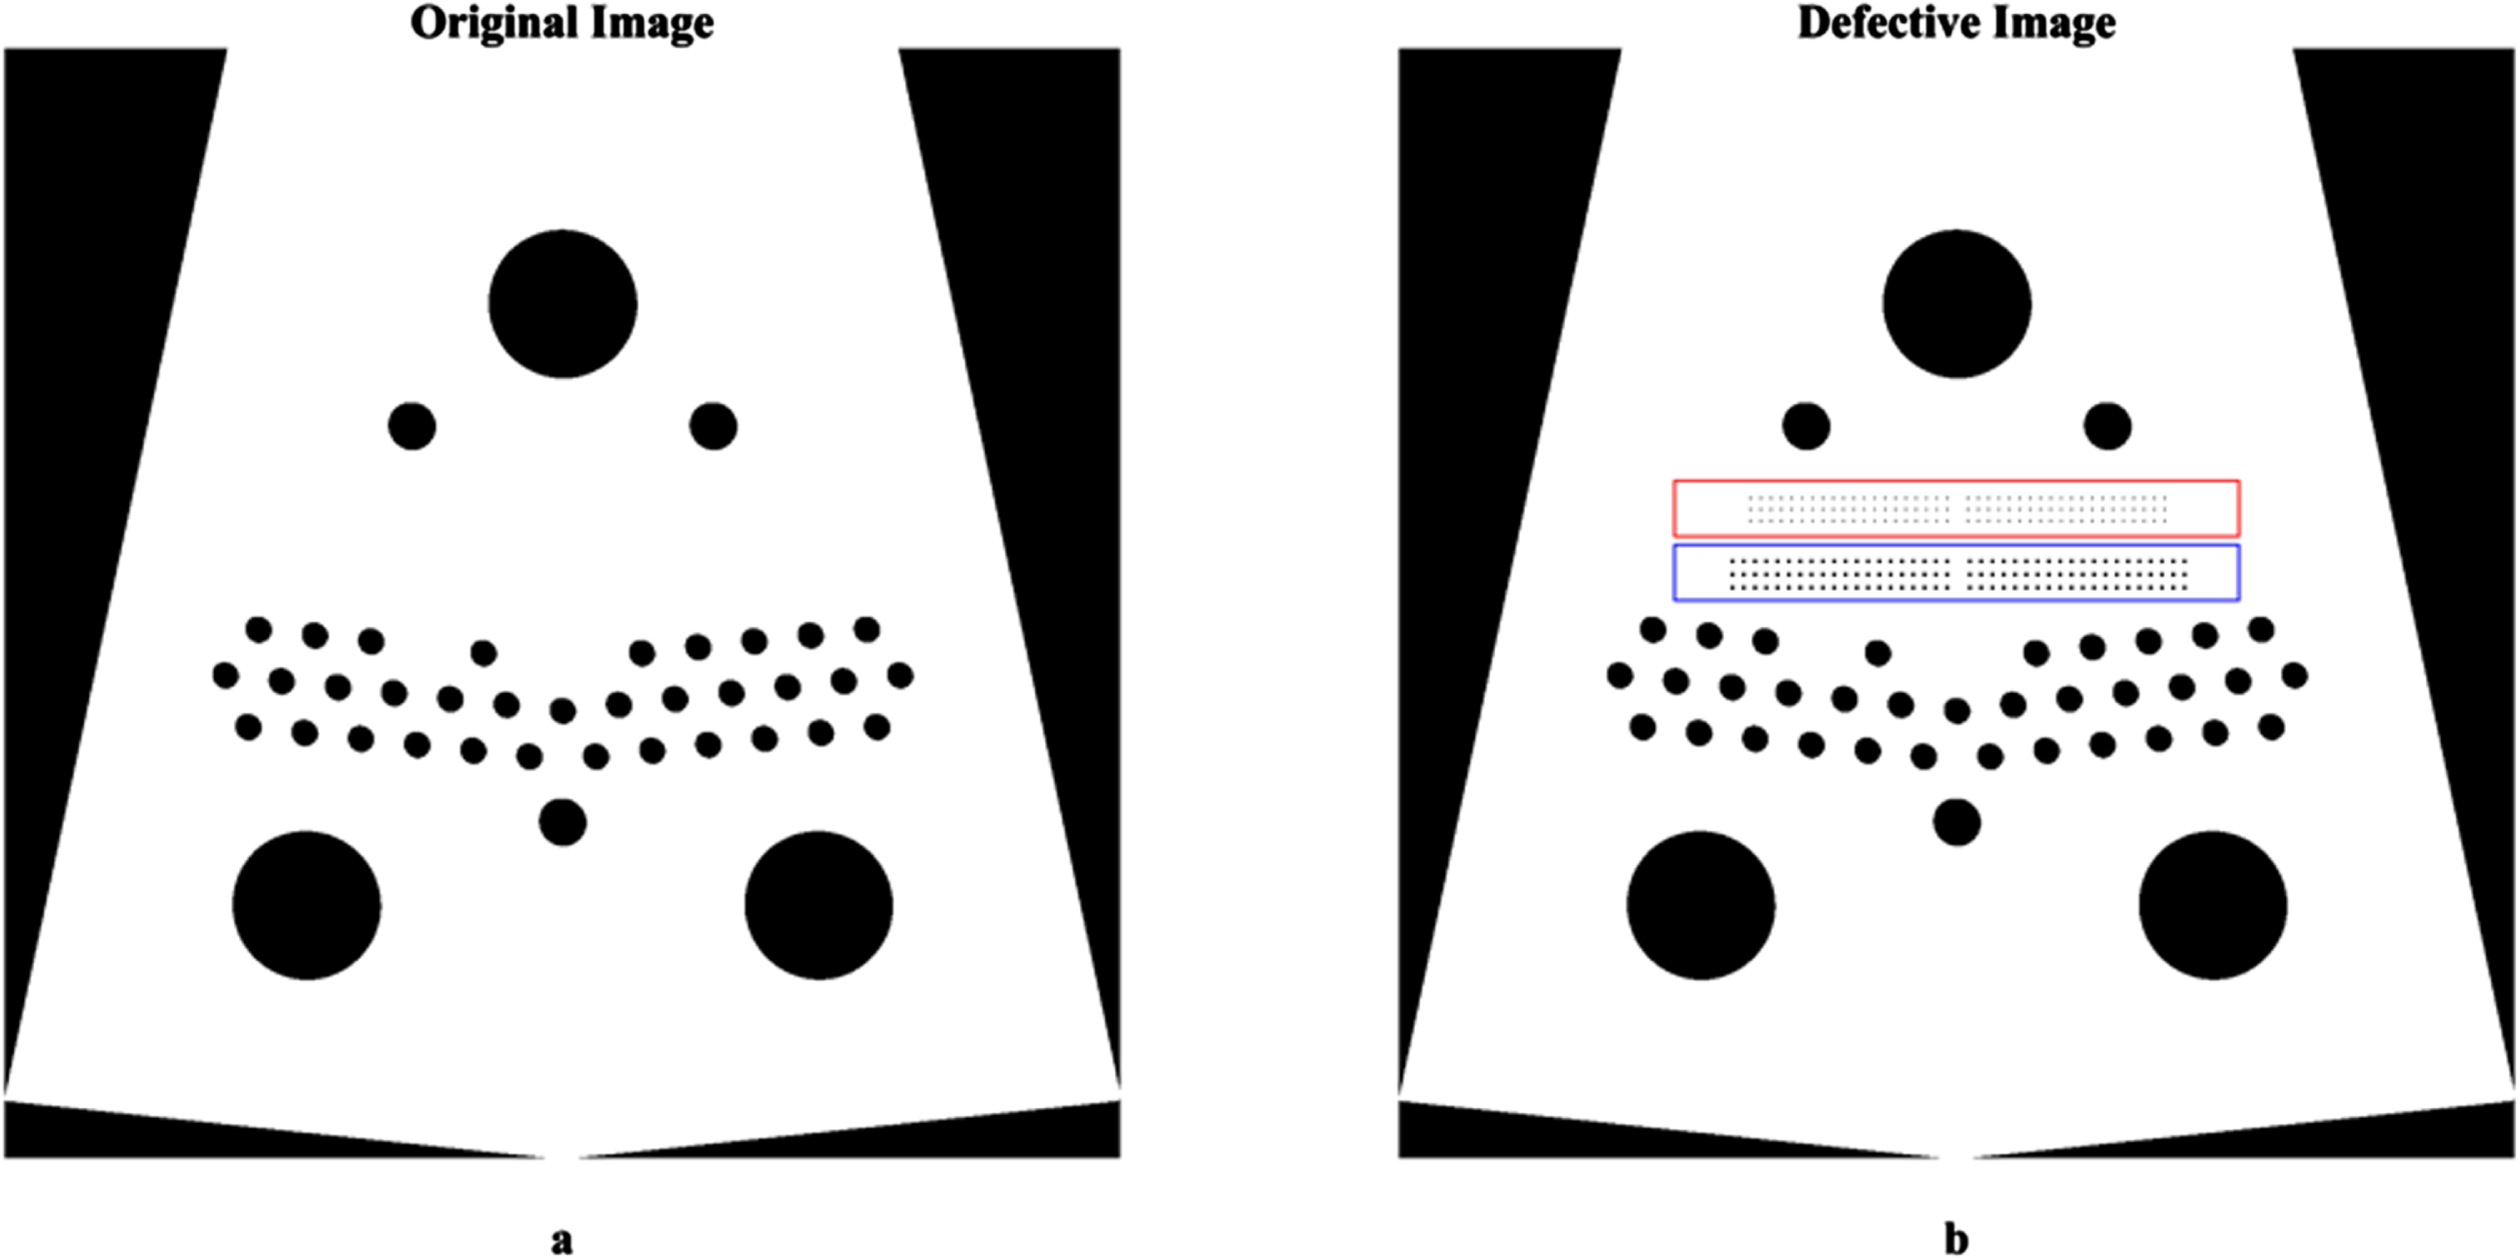
a) original image; b) image containing defects.
In this study, energy spectrum simulations were conducted for four materials— lead, copper, iron, and aluminum— using filters with thicknesses ranging from 0 to 100 mm, under a 9 MeV Linac X-ray source. The spectra for each material at different thicknesses are illustrated in Fig. 6. With the increase in lead filter thickness, the X-ray flux decreases the most, and the spectral peak gradually shifts to the right. Compared to lead, copper and iron exhibit a smaller decrease in flux, with their spectral peak positions located to the left of the lead filter’s spectral peak position. Aluminum experiences the least decline in flux, and the position of its spectral peak remains essentially unchanged.

Four filter materials – Pb, Cu, Fe, Al, with Thickness Ranging from 0 to 100 mm.
For a more quantitative analysis of the energy spectrum data and to illustrate the impact of adding filters on energy and flux, we introduce the concept of Equivalent Energy (EE). The calculation formula is as follows:
The energy spectrum data is represented as (Ei, Ni), where Ei is the energy, Ni is the corresponding count value, and i = 1, 2, . . . , n. Ntotal is the total count value, and ω i is the weight. Through formulas 6 and 7, we obtain the Equivalent Energy (EE) for the different thicknesses of the four materials, as shown in Fig. 7. For lead material, the energy increases rapidly with thickness compared to other materials. When the filter thickness approaches 100 mm, the energy nearly reaches a plateau. Copper and iron materials show a continuous increase in energy within the 0–100 mm thickness range, while aluminum material also exhibits a gradual increase, albeit at a slower rate.

Equivalent energy of X-ray for different thicknesses of four materials.
Figure 8 displays the percentage decrease in flux for the four material filters at different thicknesses. The reduction in flux has two adverse effects: a decrease in image contrast and an increase in noise. Flux reduction leads to a decrease in the number of photons in the image, affecting image contrast. Reduced image contrast may make it more challenging to accurately detect defects. Flux reduction can result in a relatively higher level of noise in the image. This is because, under low-flux conditions, statistical noise may have a more significant impact on image quality. Smaller defects may not generate sufficient signal to distinguish them from the noise. Therefore, finding the optimal balance between energy and flux is crucial to achieve the best detection performance for 2 mm defects in HTR graphite materials.

Variation in X-ray flux for different thicknesses of four materials.
The higher the average energy of multi-energy X-rays, the smaller the hardening effect. Figure 9 illustrates reconstructed images for various materials at partial thicknesses. The projection data in Fig. 9 are all obtained through numerical simulation. According to Fig. 7, it is observed that the average energy of lead significantly increases with the gradual thickening of the material. Consequently, the impact of hardening artifacts on the image diminishes. When the thickness of lead reaches 100 mm, the image exhibits a much-improved contrast with a darker center and brighter edges compared to the scenario without any filter. In contrast, the average energy of aluminum filters increases slowly, so even when the thickness reaches 100 mm, the change in image quality is not as pronounced.
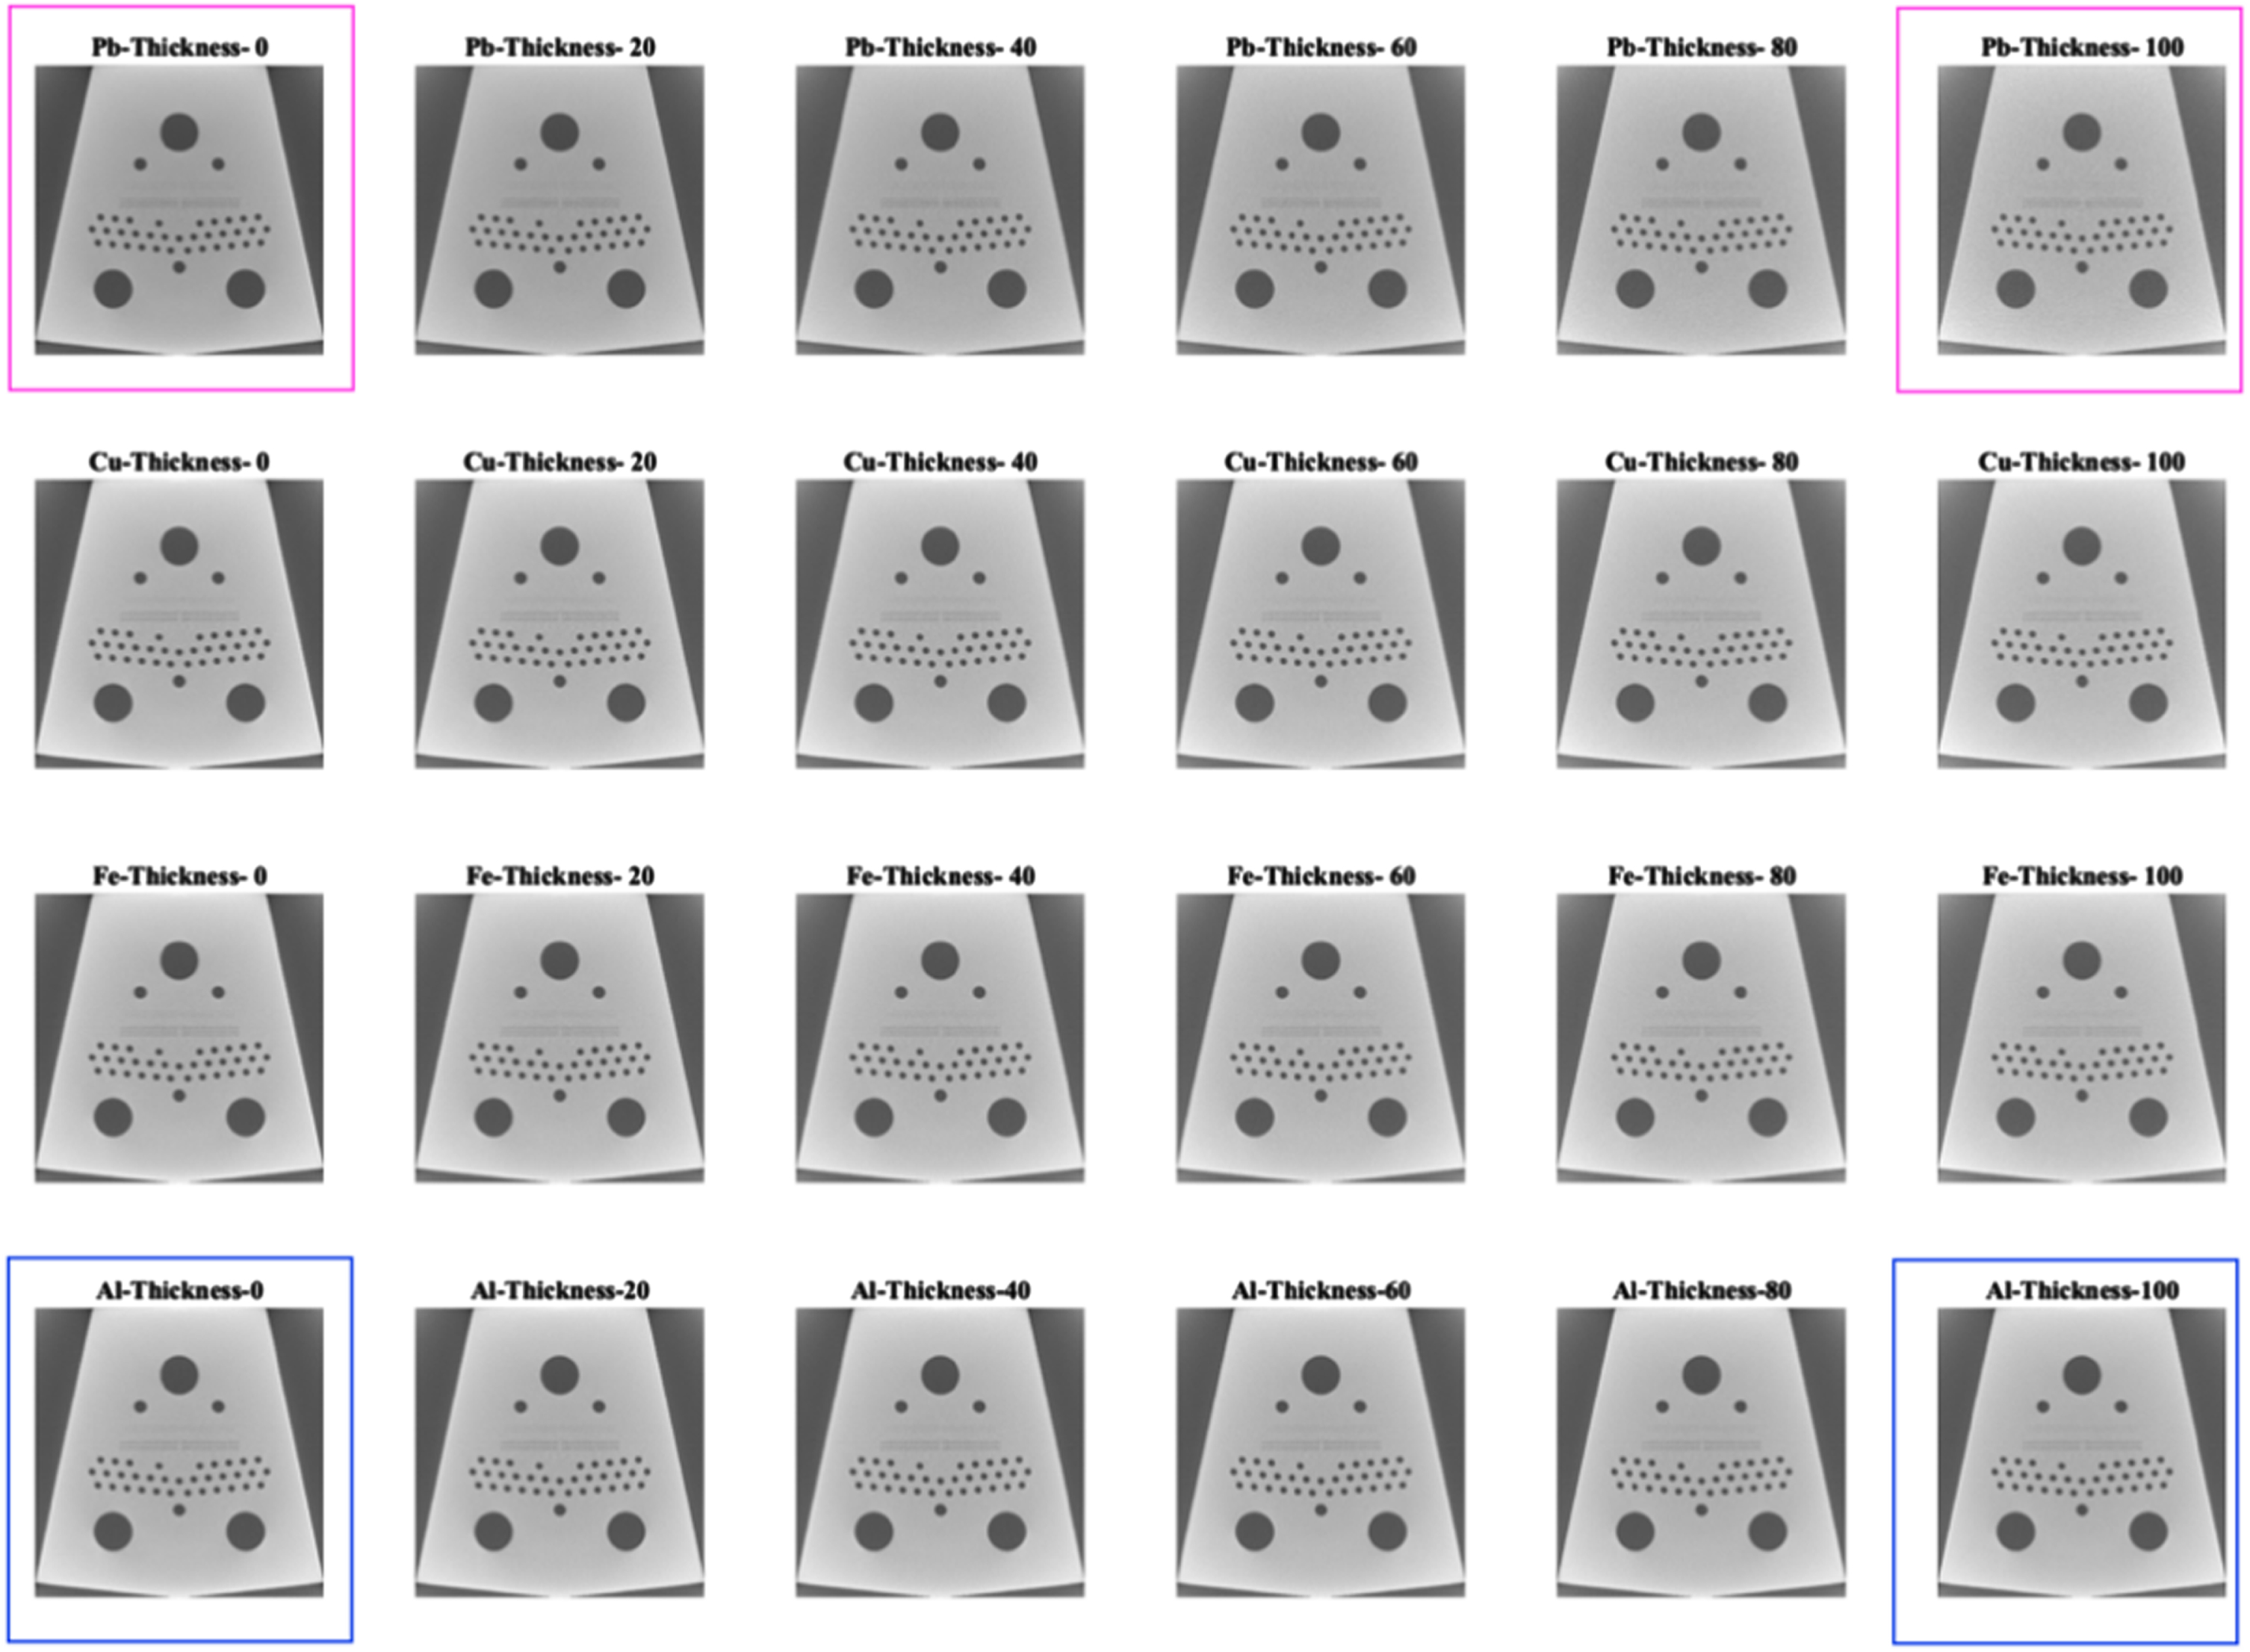
Reconstructed images of four materials (lead, copper, iron, aluminum) at various partial thicknesses.
By utilizing spectrum data and the formula described earlier (Formula 4), we computed the AD for different materials and thicknesses, as shown in Fig. 10. Judging from the fitted curves, lead exhibits the best performance, with smaller AD values indicating closer proximity to the ideal curve. We observed that within the 0– 40 mm range, the lead’s AD drops rapidly; however, beyond 40 mm, with increasing thickness, the improvement in hardening effects gradually diminishes. Copper and iron materials show hardening effects at 100 mm comparable to 40 mm lead. In contrast, aluminum exhibits a substantial difference in hardening effects compared to lead. Based on the current results, we may consider selecting a 40 mm lead filter and a 100 mm copper or iron filter, and through calculations, a 40 mm lead could achieve a 24% reduction in hardening effects.
The average difference under different materials and thicknesses.
Figure 11 illustrates the Defect Contrast Index (DCI) under different materials and thicknesses. This index primarily describes the significance of defects in the overall image, with a greater impact on the hardening effect in the early stages. As the filter thickness increases, the hardening effect gradually diminishes, leading to an increase in the defect contrast index. However, when the filter thickness reaches a certain level, a decrease in flux results in a reduction in image contrast. Therefore, the defect contrast index shows an initial increase followed by a decline.
Defect contrast index under different materials and thicknesses.
Lead filters exhibit a significant advantage in this index, maintaining a relatively high level within the 30–50 mm range. Considering the influence of both the AD and the practical impact of equipment usage, the actual flux loss is greater than simulated, leading to the selection of a 35 mm lead filter as the optimal choice for the Linac CT system for detecting defects in HTR graphite material. At this point, the defect contrast index is 3.226, and the hardening effect is reduced by 22%. Typically, a defect contrast index value greater than 3 is required for the image to meet basic resolution requirements. Figure 12a displays an alternative defect arrangement with three concentric circles centered on the image’s midpoint, radiating at 50 mm, 80 mm, and 200 mm, each hosting nine 2 mm diameter hole-type defects. Figures 12b and 12c respectively exhibit the reconstructed images without a filter and with a 35 mm lead filter applied. The projection data for both images were obtained through simulation with Geant4 software. The reconstructed images under two conditions reveal that the inclusion of a filter significantly improves the imaging of defects.
a) Original image containing 2 mm defects; b) Reconstructed image without filter; c) Reconstructed image with 35 mm thickness lead filter.
In this study, we proposed a filter design more tailored to the requirements of defect detection to address the challenges in detecting defects in HTR graphite materials. The system, with filters of different materials and thicknesses, was simulated using the Geant4 Monte Carlo software, generating corresponding spectra that served as the input source for the CT imaging system. By combining the Average Difference (AD) and Defect Contrast Index (DCI), we determined the optimal filter. With the use of this optimal filter, the reduction in hardening effects amounted to 22%, and the DCI reached 3.226, meeting the requirements for detecting 2 mm defects. This provides a clear image for subsequent intelligent defect recognition algorithms.