



Abstract
Reproductive Health Account construction was a long-envisioned dream in the State of Karnataka, India, for capturing inter-actor fund flows in reproductive health. Previous attempts in few states lead to successful identification of enablers and disablers within this systemic context. A Reproductive Health Account was constructed using primary reproductive health expenditure data, collected from a pre-estimated sample size of 519 households spread across 15 villages, using probability proportional to size method, from two selected sub-districts Channapatna and Ramanagara, having mediocre performance indices, within Ramanagara District of Karnataka. Secondary data were extracted from public health websites. Expenditures incurred on six types of health services by respondents of reproductive age group (15–49) during financial year, 2017–2018, within two sub-districts was collected over financial year, 2018–2019. Processed data were then converted to four ‘origin to destination’ matrices each capturing fund movement among two actors, based on accounting principles of National Health Account to develop a contextual Reproductive Health Account. Study included four actors namely financial sources, financial agents, health providers and health activities, all pertaining to reproductive health domain. Matrices helped identify a massive 87.23% burden on households, majorly financed by mortgage bearing astronomical interests and sale of meagre assets. Public sector healthcare at 5.47% was found performing unsatisfactorily. Tertiary level was absorbing disproportional amount of 62.93% funds in conjunction with the laboratory and imaging services. Moreover, pharmaceutical bills at 22.97% caused prolonged distress to these households. Government intervention towards absence and shortage of quality infrastructure at the primary and secondary sector levels needs reviewing, for containment of the massive out-of-pocket expenditures.
Keywords
Introduction
Reproductive Health Account (RHA) matrices help in capturing fund flows among various actors involved in reproductive health (RH) (Willekens, 2005). World Health Organization (WHO, 2003) suggests a minimum of four matrices to justifiably construct RHA. RH was declared a prerequisite for attaining sustainable development at Cairo International Conference on Population and Development (ICPD) 1994. Meagre proportion of India’s GDP in RH has not ensured access. Indian States such as Karnataka still face inter-district disparities and overbearing problem of out-of-pocket-expenditures (OOPE) incurred by household (HH) according to Himanshu and Källestål (2017). Evidence earlier by Rannan-Eliya and Berman (1993), followed by Berman (1997), suggested disaggregation of fund flows into formal and informal sectors using satellite accounts helped better define actors and their expenditure estimates. In 2000 and 2002 under POLICY project in the State of Rajasthan, Sharma et al. followed by Kanjilal reported narrow coverage of public expenditure, 80% OOPE borne by HH, bias present in RH subsidy, extortion by private institutions and pharmacy gulping above 50% (Sharma et al., 2000, 2002). Later several studies found RH care being rarely used by marginalised women (Hazarika, 2010; Kumar et al., 2011; Kumar & Mohanty, 2011; Mohanty & Pathak, 2009; Pathak et al., 2010; Prakash et al., 2011; Sarkar & Mahesh, 2019). Saikia and Kulakarni (2017) indicated Health Management Information Systems, surveillance and survey modification can help achieve ICPD goal. In 2018, National Health Systems Resource Centre (NHSRC) used standardised Health Accounts Production Tool (HAPT) to produce matrices involving all four actors namely financial source (FS), financial agents (FA), health providers (HP) and health functions (HF) (National Health Systems Resource Centre et al., 2018). In 2019, member countries at Nairobi marking 25 years of Cairo Conference, re-endorsed the need for RHA in fulfilling Sustainable Development Goals (SDG) covered under Agenda 2030.
Yet, no consolidated efforts post RH mapping in Karnataka by Panchamukhi et al. have been made to tap potential data source of ever-expanding private sector dominated by HH, doubling up as both financing agents and sources (Mishra et al., 2006). HH financed RH studies are minimal. OOPE in RH, stressed repeatedly in the literature, was taken up as a modest effort to fill this gap of research. The following research questions served as baseline for this study undertaken at sub-district level:
How is reproductive health being financed? Who is paying how much, into which schemes, to which providers at what levels and for what functions? How are the resources of reproductive health expenditure being managed and by whom? Who are the final beneficiaries from the expenditures incurred on reproductive health?
Research Objectives
Above-mentioned research questions helped formulate two research objectives:
To construct ‘four origin to destination’ matrices capturing use of funds between four key actors (FS, FA, HP and HF) involved in the RH sector finance, based on NHA methodology, contextualised for sub-district level. To find out share of public spending compared to individual OOPE in overall RH expenditure.
Methods
Conceptual Framework
Study draws its conceptualisation from two frameworks: NHA, India, 2013–2014 and WHO (2009) Guide to producing RHA, within the NHA Framework. These contributed in matrix construction to understand the tri-axial system of consumption, production and finance of RH based on local actors, thereby aiding data collection in the sub-districts of Karnataka.
Reproductive Healthcare Boundaries of Classification According to RHA (2009)
Conceptual framework informs that boundary of RHA is determined by (i) set of activities related to reproductive health, (ii) geographical frontier of one nation and (iii) time-limit of one financial year.
Design of Matrices
WHO (2003) guidelines recommend two-dimensional tables where ‘origin’ of funds is shown as columns and ‘destination’ is shown as rows. The (i, j) cell of the table shows amount that originates in ‘j’ used by ‘i’.
Present study includes four RHA fund-movement matrices by the type of financing sources and financing agents (FS × FA), by type of financing agents and health providers (FA × HP), by type of health providers and health functions (HP × HF) and by type of financing agents and health functions (FA × HF).
Operational Definitions of Variables
FS: Study includes public sector (State and Central Government) as FSs providing funds to the FAs, while private sector includes private enterprises and insurance companies, HHs, for-profit money lending institutions, not-for-profit donors, and external aid granting institutions.
FA: Study includes public sector FAs receiving funds from FSs and channelling them towards health service payments to HP, like Yeshasvini Scheme by Department of Cooperation, Government of Karnataka, Insurance Scheme by Employees State Insurance Scheme Corporation (ESIC) and Central Government Health Scheme (CGHS) by Ministry of Health and Family Welfare (MHFW), while private sector includes Individual Voluntary & Group Insurance Companies plus HH.
HP: Study includes public and private sector HP receiving funds from FA for providing HF, namely those operating at primary level Sub-Centres, Primary Health Centres (PHCs), dispensaries and medical practitioner’s clinics (excluding dental providers), secondary level hospitals, tertiary level super-speciality hospitals (excluding mental health providers) and finally few radiology and pathology centres including the in-house sections located within health facilities.
HF: Study includes inpatient and out-patient curative care, ambulatory care, rehabilitative care, laboratory and imaging services including patient plus attendant’s transportation, consultation and accommodation on which funds from FAs, channelised through HPs, were spent under six accounts namely reproductive health disorder, pregnancy, neo-natal, family planning, abortion and miscarriage treatments.
Rationale for Choosing Area of Study
Although mapped, Karnataka is seen lagging compared to Southern States of India, in terms of service deliveries, infrastructural quality, RH performance indicators, quality and monitoring, ease of financial transactions and OOPE. The two successive rounds of National Family Health Survey (NFHS 3 & 4) and District Level Health Survey (DLHS) 3 & 4, shows progress yet inter-district disparity in RH performance in fields of Antenatal care, marriageable age and institutional delivery rates.
Ramanagara District having high BPL percentage, mediocre per-capita income yet low health expenditure is mediumly positioned in terms of District Composite Development Index (DCDI), Reproductive Health Index (RHI) and Human Development Index (HDI). Two of the four talukas (sub-districts) with medium Composite Taluka Development Index (CTDI), namely Ramanagara and Channapatna, were chosen based on similarity in health and development infrastructure yet contrasted health performance indicators.
Design of the Study
A two-stage HH survey study design was adopted. HH sample size was chosen using Household Survey Calculation method recommended by United Nation’s, Department of Economic and Social Affairs Statistics Division:

where nh, parameter to be calculated is sample size of households; z statistic defines level of confidence desired; r an estimate of a key indicator to be measured by the survey; f, sample design effect, deff, assumed to be 2.0 (default value); k, multiplier accounting for anticipated rate of non-response; p, the proportion of the total population accounted for by the target population and upon which parameter, r, is based; ň, the average household size; e, is the margin of error to be attained.
Recommended values for developing economies’ household surveys by United Nation’s, Department of Economic and Social Affairs Statistics Division are: z statistic = 1.96 for 95% level of confidence, k = 10% for developing economies, ň = 6, e = 10% of r. Putting the recommended values, the formula reduces to: nh = (84.5)(1–r)/(r)(p). It was decided that the main survey indicator to measure ň is the household reproductive health expenditure which was expected to be about 20% of the household general health expenditure (HGHE) and HGHE is about 68% of total health expenditure. In this case, r = 0.2 and p = 0.68. (Based on 2013–2014 Household Expenditure Data of NHA and Hospital survey feedback of researchers.) The sample size is calculated at 497. Keeping a conservative estimate, 519 HH were selected.
Two-stage probability proportional to size (PPS) method (Table 1) was used to choose specific HH based on information provided by the District Census Handbook, Ramanagara, village and town-wise Primary Census Abstract (PCA) Abstract, 2011.
PPS Sampling Details of HH.

PPS: Probability proportional to size; HH: Household; Prob: Probability.
The cluster-wise HHs were chosen keeping central post office (thickly populated residential area) as starting point and google satellite location to identify peripheral residential areas. Data were collected during the period starting from June 2018 to May 2019. Evidential data (bills or registration) incurred by HHs in the financial year beginning from 1 April 2017 to 31 March 2018 were included which were spent on HPs within these two sub-districts. Only reported health actors mentioned by HHs were included in this study.
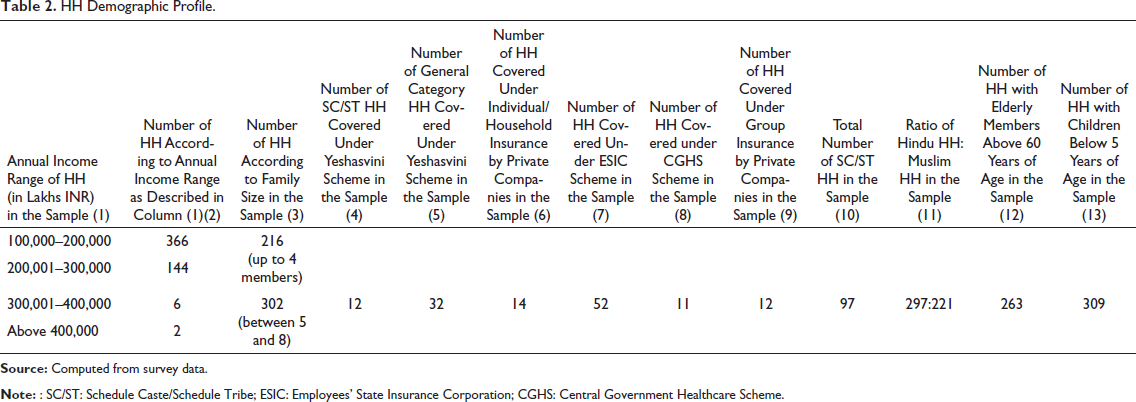
Majority of HH (Table 2) were characterised by annual income lesser than ₹0.3 million income, larger family sizes due to presence of elders and children plus lack of insurance coverage.
HH Demographic Profile.
Survey Instruments
‘WHO Guide to produce RH Sub-Account’ recommended survey tools of HH Questionnaire, Men’s and Women’s questionnaires catering to HH and Expenditure Profiling were used as interview schedules. Government sites provided secondary data about existing RH schemes in Karnataka.
Ethical Consideration
Institutional Ethical Clearance prior survey was taken. Post-orientation, HHs were conveyed about data confidentiality. Written consent was obtained from head of the HH. Keeping in mind the sensitivity of the topic, respondents were given sufficient time and space to reflect, recall and provide the relevant information from comfort of their households. In certain circumstances, repeated visits were made to finish the interview sessions.
Results
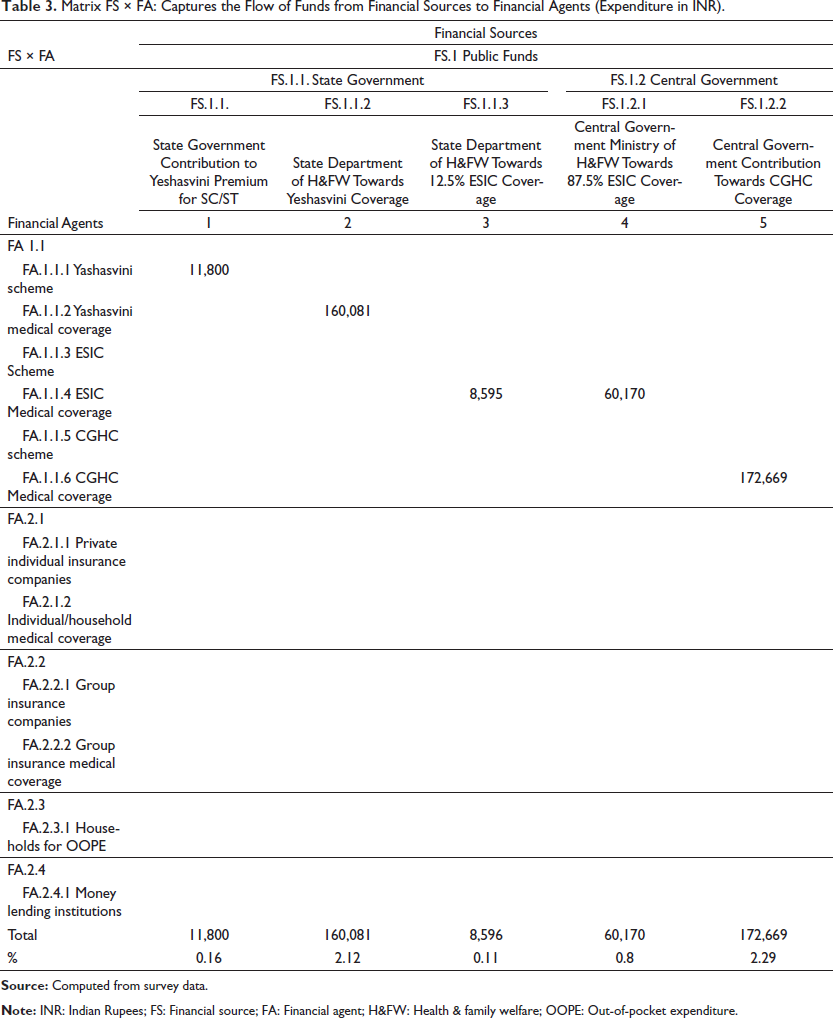
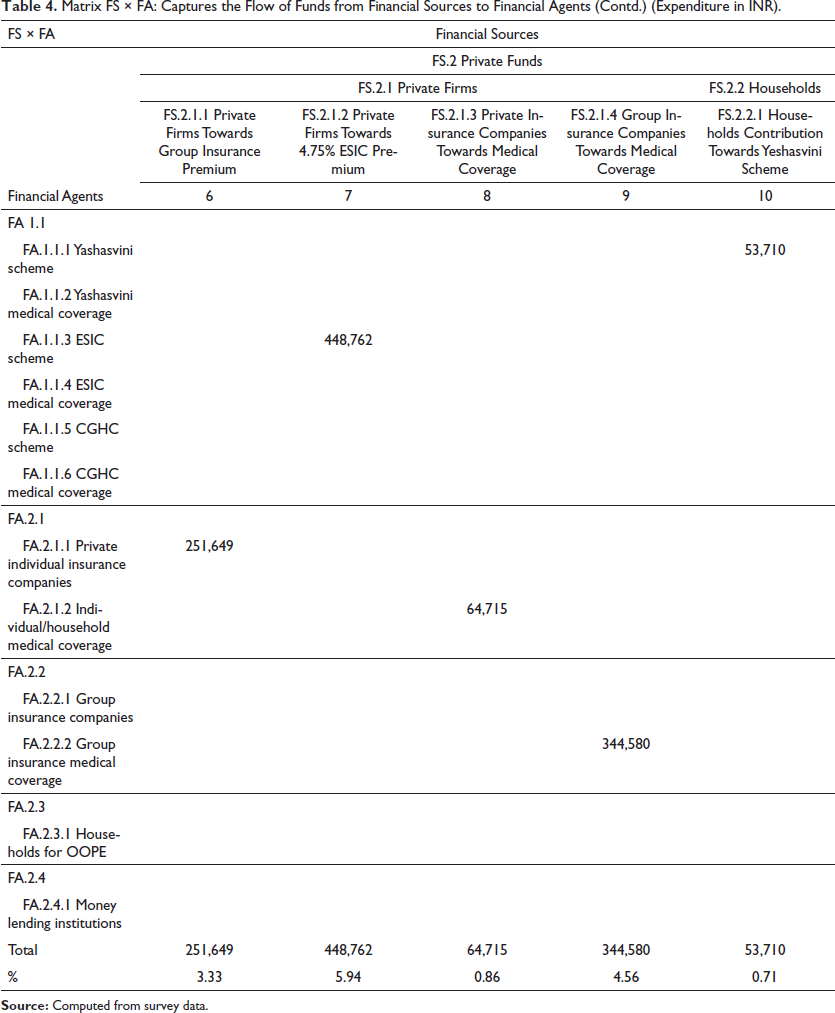
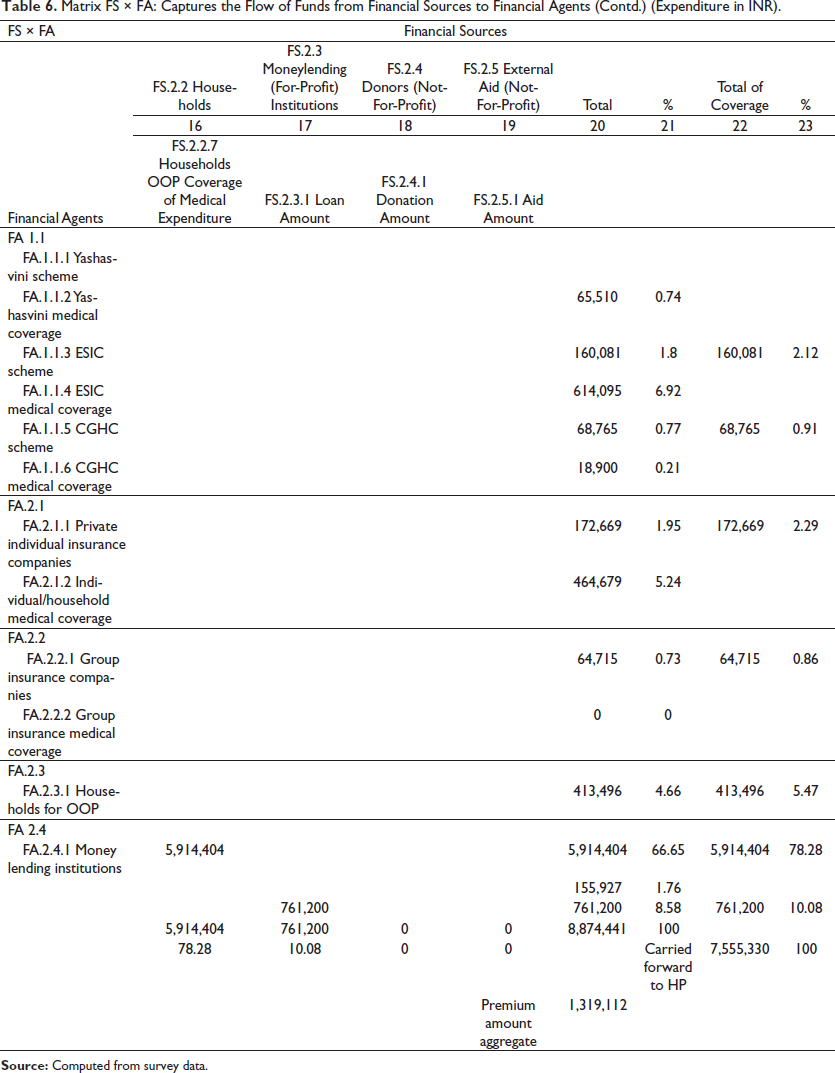
The first matrix FS × FA (Tables 3–6) captured disaggregated fund movement initiated by FA from FS. Yeshasvini scheme required self-paid annual per-capita premium of 300 and 710 INR (SC/ST more subsidised) for rural and urban areas respectively towards OPD and in-patient coverage up to 1.25 and 2 lakhs for specific procedures covered by the Karnataka Health and Family Welfare Ministry. ESIC scheme jointly financed coverage in ratio 12.5:87.5% (State and Union Government) recovered premium from enterprises and employees in the ratio of 4.75:1.75% (Employees’ State Insurance Corporation, n.d.). CGHS provides 100% coverage charging a nominal employee premium (Ministry of Health and Family Welfare, n.d.). Information details of Enterprise Group Insurance schemes were collected from Human Resource personnel. Voluntary Insurance policy details were collected from relevant websites. Personal Loans information collected from questionnaire response were cross-verified with market rates. This could have led to some non-sampling error. OOPE of HH were tallied with medical bills and provider rates, details of which are beyond the scope of this article. The matrix findings show that the State and Central Government contribution to RH care finance is miniscule 2.39% (1.8 lakhs) and 3.08% (2.3 lakhs), respectively. The private sector (for-profit and not-for-profit) contributed 14.69% (11.1 lakhs). HH contributing 87.23% (65.9 lakhs) in RH were leading to catastrophic indebtedness playing a dual role of FS as well as FA. About 59 lakhs was reportedly financed from their pockets using desperate measures as sale of assets such as house, land and jewellery. More than 7 lakhs were financed by pledging assets at astronomical interests. The sample demographic profile is highly representative of the actual population in terms of low insurance coverage. Mandatory public social security sans user fee is desperately needed.
Matrix FS × FA: Captures the Flow of Funds from Financial Sources to Financial Agents (Expenditure in INR).
Matrix FS × FA: Captures the Flow of Funds from Financial Sources to Financial Agents (Contd.) (Expenditure in INR).
Matrix FS × FA: Captures the Flow of Funds from Financial Sources to Financial Agents (Contd.) (Expenditure in INR).

Matrix FS × FA: Captures the Flow of Funds from Financial Sources to Financial Agents (Contd.) (Expenditure in INR).
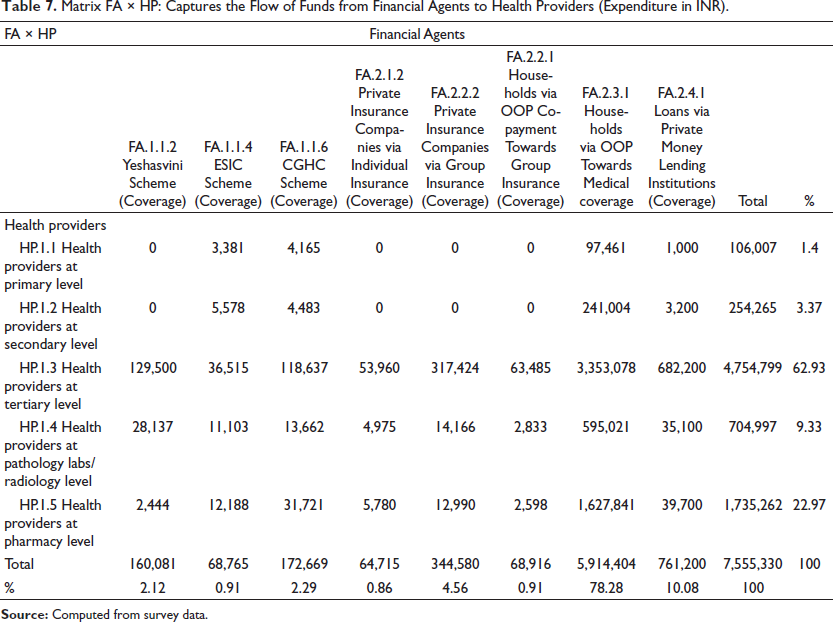
The second matrix FA × HP (Table 7) tracked the fund movement from the FA to HP. HPs received a meagre 1.4% (1.06 lakhs) from all FA. A disbalance prevails since primary HPs included in Universal Health Coverage (UHC) objective of India received a miniscule amount. Secondary HPs offering RH inpatient, out-patient, curative care and ambulatory care received 3.37% (2.5 lakhs) only. An alarming 62.93% (47.5 lakhs) was flowing into tertiary HPs. Both primary and secondary HPs can offer both rehabilitative and specialised services so a possibility of a nexus to make tertiary HPs referrals might exist. The diagnostics and radiology level providers (mostly private) were absorbing 9.33% (7.04 lakhs) of funds from FA calling for serious capital/infrastructural investment. Pharmaceutical providers were gulping massive 22.97% (17.4 lakhs). Patient needs require addressal by the healthcare monitoring agencies.
Matrix FA × HP: Captures the Flow of Funds from Financial Agents to Health Providers (Expenditure in INR).
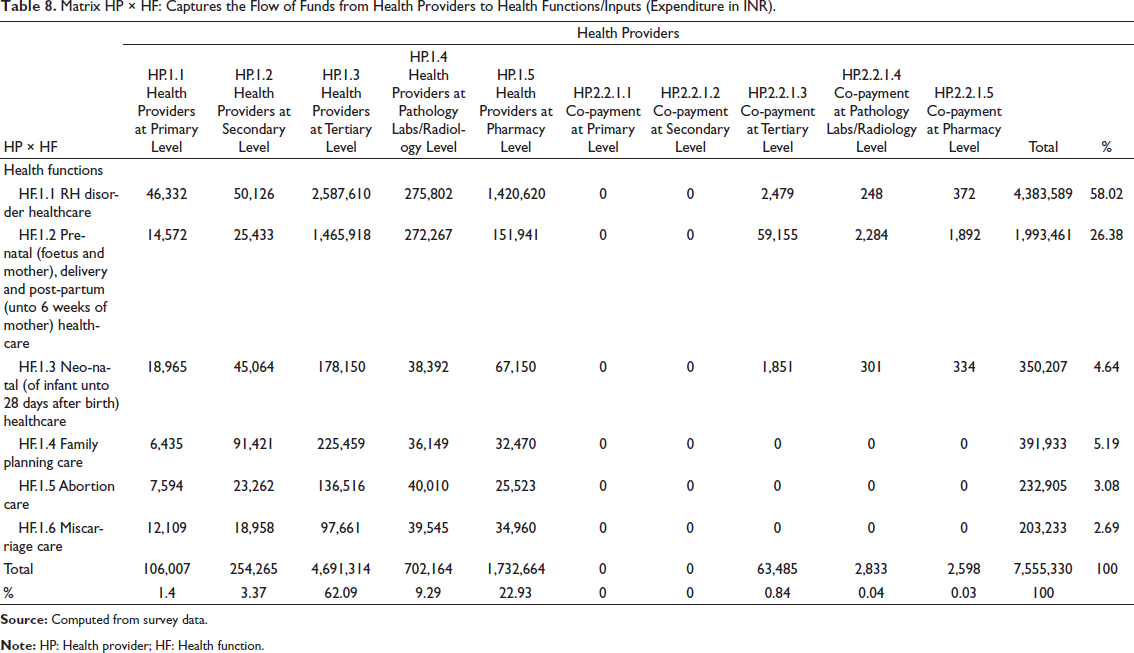
The third matrix HP × HF (Table 8) disaggregated the funds now available with the HPs functioning at various levels. 58% (43.8 lakhs) of all the funds were going into RH Disorder treatments specifically at tertiary level a whopping 59% (25.8 lakhs). Indian Public Health Standards (IPHS) mandates trained medical officers and specialists at primary and secondary level. Pregnancy related expenditures absorbed overall 26.3% (19.9 lakhs) and 73.5% (14.6 lakhs) at tertiary level. Other four RH functions used funds up to 5.2%. An agonising finding indicates omnipresent private sector providing laboratory, diagnostic, radiology facilities draining 9.2% (7 lakhs) and Pharmacy adding another massive 22.9% (17.3 lakhs). Government must ensure trained staff, usable facilities, free and subsidised good quality post-procedure drugs.
Matrix HP × HF: Captures the Flow of Funds from Health Providers to Health Functions/Inputs (Expenditure in INR).
The final matrix FA × HF (Table 9) captures fund movements from FA to HF. It verified the fund received from HP in the third matrix and traces it back to the FA. HF financed by Yeshasvini covered only 2.12% (1.6 lakhs), ESIC at 0.9% (0.68 lakhs), CGHS at 2.2% (1.72 lakhs), profit and non-profit enterprise insurance 5.4% (4 lakhs) and massive OOPE covered rest 79.1% (59.8 lakhs) expenditures. Personal loan financed OOPE at 10.08% (7.6 lakhs) pushed HH towards severe financial crisis. Absorbing 85.4% (63.7 lakhs) from FAs were RH disorder and pregnancy/delivery care. Strict government monitoring of IPHS guidelines can alleviate this.
Matrix FA × HF: Captures the Flow of Funds from Financial Agents to Health Functions/Inputs (Expenditure in INR).

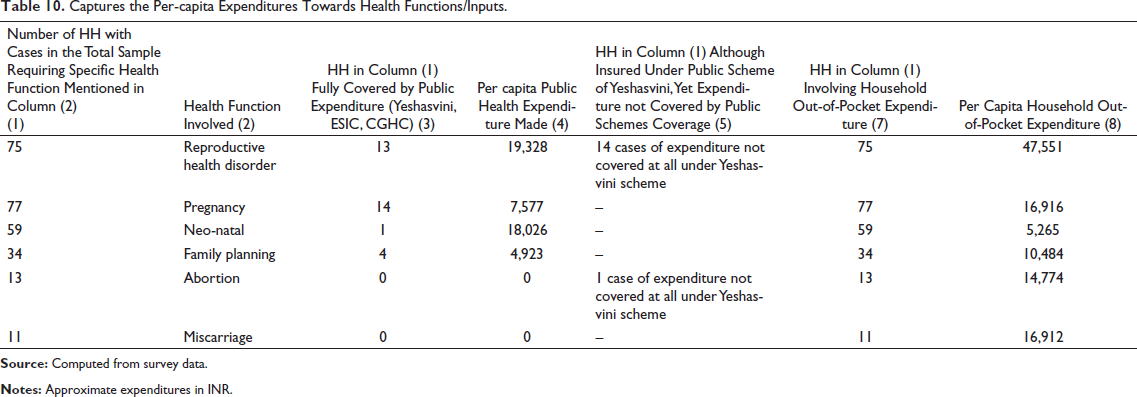
Table 10 shows per-capita public expenditures involved in all the HFs were unsatisfactory (barring one neo-natal case). Faulty list of ‘covered services’, paperwork and instances of non-reimbursement caused OOPE.
Captures the Per-capita Expenditures Towards Health Functions/Inputs.
Discussion
Summary of Findings from HH Survey and Suggested Strategies
Findings indicated that the public sector co-payment financed schemes covered only 5.32% of insured’s expenditures in RH, reason being only (17.18%) of OOPE incurring HHs were insured. Insured availed for episodic healthcare is supported by another Indian study by Kusuma et al. (2018). Private for-profit insurance schemes covered specialised hospitalisation healthcare beyond 24 hours. A grassroots specific community needs assessment becomes mandatory. Self-help groups can become intermediary between village panchayat/municipality. Identification of eligible HH by Ayushman Bharat clearly is not avoiding impoverishment.
Findings of this study did not align with 2007 study claiming a high public insurance awareness by Reshmi et al. (2007). Social insurance advertisements in relevant localities via theatre promos, radio and posters can showcase ‘caught off-guard’ health contingencies says 2018 Economic Times advertorial (Advertorial in The Economic Times News, 2018).
Next private sector stands out majorly dominated by HHs as FA contributing a massive 79.19% in co-payments. 10.08% OOPE financed by borrowings similarly reported by earlier studies was impacting lifestyle via implicit costs (Bajpai et al., 2017; Haghparast-Bidgoli et al., 2015; Kashyap et al., 2018; Mishra & Mohanty, 2019; Sharma et al., 2002). Indian Government’s target of doubling the public health expenditure by 2025 necessitates stronger Health Management Information System (HMIS) tracking. Better trained community-based workers (ASHAs) can help impoverished HH identification.
The fund flows from FA to HP showed heavily skewed tertiary level expenses. Private sector burden-shifting tactic among primary and secondary level providers using inappropriate referrals can’t be ruled out. Under Ayushman Bharat Pradhan Mantri Jan Arogya Yojana (PMJAY), coverage of marginalised HH requires mandate on a family floater basis. Sarkar and Mahesh in 2020 called for 24/7 public facilities with free in-patient pharmacy dispensing is not catered by Health & Wellness Centres (HWC) introduced under Ayushman Bharat (Sarkar, 2020). RH disorders involving longer treatment, drew no specific schemes unlike post-delivery and abortion, absorbing massive OOPE. National Health Plan 2002, Karnataka claims of 55:35:10 percentage expenditure among primary, secondary and tertiary levels ideally should not technically lead to huge OOPE at tertiary levels (Kumar & Rani, 2019).
Incidence of 58.02% of RH disorder issues predominated among all the RH expenditures. Infertility, its major component is on the rise with urbanisation, stress levels and hormonal imbalances. Government’s National Health Mission, within the Reproductive and Child Health (RCH) package failed in treatment and assisted reproductive technology causing mushroomed unregulated private sector as corroborated by this news report (Lal, 2018). Tertiary care and longer medication caused a drain of HH resources as reported here (Goel, 2016). Universal Health Coverage (UHC) should consider full coverage (Government of India, 2013). An apt example was set by the State of Goa (Times of India, 2016). Promising amenities, minimal pre-authorisation in public facilities courtesy ‘Ayushman Bharat’ (India’s National initiative) seems fake (Ayushman Bharat Yojana, 2019; Neetu, 2018).
The last thing, inaccessibility of public infrastructural facilities leading to massive OOPE in RH incurred in private facilities, is supported by 2017 Hindustan Times article (Sanchita, 2017). Measures such as staff quarter provision, filling vacant posts, mandatory rural service for medico interns, paramedical licentiate courses, delicensing private practice, promoting outreach services, recognising achievers upholding IPHS, banning user fees and hidden costs, clear communication and respectable behaviour can enhance public healthcare utilisation.
Limitations
2012 Bhawalkar in a cross-country study, reported the limitations of RHA in the event of poor data, survey and accounting errors, medical-care indices deflation, fiscal year variances among actors and lastly documentation of donor funds as publicly financed funds rather for public use, thus, overstating public health contribution (WHO, 2012).
Study was mindful to avoid double-counting. One fiscal year was used as inclusion criterion for data, although time period of collection till completion of accounting is bound to have some nominal pricing effect. HH Questionnaire Data were tallied with HP pricing list wherever possible.
Conclusion
A massive ₹75,55,329, an alarming 8% of total annual HH income was being spent on RH. 87.23% OOPE in total RH expenditures projected a dismal public healthcare system. Government RH surveys (with publication lags) focus more on HF such as immunisation, communicable and non-communicable diseases, child and adolescent health issues, nutrition, hygiene and sanitation. Public data tend to measure utilisation of public healthcare rather than non-utilisation. Creating RHA at micro levels facilitates gap identification and tracking of fund flows among the actors involved in the eco-system. Although household surveys may suffer from recognition, recall and investigator bias but scientifically undertaken do serve as platforms drawing public attention towards private sector data in critical areas like RH.
Footnotes
Declaration of Conflicting Interests
The author declared no potential conflicts of interest with respect to the research, authorship and/or publication of this article.
Funding
The author received no financial support for the research, authorship and/or publication of this article.