
Abstract
Background
People with disabilities (PWDs) often face higher risk of financial burden towards healthcare. Higher out-of-pocket expenditure (OOPE) is a barrier towards accessing medical services, resulting in healthcare inequities between men and women. There is a lack of studies on gender disparities in healthcare burden among PWD in India. The present study examines gender inequality towards healthcare expenditure among PWDs in India.
Methods
Unit level data from the Persons with Disabilities in India Survey under the National Sample Survey, 76th round that covered 118,152 households involving 576,569 individuals of whom 106,894 had at least one disability was used. We performed secondary analysis using descriptive statistics, bivariate estimates, Blinder–Oaxaca decomposition and multilevel log-linear regression to meet the objective of the study.
Results
OOPE as a percent of monthly per capita expenditure was higher among males across all states of India except in Puducherry, Dadra and Nagar Haveli, Lakshadweep and Mizoram. This varied from 0.6% in Jammu and Kashmir to 20% in Nagaland. Multilevel analysis confirms that OOPE was significantly lesser among females (β = –0.070, 95% confidence interval = – 0.129 to 0.01) compared to males after controlling demographic and disability-related predictors. PWDs reported higher healthcare burden as a percent of total household expenditure in India, and relatively less amount was spent on female healthcare compared to male healthcare.
Conclusion
A substantial gender inequality for healthcare expenditure is found among PWDs in India. This makes for an urgent call to health researchers and policymakers towards gender-sensitive research, policy formulation and program implementation for PWDs in India.
Key Messages
Finding clearly indicates the gender gap in both OOPE and share of OOPE on total household consumption expenditure.
Female PWDs have unmet healthcare need due to OOPE and face higher burden in accessing healthcare services in India.
Ensuring healthy life and promoting wellbeing for all at all ages (goal no. 3) and achieving gender equality and empowering all women and girls (goal no. 5) are two of the sustainable development goals (SDGs) in the UN’s agenda. To reach these goals, it is key to recognize the disadvantaged and omit using a gender lens, especially among PWDs.
There is a need for ensuring that women should be benefitted through the various government programs targeted for PWDs in India.
Introduction
Globally, 15–20% population suffers from disability, and there are about 650 million people living with any type of disabilities in the world (World Health Organization, 2011). As populations age, the rate of disability is growing, mainly in the industrialised world (World Health Organization, 2011). As per the 2011 census of India, 2.21% (26.8 million) of the total 1.21 billion population are disabled of which 56% are males (around 15 million) (National Sample Survey Office, 2016). A recent national survey on disability in India found that about 2.2% population have disability in India (NSS 76th, 2018). People with disabilities (PWDs) unduly suffer greater ill health compared to non-disabled populations mainly due to poverty (Yenimahalleli Yasar, 2011).
Review of costs related with disabilities among 10 developed and developing countries shows these are related to expenditure on healthcare including cost for routine activities such as disability-specific aid(s), assistive devices, rehabilitation, personal assistance, etc., and this varies between $1,170 and $6,952 per year (Mitra et al., 2017). Previous studies have shown that households with disabled persons suffer higher percentage of catastrophic expenditure, and proportion of their household income on out-of-pocket expenditure (OOPE) on healthcare compared to households with no disabled persons (Lee et al., 2016). In the USA, healthcare expenditure was observed to be high among PWDs compared to persons without disabilities (Mitra et al., 2009).
Studies in developing countries have shown that disability is often linked with socioeconomic disparities (Mitra & Sambamoorthi, 2006). In the Indian context, only a small segment of the PWDs in India obtain and receive any government support (Mitra & Sambamoorthi, 2006). Socioeconomic and regional inequalities are well documented for prevalence of disability in the Indian context (Bora & Saikia, 2015). Some previous studies have highlighted the role of gender in health and mortality and others have focused on gender inequality in health and disability (Joe & Rajpal, 2018; Kastor & Mohanty, 2018; Sahoo & Madheswaran, 2014; Sangar et al., 2019). However, all these studies have focused on elderly and/or adult populations.
To the best of our knowledge, very few studies in India have so far attempted to understand the gender gap in healthcare expenditure among PWDs in India. High healthcare expenditure on disability may impact overall household consumption expenditure if any member in the household suffers from disability (Lee et al., 2016). Additionally, high OOPE may act as a barrier for the use of healthcare services and further result in inadequate economic safety and healthcare inequities (Kwon, 2009).
Data and Methodology
Data Source
This study used data from the 76th round of the National Sample Survey (NSS) ‘Persons with Disabilities in India’ Survey covering all states and union territories conducted during July–December 2018 (NSS 76th, 2018). The NSS is a nationwide representative population-based survey organization which collects data on several issues like employment status, morbidity, healthcare utilization, household consumer expenditure, housing condition, disabilities conditions and others. NSS 76th round covered 8,992 village/urban blocks (5,378 rural village and 3,614 urban blocks), covering 118,152 households (81,004 rural and 37,148 urban) enumerating 576,569 individuals (402,589 rural and 173,980 urban). Our study sample contains a total of 106,894 persons (74,946 in rural and 31,948 in urban; 61,567 males and 45,305 females) who reported any type of disability (locomotor, visual, hearing, speech and language, mental retardation/intellectual disability, mental illness and other types of disability) at the time of survey (NSS 76th, 2018).
Sampling Design
Census 2011 population of villages was projected by applying suitable growth rates to serve as a sampling frame. A stratified two-stage sampling design has been adopted for the NSS 76th round survey. In the first stage, villages/urban blocks were chosen by probability proportional to size with replacement (PPSWR) while in the second stage, households were selected by simple random sampling without replacement (SRSWOR) scheme in both rural and urban areas. All the households listed in the selected village/Urban Frame Survey (UFS) block/subunit (SU) were stratified into seven second stage strata (SSS). SSS 1 was formed considering the households having person(s) with any of the 11 rare disabilities ((a) acid attack victims, (b) autism spectrum disorder, (c) cerebral palsy, (d) dwarfism, (e) haemophilia, (f) multiple sclerosis, (g) muscular dystrophy, (h) other chronic neurological conditions, (i) Parkinson’s disease, (j) sickle cell disease, (k) thalassemia). SSS 2 was formed from the remaining households (i.e., excluding the households in SSS 1) having at least one person with mental disability. SSS 3 was formed from the remaining households (i.e., excluding the households in SSS 1 and SSS 2) having at least one person with speech disability. SSS 4 was formed from the remaining households (i.e., excluding the households in SSS 1, SSS 2 and SSS 3) having at least one person with visual disability. SSS 5 was formed from the remaining households (i.e., excluding the households in SSS 1, SSS 2, SSS 3 and SSS 4) having at least one person with hearing disability. SSS 6 was formed from the remaining households (i.e., excluding the households in SSS 1, SSS 2, SSS 3, SSS 4 and SSS 5) having at least one person with locomotor disability. SSS 7 was formed considering those households without any disability. A total of 20 households were planned to be selected from each sample village/UFS block/SU for canvassing the detailed schedule. The sample households from each of the SSS were selected by SRSWOR (NSS 76th, 2018).
Outcome Variables
OOPE
The NSS 76th round survey captured both the medical expenditure (surgery, equipment, hospitalization, etc.) and non-medical expenditure (transport, lodging, food, etc.) for infrequent expenditure during the last 365 days from the date of survey, along with usual monthly expenditure (excluding those covered infrequent expenditure during the last 365 days) (NSS 76th, 2018). We calculated OOPE for our study using the following method:
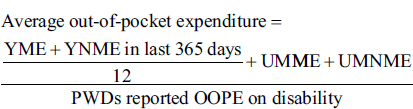
where, YME = medical expenditure specific to the disability like expenditure for assistive devices, YNME = non-medical expenditure specific to the disability, UMME = usual monthly medical expenditure and UMNME = usual monthly non-medical expenditure
OOPE Burden
We examined the OOPE burden as a percentage of OOPE on the total household consumption expenditure (Mitra et al., 2009; Sahoo & Madheswaran, 2014).

Household Monthly Consumption Expenditure (HMCE)
We used monthly household consumption expenditure as a proxy variable for household income similar to previous studies (Joe & Rajpal, 2018; Kastor & Mohanty 2018; Sangar et al., 2019). This is a preferred measure as it is less prone to disparity and of being underreported or overreported when compared to income (Kastor & Mohanty, 2018). Based on the NSS 76th round, we calculated the monthly consumption expenditure using the following formula (NSS 76th, 2018):

where, A = usual consumer expenditure in a month for household purposes out of purchase, B = imputed value of usual consumption in a month from homegrown stock, C = imputed value of usual consumption in a month from wages in kind, free collection, gifts, etc. and D = expenditure on purchase of household durables during the last 365 days
Defining Predictor Variables
The OOPE varies across socioeconomic and disability-related characteristics of disabled person and household. For the present study, we used appropriate socioeconomic predictors at individual level, namely, age as four broad age groups (0–14, 15–35, 36–59 and 60 years and above), gender as male and female, educational status (illiterate, up to primary, middle and secondary and above), marital status (never married, currently married and others), relation to head of the household (self/spouse of head, married child and spouse of child, unmarried child, grandchild and other family members and relatives) and household level, religion (Hindu, Muslim and others), caste (Scheduled Tribe (ST), Scheduled Caste (SC), Other Backward Class (OBC) and others) and monthly per capita expenditure (MPCE) (poorest, poorer, middle, richer and richest), while at community level, variable includes as place of residence (rural and urban) and geographic region (north, central, east, northeast, west, south and union territories). In addition, we included disability-related variables such as types of disability (locomotor, visual, hearing, speech and language, mental retardation/intellectual disability, mental illness and other types of disability) and certificate of disability (yes/no). These predictor variables are found to be relevant for determining the OOPE and healthcare burden due to disability in several previous studies done in India and other countries (Lee et al., 2016; Moradhvaj & Saikia, 2019; Palmer et al., 2011).
Statistical Analysis
We used descriptive statistics, bivariate estimates, Blinder–Oaxaca decomposition and multilevel log-linear regression analysis for the present study. In the first step of the analysis, the descriptive statistics and bivariate estimate were carried out to compare healthcare burden, and the mean OOPE for males and females separately by socioeconomic and disability-related characteristics. In the second step of the analysis, we used Blinder–Oaxaca decomposition method to examine the gender inequality in OOPE. The Blinder–Oaxaca decomposition method is widely used to explain the gap between two groups like poor and non-poor, male and female, rural and urban, etc. (Blinder, 1973; O’Donnell et al., 2007; Oaxaca, 1973). The Blinder–Oaxaca decomposition model can be defined as
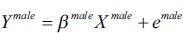
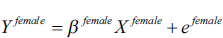
where, Y is OOPE, X is the vector of predictor variables, βs are the regression coefficients and e is the error term. In this study, we are using the same vector of predictors for males and females, that is, Xmale = Xfemale. Hence, the gap in out-of-pocket payments among males and females can be calculated by

where,
In the third step of the analysis, we carried out the multilevel regression model to examine the role of the gender after controlling socioeconomic and disability-related predictor variables for OOPE. The multilevel model is appropriate for estimating separately the variance and determining the extent of heterogeneity in OOPE on disability at different levels, for example, in the first level (individual), nested within the second level (village), nested within the third level (state), which was used by a previous study (Leone et al., 2013). The NSS 76th round data was collected using a hieratical structure (individual nested within village/urban block, village/urban block within the state). However, the NSS 76th round data do not have information at district level; hence, we have not included the district as a level in the multilevel modelling.

Where, i level 1 (individual), v level 2 (village), s level 3 (state)


where,
This study contains a range of predictors hence screened variables were adjusted for multicollinearity using variance inflation factor (VIF). Wherever VIF was found to be more than 10, that variable data was excluded from the model. Since the OOPE data was found to be skewed, we converted the OOPE into a log scale (Eeckhaut, 2020; Manning, 1998).
In the fourth step of the analysis, we carried out a test of interaction effects between gender (i.e., male vs. female) using selected socioeconomic and disability-related characteristics (such as economic status, education, age, place of residence, geographic region and types of disability) on OOPE. The interaction effects offer us an opportunity to examine the multidimensional nature of inequalities on OOPE of gender and subgroup of disabled person (Eeckhaut, 2020).
Results
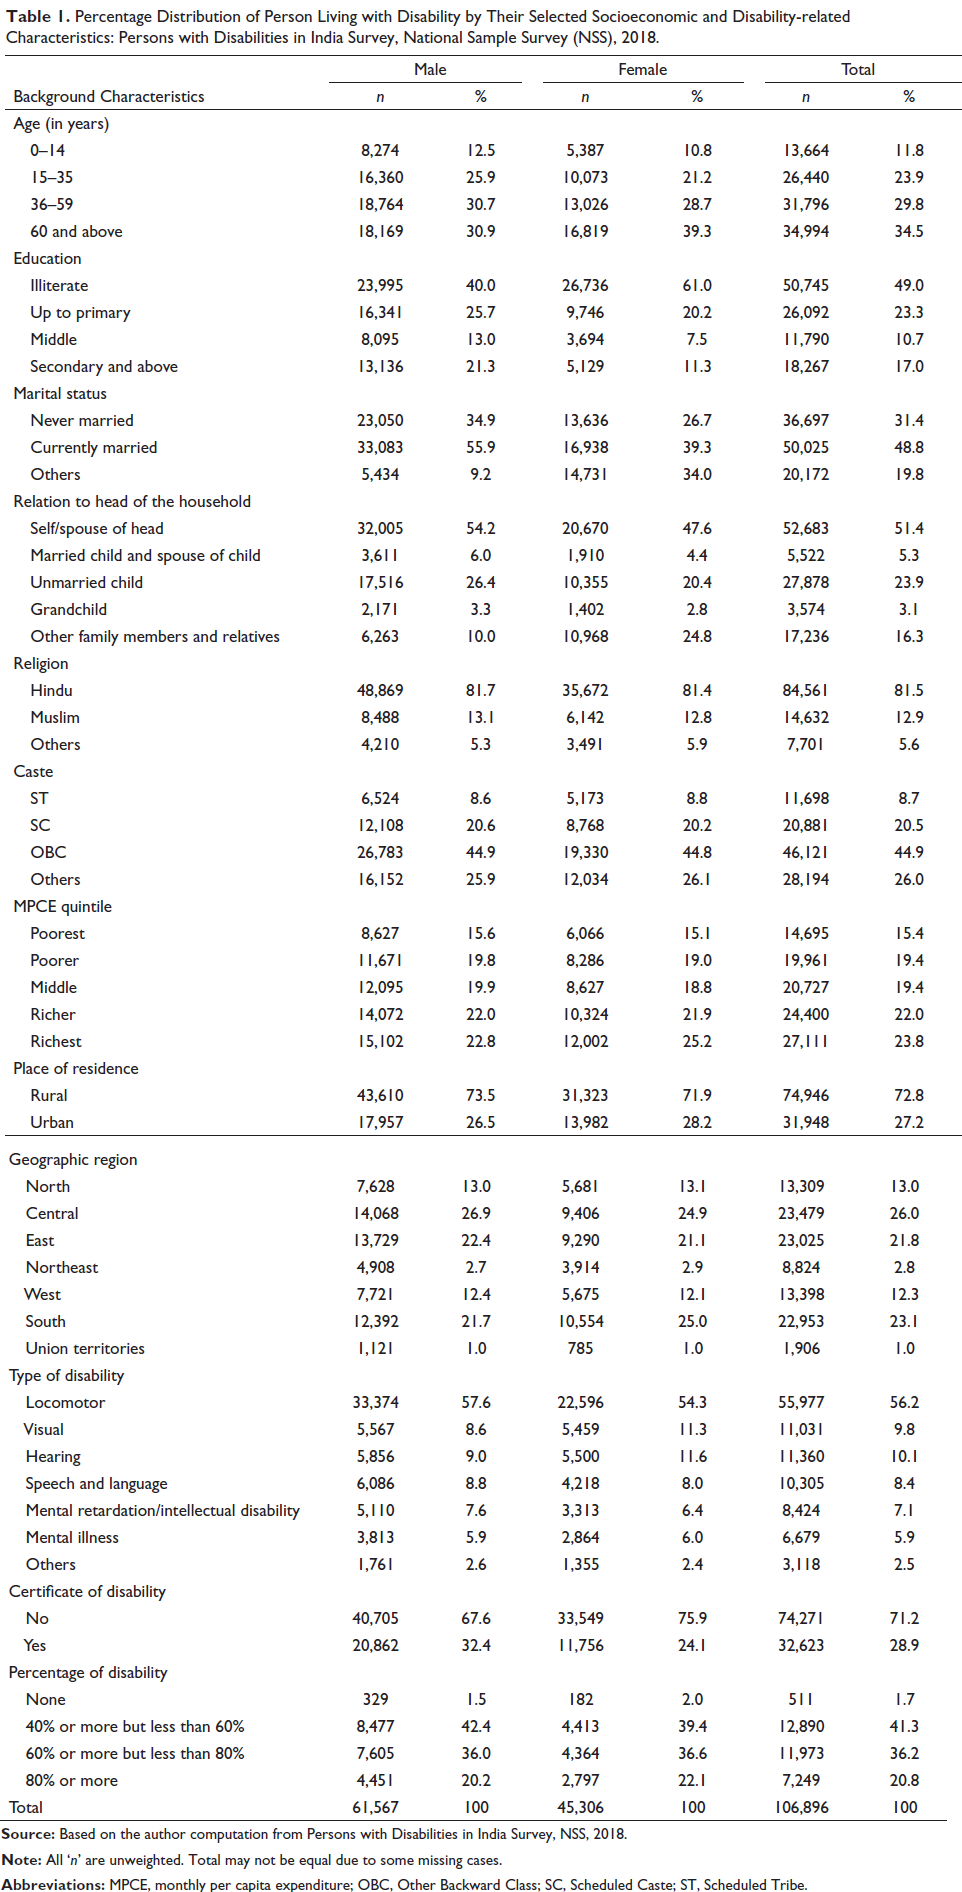
Of the total 106,896 persons identified from the data, 57.31% were males and 42.69% were females (Table 1). Around 61% of females were illiterate as compared to 40% of males. 11% of females and 21% of males were educated up to secondary and above, respectively. Majority of disabled (around 60%) were above 35 years and one-fourth was in the 15–35 years age group. One-fourth of disabled belonged to the richest MPCE quintile, and 15% belonged to the poorest MPCE quintile. Majority of disabled persons resided in rural areas. Around one-fourth of disabled resided in the central region, and more than one-fifth in the east region. Higher rates of disability were seen in females across visual, hearing and mental illness disability types. Percentage of disability was found to be more in females as compared to males.
Percentage Distribution of Person Living with Disability by Their Selected Socioeconomic and Disability-related Characteristics: Persons with Disabilities in India Survey, National Sample Survey (NSS), 2018.
Gender Difference in OOPE and OOPE Burden
Table 2 presents the share of OOPE on total household consumption expenditure by selected socioeconomic and types of disability between males and females. Overall, 20% of the household’s consumption expenditure was spent on healthcare expenditure on disability, with higher proportion of OOPE burden among males (23%) compared to females (17.2%). OOPE burden across various MPCE quintiles showed a similar trend with a higher proportion of male contributing to this burden. The gender gap for OOPE was highest among 15–25 years age groups. This gap was narrower among SC/ST and OBC as compared to other castes and more pronounced in rural areas (7.7%) than urban areas (3.8%).
Gender Differences in Average Monthly Out-of-pocket Expenditure (OOPE) and Healthcare Burden (HCB) of Person Living with Disability by Their Selected Socioeconomic and Demographic Characteristics: Persons with Disabilities in India Survey, National Sample Survey (NSS), 2018.
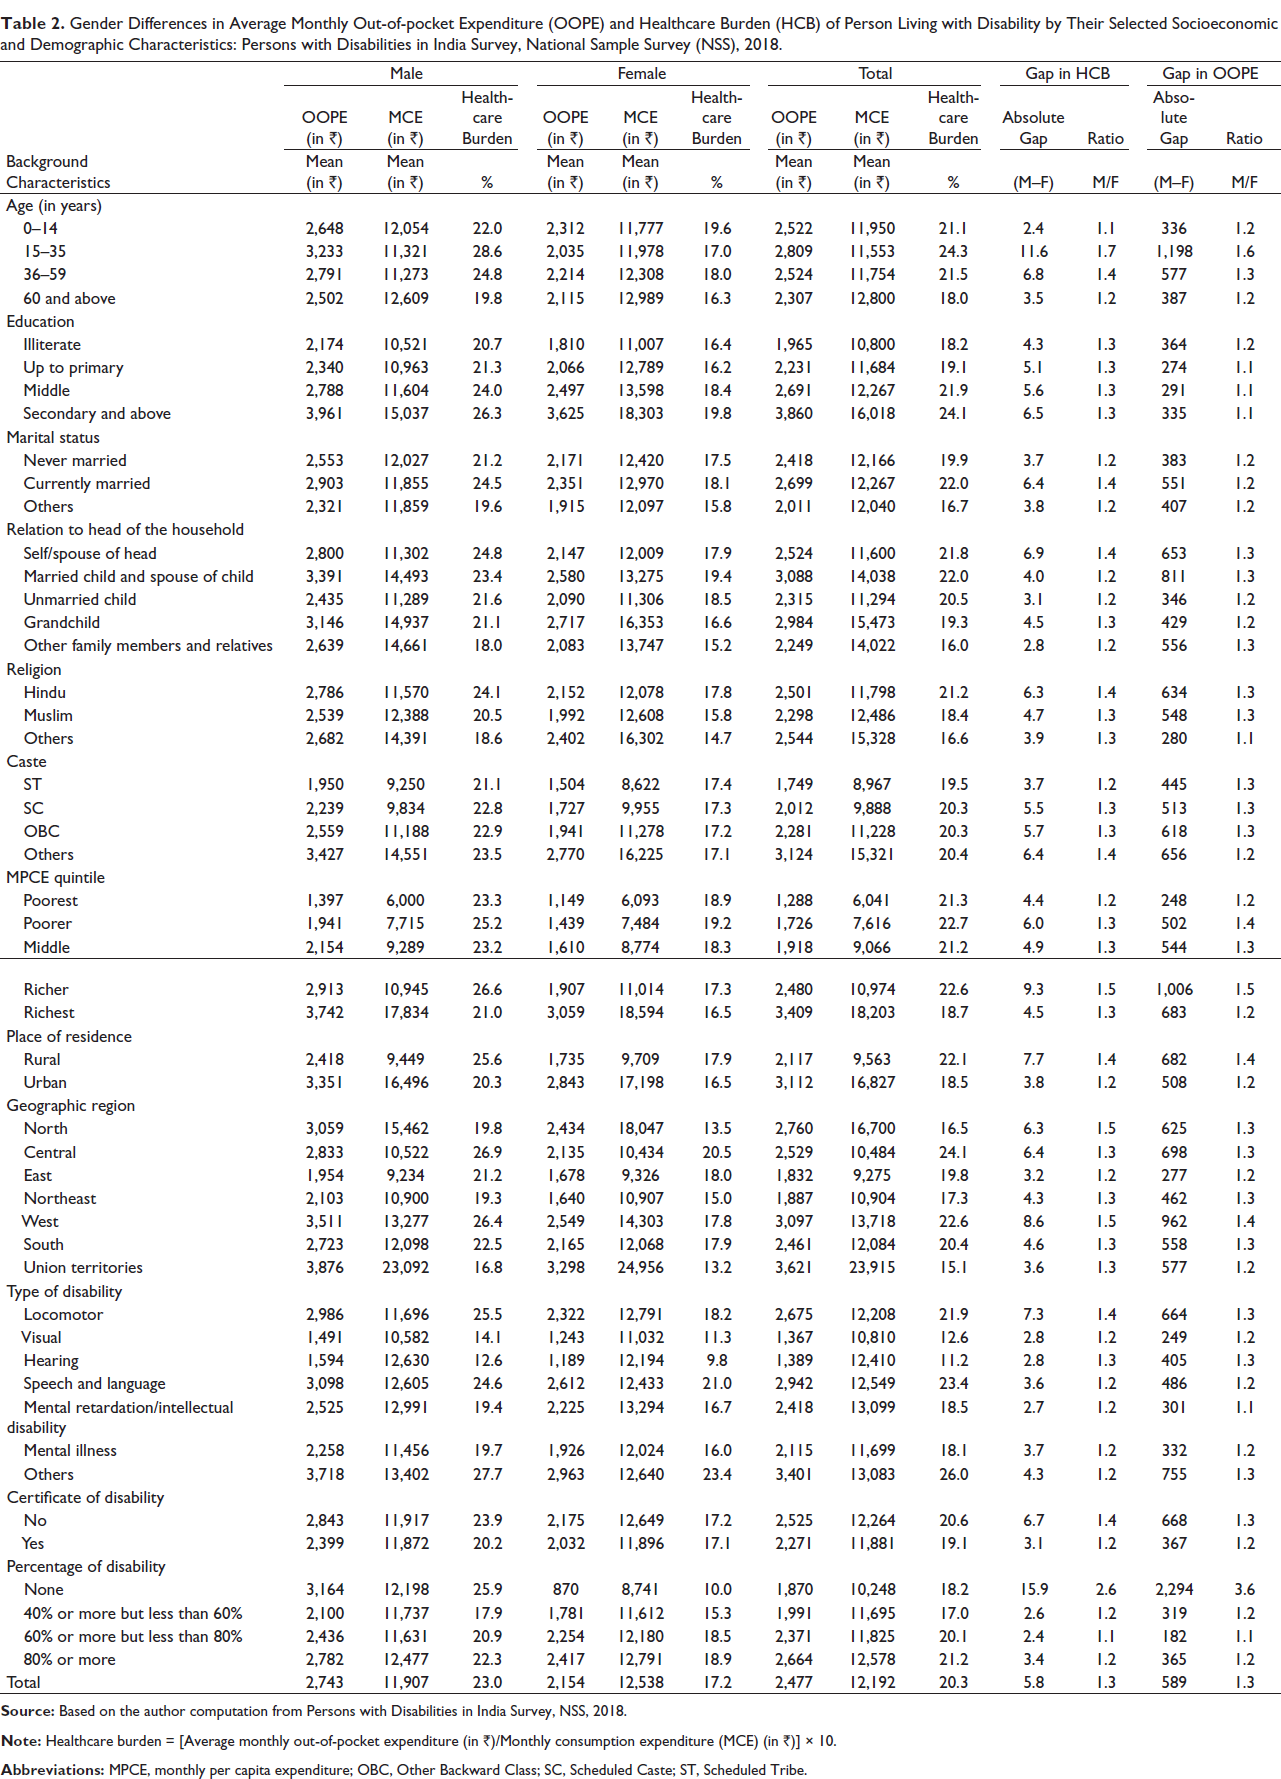
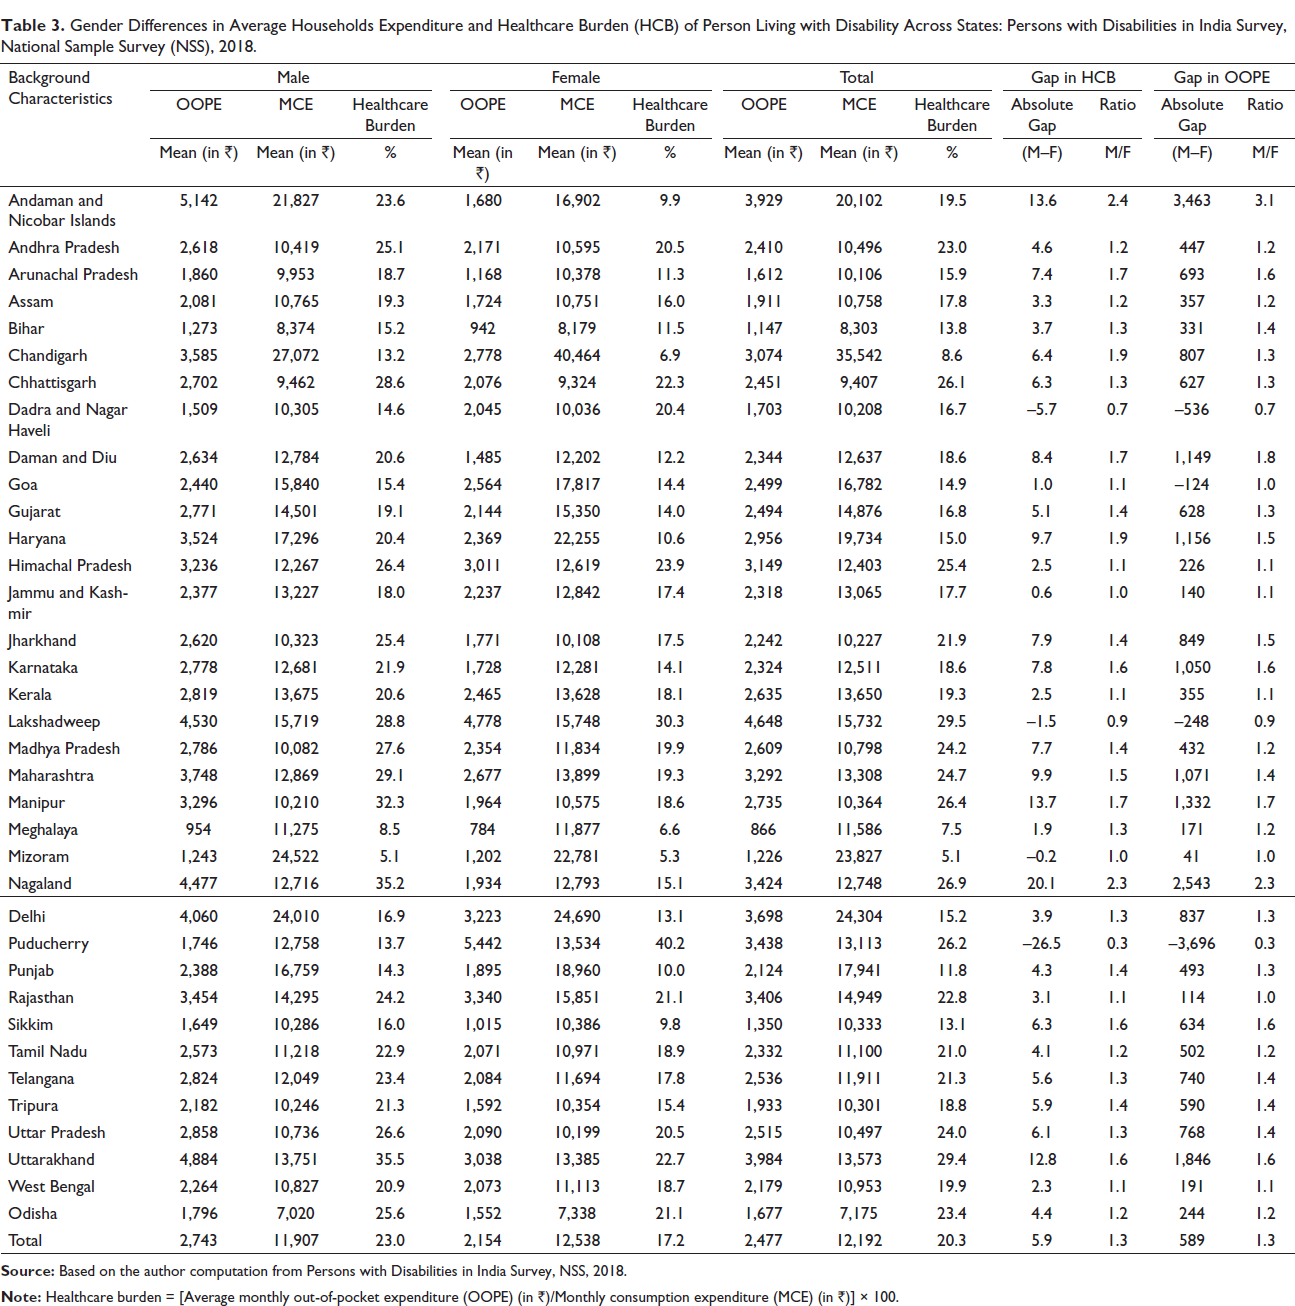
The absolute and relative gaps in OOPE were higher in currently married, in Hindus, in richer MPCE quintile and in disabled persons residing in rural areas. Those with a certificate of disability had lower OOPE. The OOPE burden was highest in other disabilities (male 27.7% and female 23.4%) and locomotor disabilities (male 25.5% and female 18.2%), while it was lower in hearing disability (male 12.6% and female 9.8%) and visual disability (male 14.1% and female 11.3%). Gender gaps in healthcare burden were higher in locomotor disability (7.3%), while it was lower in visual disability (2.8%) and hearing disability (2.8%). OOPE and healthcare expenditure were higher (21.2%) if disability percentage was more than 80%, while it was lower (17.0%) among disabled persons who reported disability percentage between 40% and 60%. Further gender gap also shows among severity of disability. Here, it is noted that the percentage of disability ‘none’ means they do not have the certificate of disability. Region-wise OOPE was found to be less in the east, northeast, west, south and union territories regions as compared to north, but was higher in central region when compared to north (Table 3).
Gender Differences in Average Households Expenditure and Healthcare Burden (HCB) of Person Living with Disability Across States: Persons with Disabilities in India Survey, National Sample Survey (NSS), 2018.
Gender Inequality in OOPE
To explain the effect of variables at different levels on the gender gap, we further explored the contribution of selected socioeconomic and disability-related predictors in explaining the gender gaps in OOPE using Blinder–Oaxaca decomposition method (Table 4). The gender gap in OOPE was decomposed into three parts. The first part is endowment effect, which shows the gap due to variances in the distribution of factors between male and female; the second part is the coefficient effect, which demonstrates the gap due to the variances in the effect of factors between male and female; the third is the interaction effect, which shows the interaction between both endowment effect and coefficient effect. The average of log OOPE was 6.98 for male and 6.84 for female. The gap between the male and female was 0.14 of which 0.04 was due to endowment, 0.11 was due to coefficient and –0.01 was due to interaction. The results show that about 28.80% of the male–female gap in OOPE was explained by the differential distribution of socioeconomic and disability-related predictors.
Result of the Blinder–Oaxaca Decomposition Analysis Showing the Male–Female Differences in Out-of-pocket Expenditure (OOPE) for People with Disabilities (PWDs) by Their Selected Socioeconomic and Demographic Characteristics: Persons with Disabilities in India Survey, National Sample Survey (NSS), 2018.
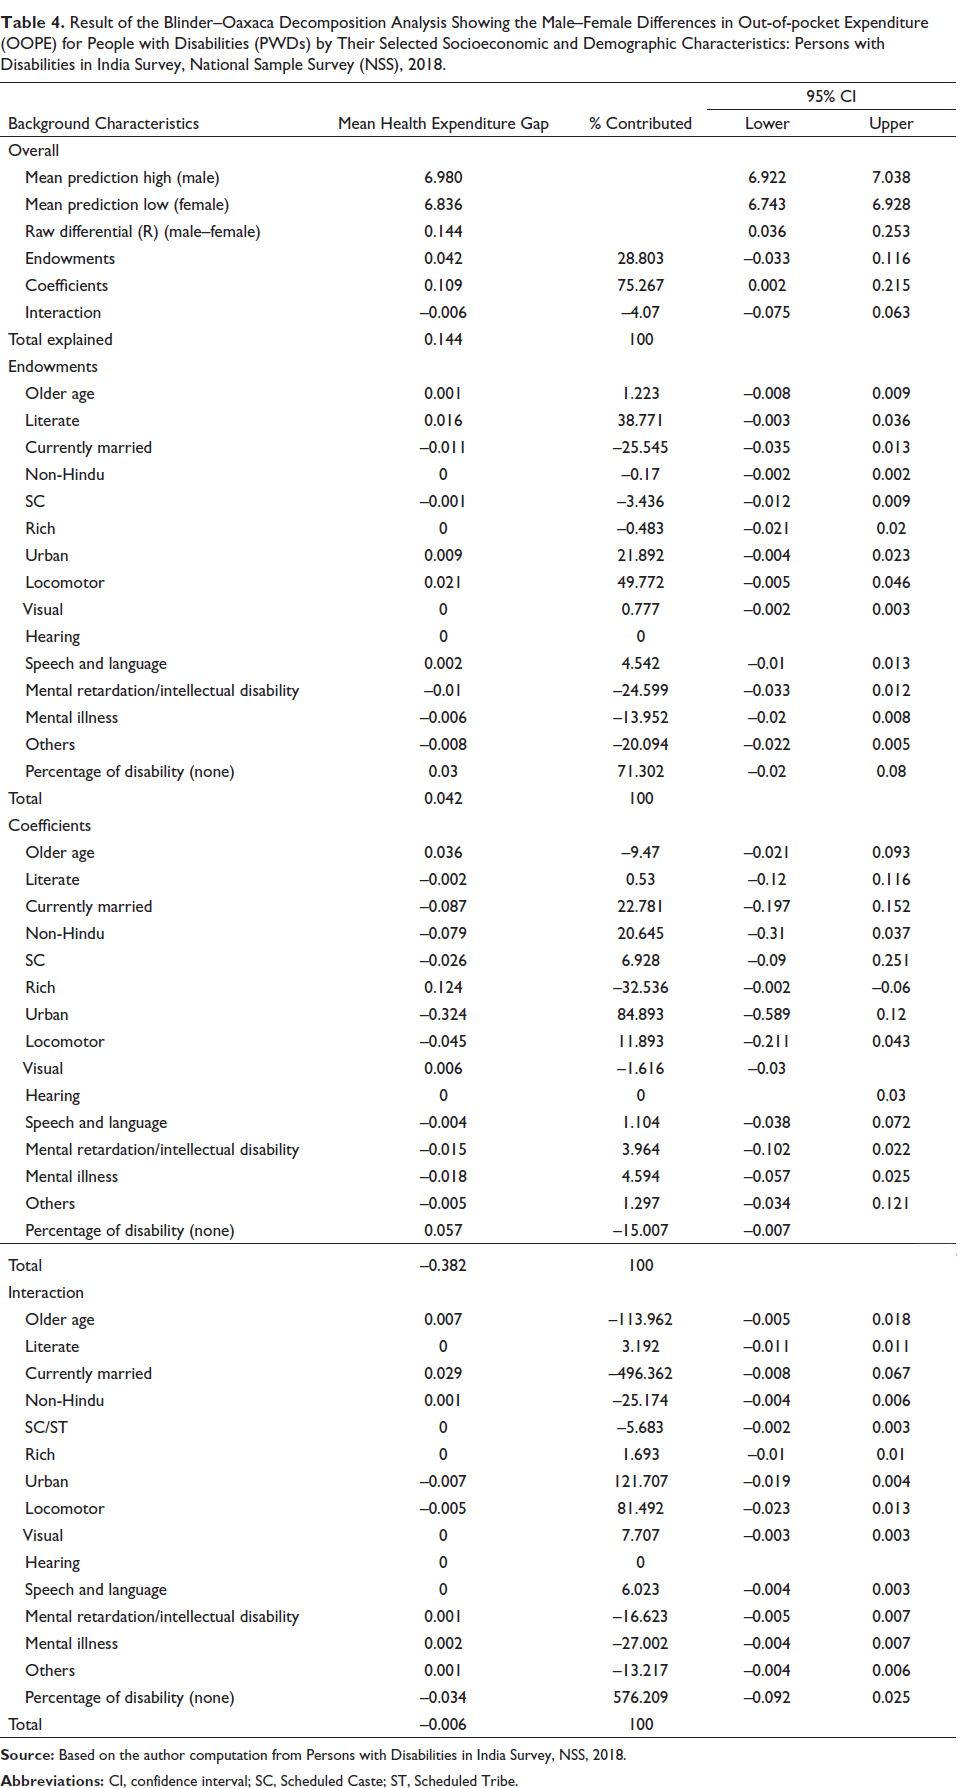
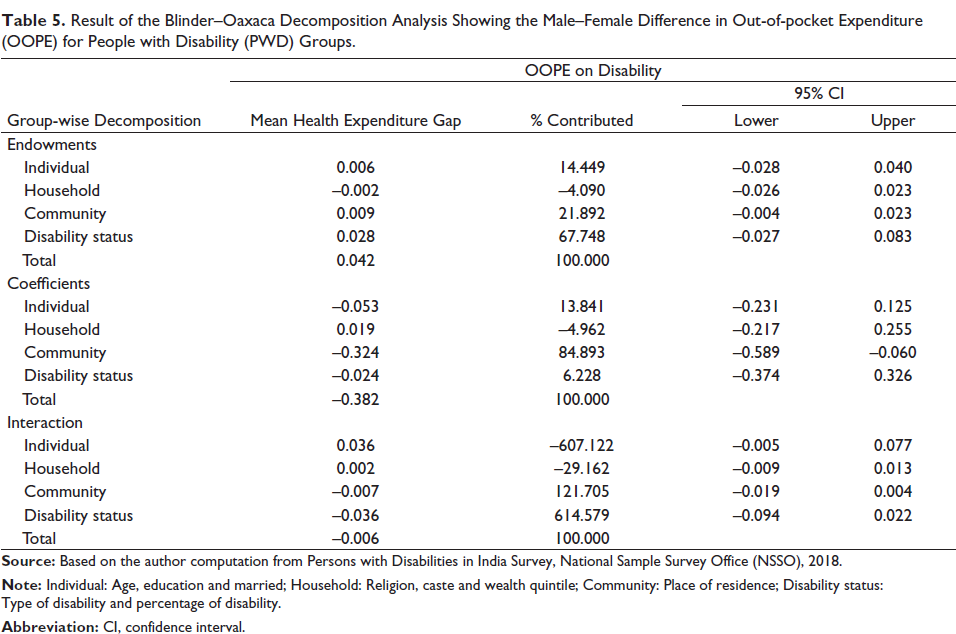
Table 5 presents the result of the Blinder–Oaxaca decomposition analysis of OOPE among males and females by PWD groups (individual, household, community and disability).
Result of the Blinder–Oaxaca Decomposition Analysis Showing the Male–Female Difference in Out-of-pocket Expenditure (OOPE) for People with Disability (PWD) Groups.
Factors Associated with OOPE
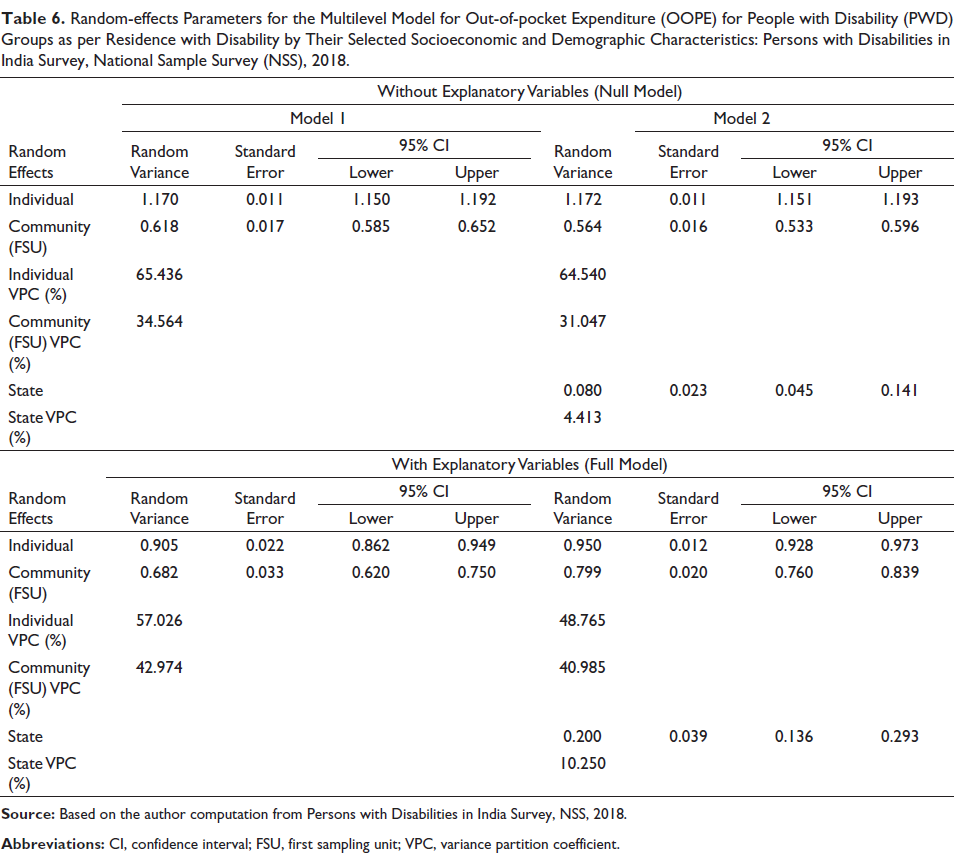
Table 6 presents the multilevel model to know the variation in average OOPE between place of residence, between households and between individual of the household in the place of residence. The variation in OOPE is higher at individual level (Ωe2 = 1.170) than that of household level (Ωu2 = 0.618) at the two level model (level 1—individual, level 2—first sampling unit (FSU)/village) than three level model (level 1—individual, level 2—FSU/village, level 3—state). Variance partition coefficient (VPC) shows 35% of the variation in disability cost is due to the household level clustering of the individual without controlling the socioeconomic and disability-related predictors (model 1 two level empty model). In the full model controlled with socioeconomic and disability-related characteristics, the variances endorsed to the differences in the village 34.56–42.97 and state increased by 4.41–10.25. The variation in OOPE is higher at individual level (Ωe2 = 1.170) than that of household level (Ωu2 = 0.584) and place of residence level (Ωu2 = 0.035) at three level analysis. The variation in the OOPE is higher at individual level (Ωe2 = 1.172) than that of household level (Ωu2 = 0.564) and place of residence level (Ωu2 = 0.080) at three level analysis.
Random-effects Parameters for the Multilevel Model for Out-of-pocket Expenditure (OOPE) for People with Disability (PWD) Groups as per Residence with Disability by Their Selected Socioeconomic and Demographic Characteristics: Persons with Disabilities in India Survey, National Sample Survey (NSS), 2018.
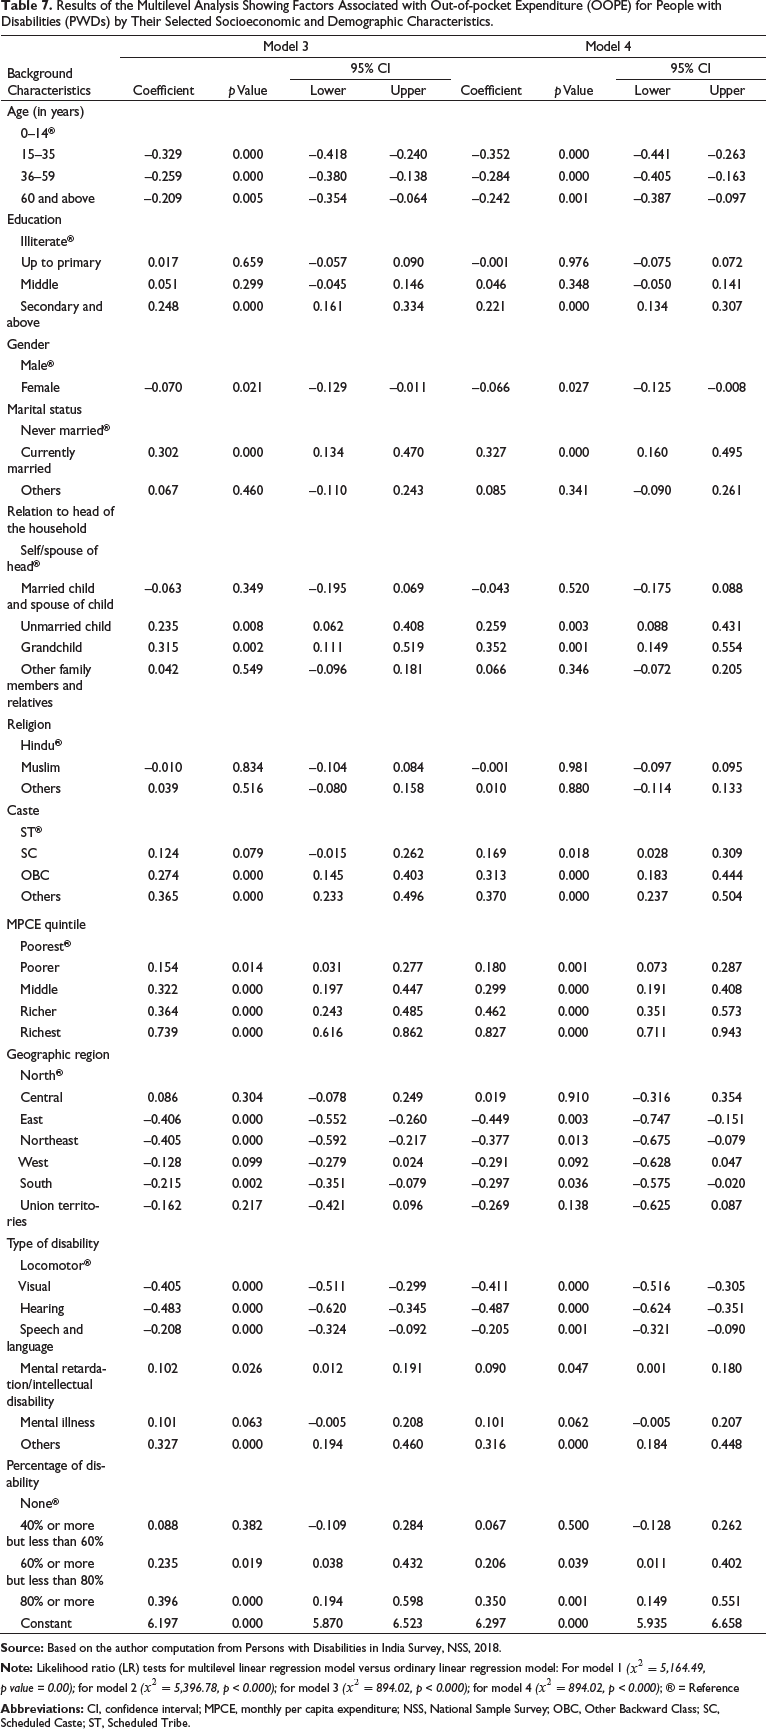
The results of multilevel analysis showing the factors associated with OOPE are provided in Table 7. After adjusting the socioeconomic and disability-related predictors, we found that the average OOPE is significantly lesser among females (β = –0.070, 95% confidence interval (CI)= –0.129 to 0.01) compared to males at two levels (individual level and household level), and similar pattern shows at three levels also (individual level, household level and state level). These clearly indicate the discrimination in the genders for OOPE due to disability-related healthcare expenditure. The associations between OOPE and selected socioeconomic and disability-related predictors were also in quite an expected direction. The probability of OOPE was less with increasing age. Economic status of household had a significantly positive association with OOPE. PWDs from richer households had higher OOPE for disability care.
Results of the Multilevel Analysis Showing Factors Associated with Out-of-pocket Expenditure (OOPE) for People with Disabilities (PWDs) by Their Selected Socioeconomic and Demographic Characteristics.
Finally, we present the analysis of the adjusted multivariable models with interaction by OOPE according to gender and socioeconomic and disability-related predictor (Figure 1). Figure 1 shows results for age, education, place of residence, region of residence, MPCE quintile and types of disability (models were adjusted with marital status, relation to head of the household, religion, caste, having certificate of disability and percentage of disability). Moreover, after using the interaction, the gender gap remains constant across the socioeconomic and disability status, and shows that OOPE among males was higher than female irrespective of predictor variables.

Discussion
This study examines the gender gaps in OOPE among PWDs in India. This study describes the gender inequality in OOPE and OOPE burden among PWDs. For our analysis, we have used the recent national representative cross-sectional National Sample Survey Office (NSSO) survey data on the theme ‘Persons with Disabilities in India Survey’. We defined monthly OOPE due to disability as the total medical expenditure and non-medical expenditure monthly on disability healthcare. And also examined the OOPE burden as a percentage of total household consumption expenditure similar to previous studies (Mitra et al., 2009; Sahoo & Madheswaran, 2014). Our study focused on the gender gap in OOPE through the use of various methods such as relative and absolute gap of OOPE between male and female populations, Oaxaca decomposition method and multilevel models.
There are several notable findings. First, almost 20% of the total household income was spent on healthcare expenditure for PWD treatment care with a higher share of OOPE among males (23.0%) as compared to females (17.2%). The male–female differences in mean OOPE also vary largely across states (Table 7). The highest gaps in male–female differences in mean OOPE were observed in Andaman and Nicobar Islands (₹3,463), followed by Nagaland (₹2,543), Uttarakhand (₹1,846), Manipur (₹1,332), Haryana (₹1,156), Daman and Diu (₹1,149) and Maharashtra (₹1,071) while some of the states like Puducherry (₹–3,696), followed by Dadra and Nagar Haveli (₹–536), Lakshadweep (₹–248) and Goa (₹–124). Younger adults, the poorest quintile household and rural areas showed a wider gender gap with 23–25% of males spending more on healthcare as compared to 17–19% of females.
Second, the mean OOPE was found to be higher in males compared to females. Male–female differentials among younger age group (15–35 years) were higher compared to other age groups. The gender gap was higher among rural residents as compared to urban residents. Rural households had spending of 25% of total household expenditure on healthcare expenditure if the disabled person was male while only 17% of total household expenditure was spent on healthcare if disabled person was female. These findings are consistent with the wisdom that the reporting of poor health by women has been found to be significantly higher than men, hence the lower mean OOPE reported in our study (Bora & Saikia, 2015).
The actual cost on disability was higher in the richest households but the OOPE burden was the highest in poor households. The lower expenditure on disability-related healthcare by the poor households could be linked to the households’ ability to pay due to low income (Seth & Mohanty, 2017). Further, among the poorest, the share of household consumption on disability-related OOPE on health was higher in males (23.3%) than females (18.9%). This could be due to the fact that in poorer households, women have lesser power than men due to absence of property ownership, lack of income continuing social norms and feelings (Ajala, 2017; Saikia et al., 2016).
Thirdly, the gender gap in OOPE using decomposed analysis clearly indicates that after adjusting the socioeconomic and disability-related predictors, the average OOPE is significantly lesser among females (β = –0.070, 95% CI= –0.129 to 0.01) compared to males at two levels (individual level and household level) and at three levels also (individual level, household level and state level). Findings clearly indicate the gender gap in both OOPE and OOPE burden.
Our findings were consistent with the findings of previous studies (Palmer et al., 2011) and suggest that OOPE and OOPE burden on healthcare in household have gender inequalities among PWDs in India, and will require long-term social, cultural and policy changes. The findings of this study suggest the need for a coherent and gender-sensitive health agenda for disabled populations in India. Focusing on the prevention and early treatment, efforts to mitigate disability conditions are essential steps along with increased access to health insurance and social security for promoting gender-sensitive health and well-being of PWDs in India. We also suggest future in-depth studies focused on complex gender dynamics in health and disability at states and district levels in India. Since the NSS does not report expenditure of non-PWD, future rounds of NSS could focus on this aspect.
Limitations of the Study
The present study has a few limitations. First, we could not provide insights on gender differentials on disability-related healthcare OOPE and OOPE burden at the district level. Though the data is from a nationally representative survey, recall bias along with self-reporting of healthcare expenditure for detailing healthcare expenditure data by the respondents could be a major limitation. The cross-sectional nature of the survey limits its use for causal inference and long-term healthcare burden. Lastly, the NSS did not report health facility utilization such as private and public among sampled populations, so we were unable to present this analysis. This is an important limitation in our study as it is known that populations incur higher expenditure in private health facilities compared to public (Kumar et al., 2015; Sahoo & Madheswaran, 2014; Yadav et al., 2020, 2021).
Conclusion
Ensuring healthy life and promoting wellbeing for all at all ages (goal 3) and achieving gender equality and empowering all women and girls (goal 5) are two of the sustainable development goals (SDGs) in the UN’s agenda. To reach these goals, it is key to recognize the disadvantaged and omitted using a gender lens, especially among PWDs. This study identifies the general differentials in OOPE and OOPE burden on healthcare among PWDs in India and highlights the need for gender-sensitive programs and policies targeted at PWDs by the Government of India.
Author Contributions
JY, GRM and DJ conceived the idea for the study and developed the analysis plan. JY contributed to the data analysis. GRM, JY, RS and DJ wrote the initial draft and all authors were involved in commenting on subsequent revisions.
Footnotes
Declaration of Conflicting Interests
The authors declared no potential conflicts of interest with respect to the research, authorship and/or publication of this article.
Ethical Approval
Not required.
Ethics Statement
The present study used the data from secondary sources which is freely available to individuals. Therefore, no ethical approval is required separately for the present study.
Funding
The authors received no financial support for the research, authorship and/or publication of this article.