
Abstract
High utility mining is gaining prominence, and with the increasing set of business intelligence models, the scope of such significant practices is high. Rather than focusing only on profitability as one key utility metric, today’s organizations believe in having more robust levels of the multi-objective filtering process. In this manuscript, a contemporary model of the high utility mining process is proposed, wherein the multiple averages are used for grading the recommendation of the itemsets for merchandise. The model’s key advantage is its dynamic approach. The goods-related period of the average time interval can be flexible, alongside the fusion of multiple utility thresholds of diversified features chosen for itemsets recommendation. The performance analysis has been carried out by using a multi-fold cross-validation strategy. The results obtained for cross-validation show that the proposed model is outperforming the contemporary models with significant precision, specificity, sensitivity, and accuracy having values 97%, 95%, 98%, and 97% in respective order. Whereas, the contemporary models HUPM-MUO and MOEA-FHUI have obtained 93% and 90%, 88% and 82%, 89%, and 84%, and 89% and 83% in respective order of the corresponding metrics. The experimental study of the model denotes the effectiveness and ease with which the solution can generate results and produce significant output in the real-time environment for more dynamic and periodic decisions by different organizations.
Keywords
Introduction
Big data analytics and other business intelligence solutions have altered the dynamics of how organizations focus on high utility mining to achieve operational excellence and performance quality. In today’s competitive environment, it is critical for enterprises to achieve optimal resource use, maximum return on investment, and capital employed.
The application of high utility mining solutions can be effective in the fast-moving consumer goods (FMCG) environment and other areas where the profitability margins for businesses are heavily dependent on the volume of transactions, utility gain margins, operating costs, and so on. There have been numerous studies that show that certain effective HUM (high utility mining) approaches produce considerable results [1–6].
HUM refers to the process of determining the most profitable itemsets based on the number of transactions and utility gain parameters. However, the majority of the current HUM solutions are either on the cases of volumes or utility gain margins in a definite record. While the HUM process can be an efficient solution for enterprises, one of the typical obstacles is identifying the patterns in which the uncertain data streams are dynamic means of arranging the inventory [7].
This manuscript focuses on improving more mainstream HUM analysis models that can be useful for organizations in assessing the profitability of items and the conditions that can help optimize returns.
Problem statement
When a supermarket or convenience store applies analytics, it may be necessary to alter inventory management practices such as EOQ (Economic Order Quantity), JIT (Just in Time), or other modern inventory management practices. Assume that in a traditional scenario, if X units of a product are sold, there is a likelihood that demand will increase. Profitability may deteriorate if there is insufficient stock.
However, in some cases, such as when stores have an excessive number of stock units of a particular item, issues such as the product’s shelf life, the volume of cash flow impacted by the stores, the cost of managing inventory over the merchandise counter, and a variety of other factors can have a significant impact on the process. As a result, merchants must consider a variety of parameters when analyzing unit profitability over time [8].
The usual example of a dairy product such as milk being managed over a storage counter for transactions is that the commodity’s profitability may be X if sold within a few hours after being placed on the counter. If the same product remains on the cold storage counter for an entire day, the scope of managing the product on the counter includes both cooling unit costs and the issue of occupying storage space, which may preclude the addition of other items. In essence, such a condition reduces the product’s profitability by causing it to generate less or no profit.
Customers visiting stores for such products, on the other hand, may opt for more profitable items, even if certain products are unprofitable or have a low-profit margin. Thus, comprehending profitability dynamics and determining the appropriate amount to acquire for a particular item set demands a multi-dimensional analysis perspective [9].
While there are no limitations on how simple or effective the analysis can be, there is a need to have a robust framework for evaluating HUM. As a result, this book provides a novel approach to evaluate techniques for high utility mining.
Related work
In this section, trending research works related to the mining of High Utility Itemset (HUI) for the earlier 10 years are examined. The work [10], is the first one to propose this matter in 2005 and manage with current algorithms restrictions by not deliberating the purchased item characteristics by the consumer.
In [11], the study’s authors have focused on the conditions of observing level-wise itemset mining algorithm. Considering the scope of both positive and negative utilities, the anti-monotone pruning model is proposed, wherein more insightful data mining is proposed. The study advocates better quality of utility mining, focusing on the aspects of anti-monotonic conditions.
In [12] and [13], a detailed review of the concept of itemset utility mining, and how a distinct set of algorithms were proposed earlier were presented as a comprehensive review of the literature. Based on the key classifications discussed in these review papers, and the algorithm structures presented, it is evident that there are a distinct set of solutions that are seen as critical to the itemset-based mining process. The key advantage of these review studies is an overall outlook presented covering numerous sets of solutions, various sets of classifiers, and features used for the analysis. Overall these review papers have provided considerable insights into how the current models address utility mining and new avenues that need to be explored for improvisation in the process.
To discover recent high average utility itemset form data streams, the authors in [14], proposed the first algorithm based on the sliding window technique to focus on the recent HAUIs. This algorithm reduces the overestimated utility to effectively prune the search space.
The dynamic process of streaming data and how the solutions can process the utility conditions for handling the requirements is a critical subject of study. In [11], the study has targeted the conditions of itemsets constituting high utilities and existential probability issues, the conditions discussed in the scenario are about transaction weighted probability and utility tree conditions, wherein the quantum of itemsets is considered for the utility mining process is mitigated. An experimental study of the proposed model is referred to have a good performance of the uncertain data stream-based utility mining process.
The authors in [15], transformed the problem of mining frequent and high utility itemsets into a multi-objective problem by considering both, the utility and frequency to extract interesting patterns. The key advantage of this model is that it can process the transactions in a single database scan and it doesn’t require the prior setting of minimum utility threshold and minimum support threshold as well.
All the above-discussed methods, assume the utility to be a positive value only, but in real-time scenarios, some items may have negative utility value for example when selling an item A at a loss price to increase the sales of other related items, this means that item A has a negative utility value. Many researchers tried to solve this problem by considering the negative utility of the items. The authors in [16], have done an extensive survey on algorithms that consider the negative utility of the items. MHAUIPNUalgorithm which considers the negative utility of the items was proposed in [17], the authors of this work proposed three pruning strategies to reduce the search space and experimentally prove their effectiveness.
To consider both, the utility of the items and the length of the patterns, the authors of [18], proposed a novel algorithm called EHNL algorithm. It’s based on database projection and transaction merging techniques, to reduce the cost of database scan.
To improve the user’s satisfaction from HUI mining recommendations, the authors in [19], presented a new model to discover diversified top-k high utility patterns instead of recommending patterns with high similarity. This contribution described a novel mining model for forecasting the top-k frequent and HUIs. The contribution is novel in that it projects item-sets under multiple utility objectives. The proposed model illustrates the itemsets that are significant in terms of multiple utility objectives such as profit, storage, scalability, durability, and maintainability, among others. Additionally, the proposed model takes into account the frequency as another factor. The proposed model as a whole operates in a two-phase hierarchical fashion. Phase one’s process tends to uncover itemsets based on their frequency. The subsequent stage of the process prunes these itemsets in accordance with the various utility objectives. The application of minimal utility. Support is a context-dependent requirement (often can be 0).
In summary of the above discussed and another set of multi-objective high utility mining processes reviewed for this manuscript, it is evident that there are distinct solutions imperative and are result-oriented. Predominantly, the solutions which are critical in processing the real-time data and accordingly developing comprehensive analysis, within short span factors, play a vital role. In line with the complexities with the existing process, some challenges observed as gaps from the literature are about conditions of fitment issues of certain models for dynamic and multi-element consideration. In improving utility mining, targeting the conditions of operating efforts for specific itemsets and combining the relative strength for utility mining objectives is a major gap to consider for development.
In this paper, we proposed the novel task of high-utility itemset mining with fusion of multiple utility thresholds to address the research gap stated in afore section. The key objective of the suggested model is to achieve flexible average time interval towards goods-related data, along-side the fusion of multiple utility thresholds of diversified features chosen for itemsets recommendation. This enables to select itemsets by the context of multiple utility factors that discovers more interesting and useful patterns, which may be used to aid managers or retailers in taking better business decisions.
Proposed method (FDUF-HUM)
The rationale of the model
In line with the key issues discussed in the problem analysis or gap analysis in the introduction section, there is a need to understand the conditions related to the ROCE (Return on Capital Employed) that oftenreferred as ROC (Return on Capital). ROCE works especially well when comparing the performance of firms in capital-intensive sectors, such as utilities, because unlike other fundamentals, ROCE considers debt and other liabilities as well. This provides a better indication of financial performance for firms with significant debt. Wherein it is important to understand the utility or yield outcome wherein there is need for making maximum profits from the prevailing or on setting opportunities.
As reviewed in the related work, there are numerous sets of HUM models which are highly complex and require significant volumes of data to improve the accuracy. However, the crux is spiraling costs for the organizations to ensure adequate data structure both in quality and quantity.
There are multiple factors to consider when picking the itemsets based on the profitability, volume, opportunity/demand, operational costs for merchandise, and other factors. Thus, in this manuscript, combinational statistical approaches like the norm-utility weighted average and exponential moving average can help mitigate the risks of unsold items being present for long in the merchandise.
Thus, taking such factors into account, if the proposed model is adapted, it can work as a multiple range filter process, which can help in improving how the itemsets are screened. The other key advantage of the model is that there is weightage for the current movement of the goods alongside the historical data. By adopting the model in silos or using it for managing the machine learning process, the impact and outcome from the process can be more significant [20].
Model narrative
The proposed model is visualised in Fig. 1 below.
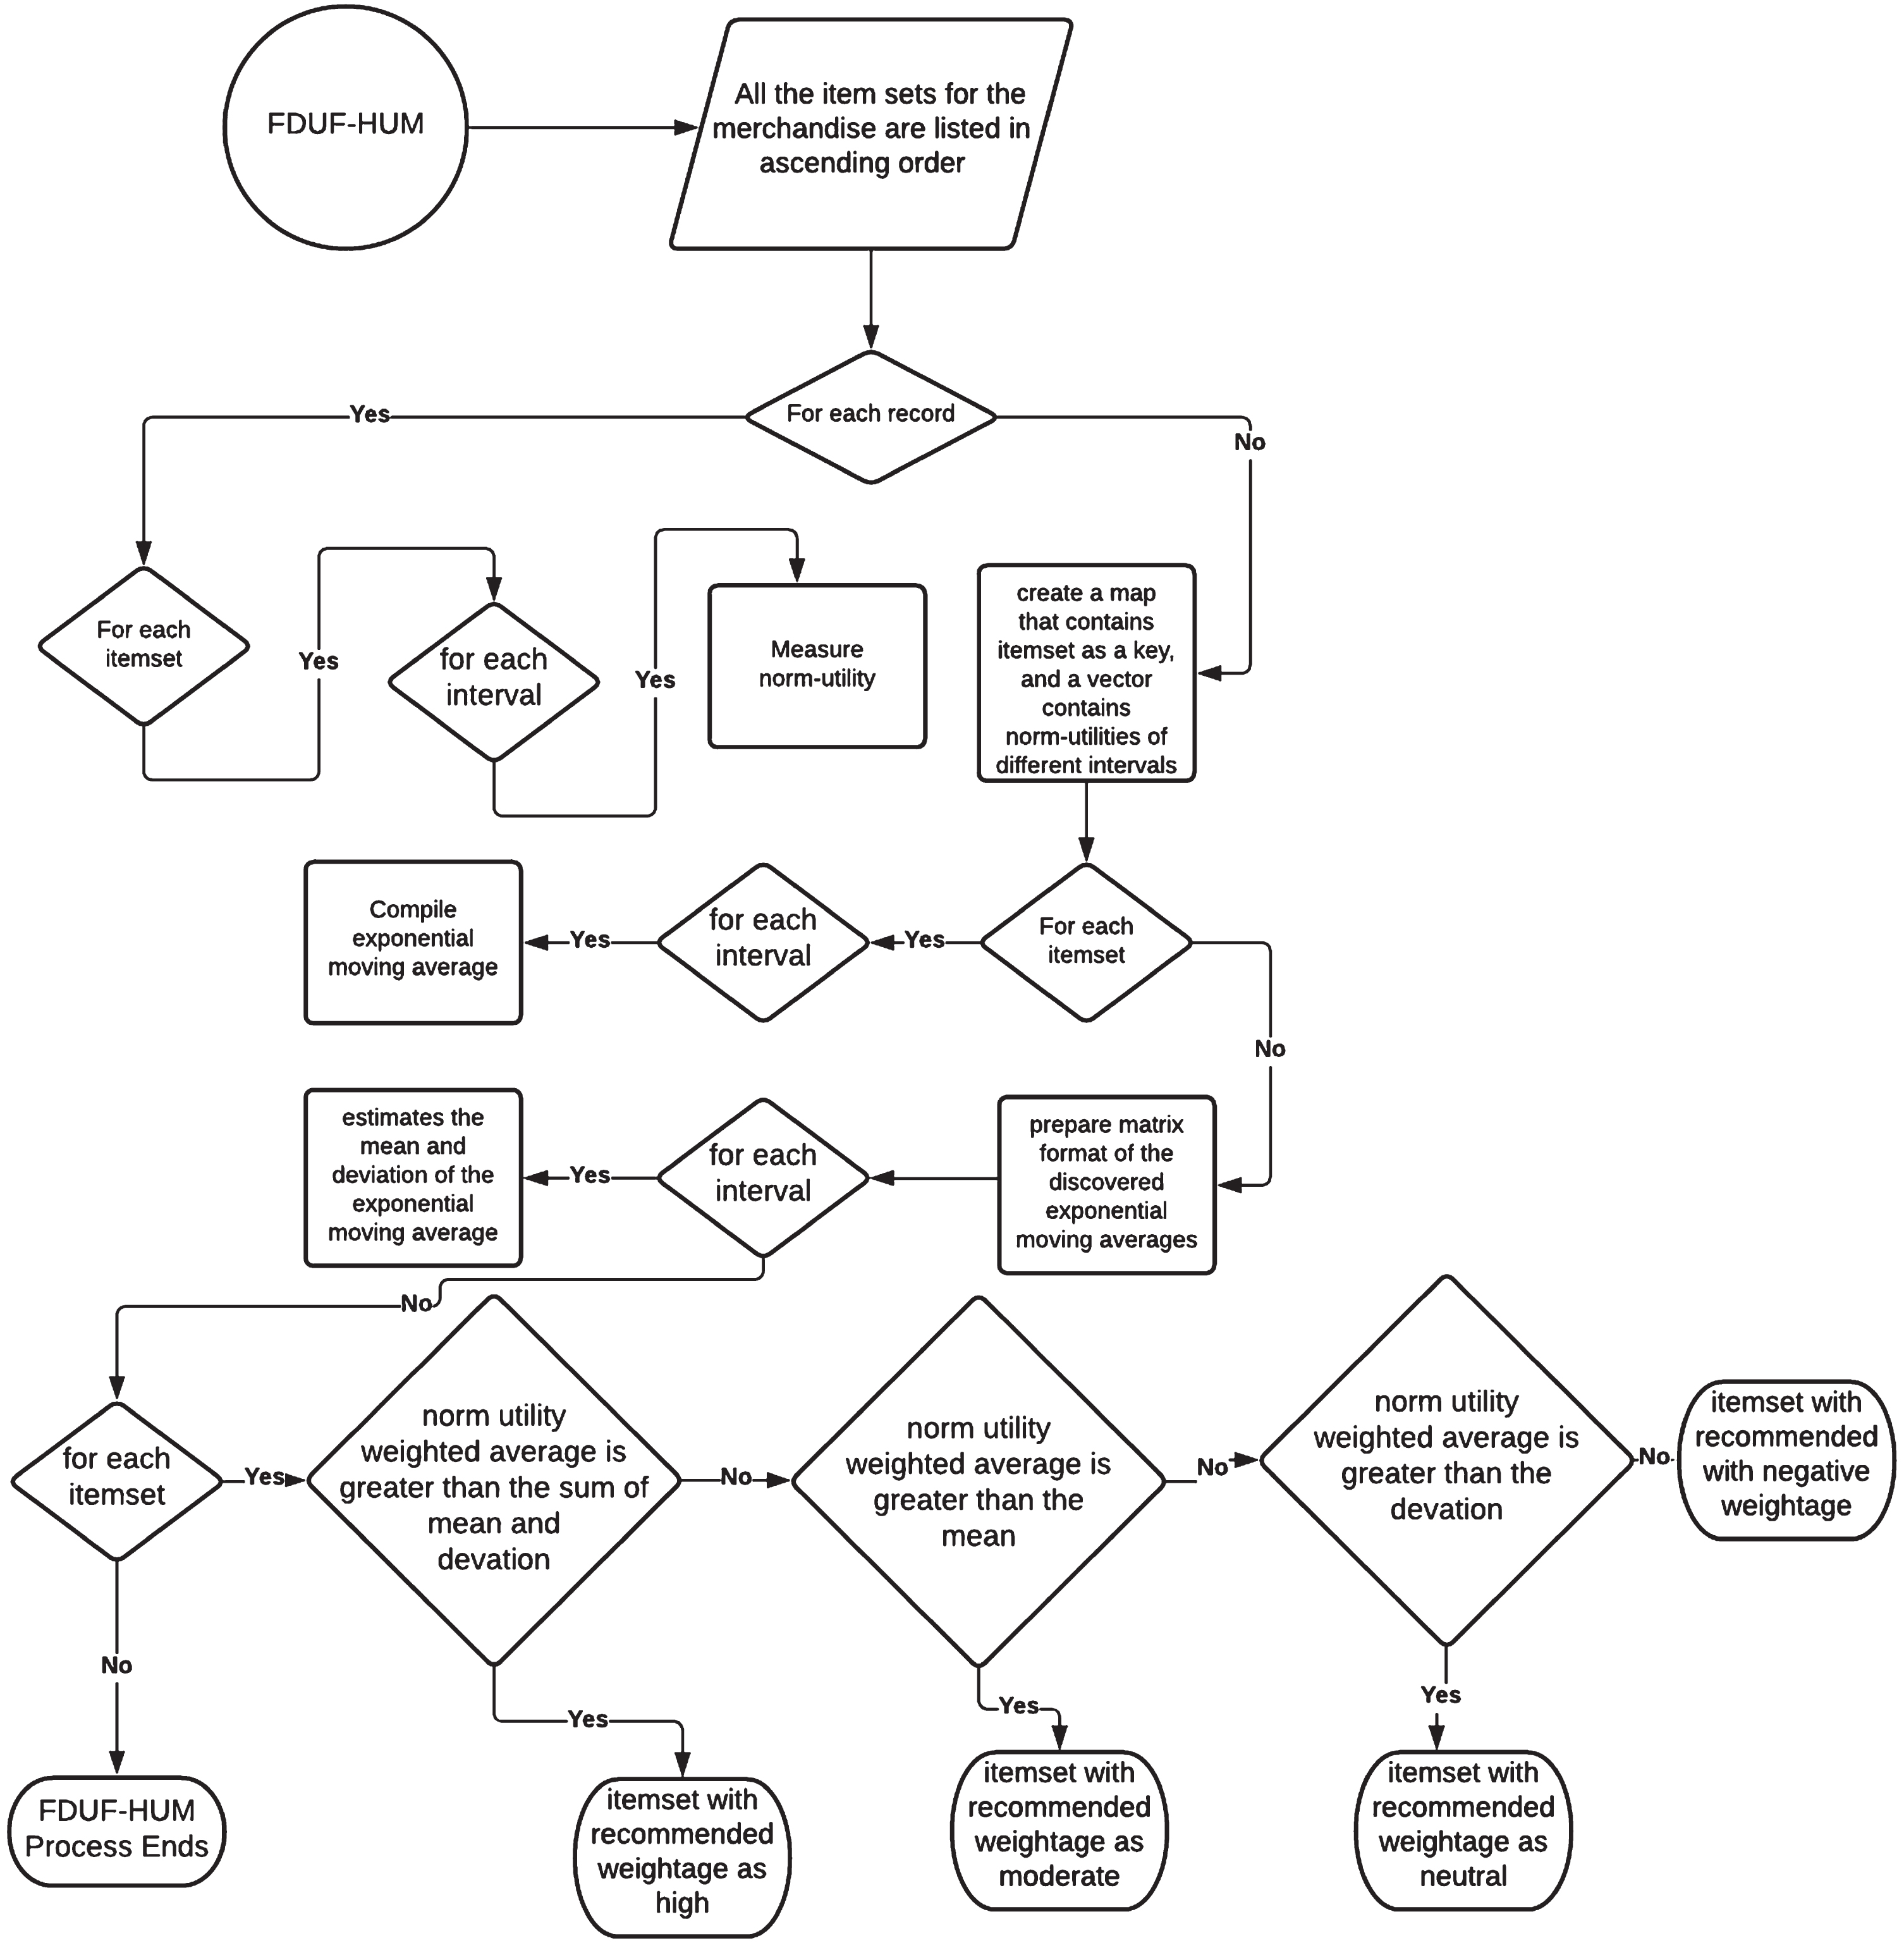
Flow diagram of the model FDUF-HUM.
The narrative for the proposed model is as follows. All the itemsets for the merchandise are listed in ascending order. Followed by, for every itemset, the further classification in terms of its weight or packaging classification shall be sorted. For each such item in the list, the utility gain margin from the respective item set category is tabled. The weighted average volume for each product is carried out based on the transactions data and using the norm-utility weighted-average model. The exponential moving average value for the product is estimated for n number of time intervals. If the latest transactions volume-weighted value is higher than the average of n time intervals, continue the itemset for merchandise. If the latest transactions a volume-weighted value is below the range of n time intervals average, in such conditions, the different level assessment for the mean score values are considered. The mean score value for each of the itemset is estimated based on the features chosen and how each of the features is ranked by the internal team considered for each itemset. When multiple people are involved in the process of decision making, each of the member ratings for every single itemset is ranked and averaged as the final rank before conducting the step-8The complete average of all the cumulative itemset average is estimated using the simple average formulae. The complete average of all the cumulative itemset average is estimated using the simple average formulae. If the respective itemset value is higher than the cumulative average set value, the product shall be advocated for continued merchandise. Else, it shall not be recommended to the merchandise store. The process shall be ongoing and periodical to ensure that there is a rational approach.
The key advantage of the proposed model is about understanding the demand and supply factors on a day-to-day basis. Accordingly, even based on short-span demand and supply factors, the solutions are assessed.
The following are the key materials and methods integral to conducting the execution of the proposed model.
Items
The products that are integral to the inventory managed in the stores and irrespective of its size and quantity of packaging, each segment of it can be seen as exclusive. For instance, if a diary product is available in different quantities packaging (4 four different packages), each can be seen as an exclusive itemset for analysis. However, in the furtherance of the model, the group score feature could be considered.
Norm Utility
The Norm Utility is a prime utility objective of the multiple utility objectives listed as but not limited to storage, expiration, safety to store, transporting scope, and many more contextual factors of the target domain. For the proposed model, for every itemset, the Norm Utility shall be calculated to understand the real utility-gain value.
Utility-gain
The utility gain in high-utility itemset-mining often refers to utility gain, of course, which is not mandated. The context of the model is accounted for the post deductions of all the direct and indirect utility from the unit. For instance, if merchandise has sixty products, for utility-gain estimation, in addition to units of utility-factors, even the utility dissection of operations like utility dissection by hiring cold storage, shelf occupancy values shall be considered to mitigate all possible additional costs [21]. Regarding the data context, there would be w several utilities, and there is no mandate to have volume and price as utilities.
Norm-Utility Weighted Average
The Norm-Utility (nU) Weighted Average often estimates how far the norm-utility is influencing the utility gain that confirms the true average range (ATR) [22] of the corresponding items. The norm-utility weighted average estimation equation is as mentioned below in equation 1.
The exponential moving average (EMA) is like the simple moving average model to enable the direction over the period. However, the key difference with EMA is how the model takes more weightage to the current data than given equal weightage to all the data equally. As the calculations of the EMA are unique, it helps in following the prices or profits more relatively than the simple average model [23].
For the proposed model, the EMA approach is chosen to ensure weightage to the recent transactions pattern rather than the overall transactions pattern for weightage. For instance, in the case of certain itemsets, certain weeks might have more demand and few weeks of the month has less demand. Thus, to curtail such base deviations, the scope of EMA can be highly resourceful.
In equation 2 above, the notation nUWA P denotes the present norm-utility weighted-average of the present interval p, the notation ema(p-1) denotes the exponential moving average of the previous interval (p - 1), and the other notation esc denotes exponential smoothing constant, which is the last x number of intervals. If the exponential moving average of the previous interval ema(p-1) is not available, then the standard moving average shall be considered.
This section portrays the quasi illustration of the proposed model, which is described in the following description.
The notation I denotes all possible itemsets {S1, S2, S3, …, S i , Si+1, …, S|I|} of the given corpus of data, which is ordered in ascending itemset size. Let the notation nUM map the norm-utility of diversified intervals (usually, intervals can be days, weeks, or months, which can also be hours, minutes if the transaction records are from streaming corpus). Each entry of the map nUWAM contains itemset S i as a key, and a vector contains norm-utilities of different intervals of the count iC, which is also considered as vector size. This map is the input to assess the utility gain of each itemset. The norm-utility weighted-average for an interval shall be estimated as follows:
The notation S i denotes the itemset of variable size |S i |, the notation nU denotes norm-utility, and the notation gU denotes the utility gain. The norm-utility weighted average of each item set for each interval represents as a map nUWAM that represents by the first column of each row, and the rest columns of each row refer to the vector of norm-utility weighted-averages of different intervals (Fig. 2).
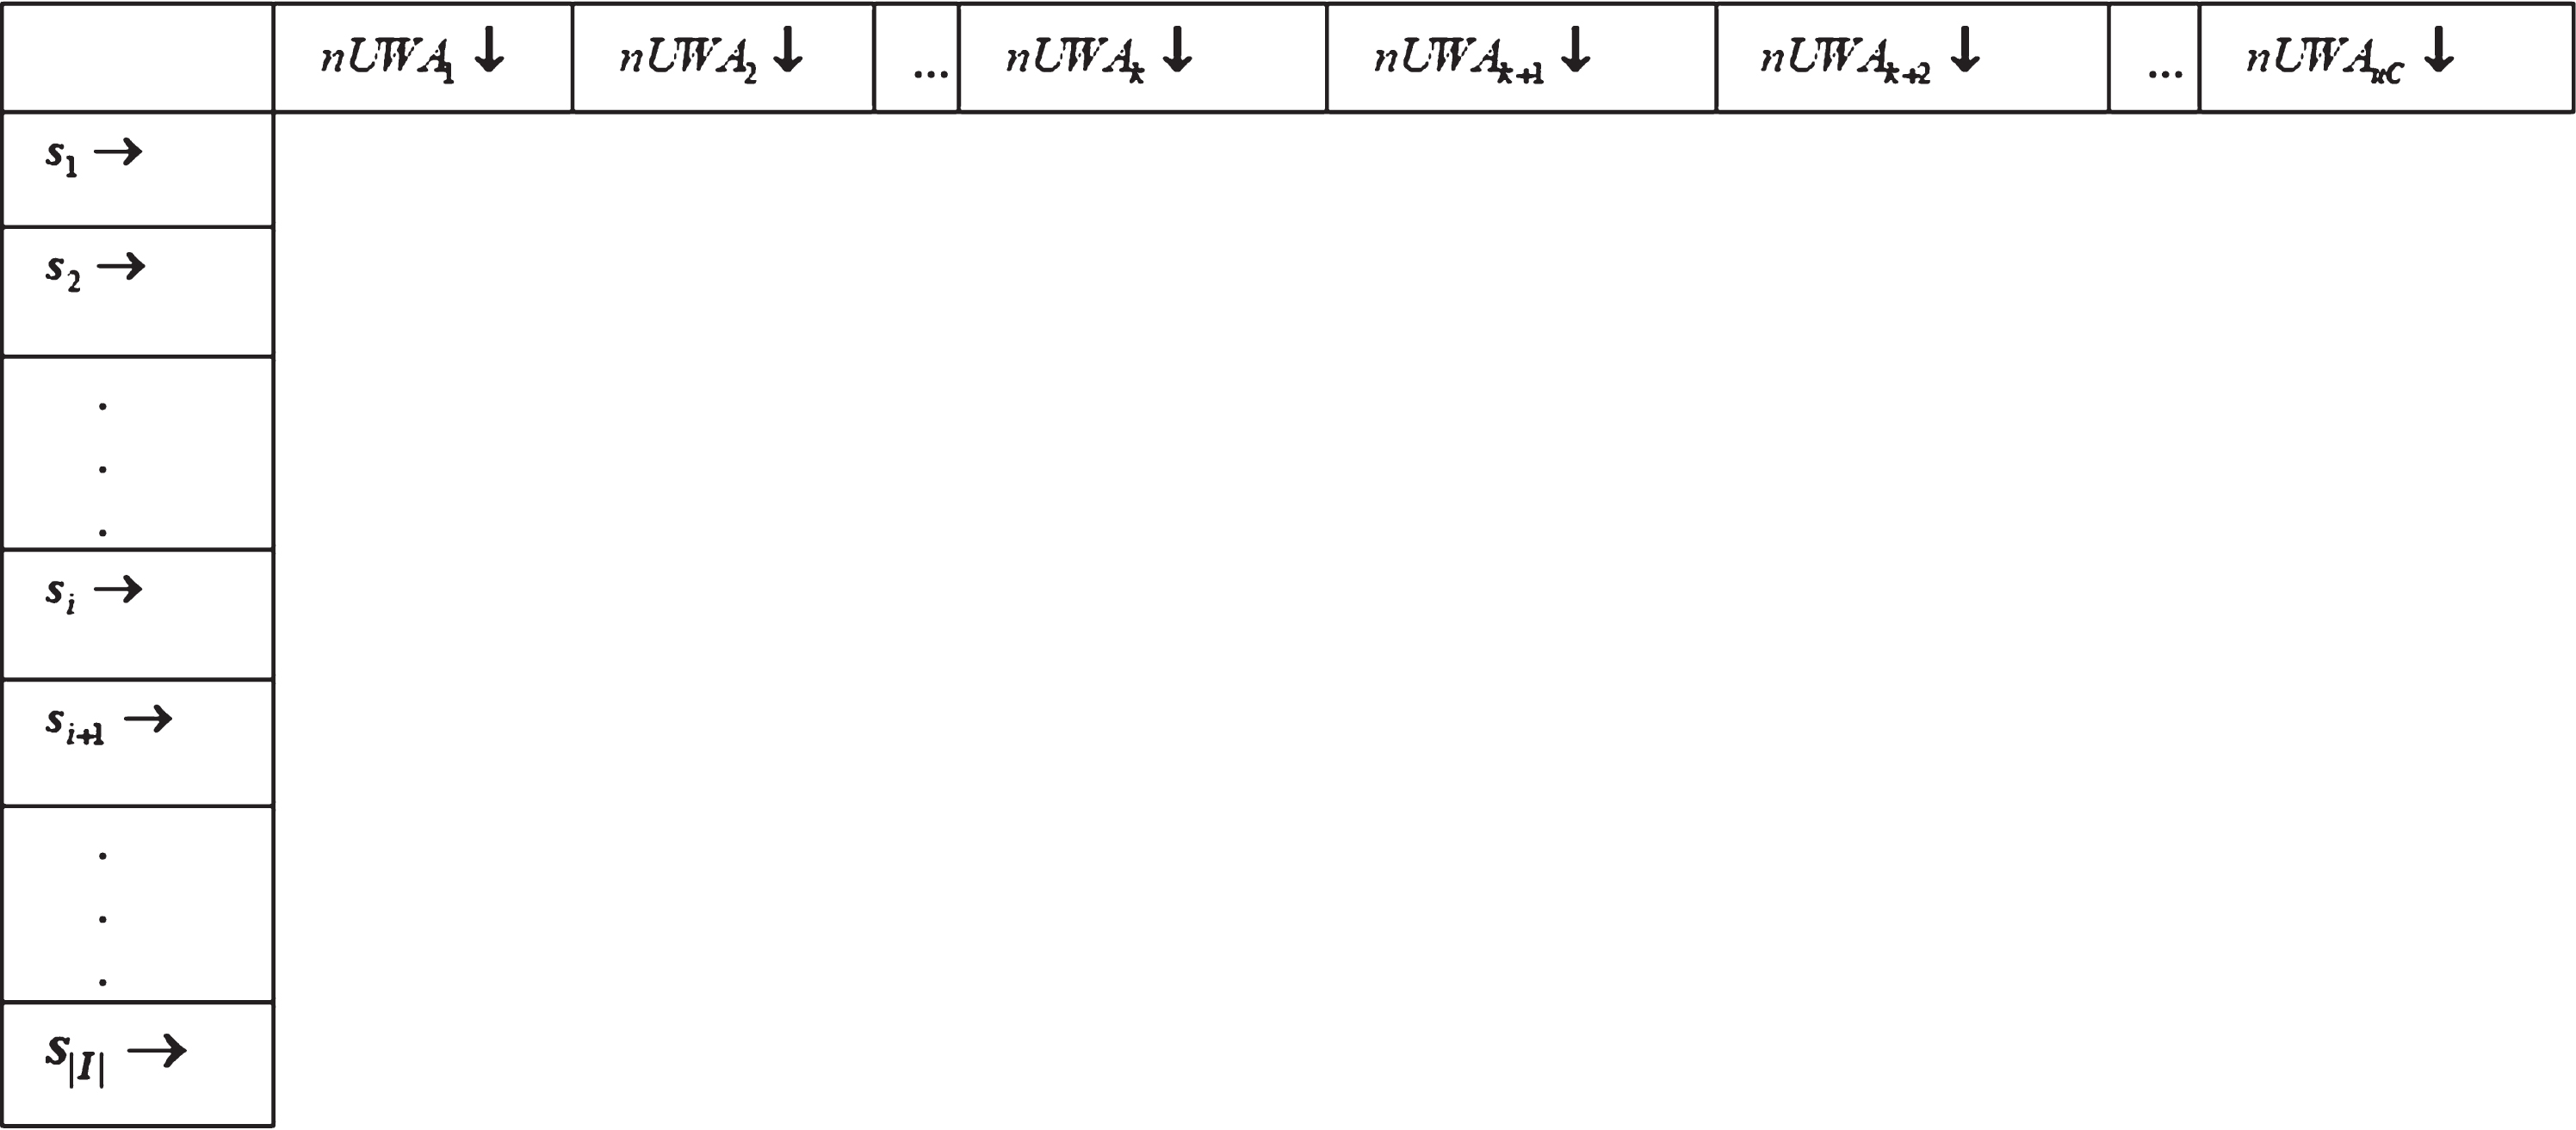
Map representation of Norm-Utility Weighted Averages of each itemset for different intervals.

Map representation of exponential moving averages of each itemset for each interval.
In terms of empirical analysis of the model, the following are some of the key estimations in the project conditions to assess the project’s success.
In total, 100 sets of items from the merchandise are considered for the study. For each item set, the norm-utility weighted average is estimated as per the formulae mentioned above. Accordingly, the EMA value of the n intervals, which often terms as a golden ratio Table 1.
The golden ratios
The golden ratios
Figure 4 in the grade-1 recommendation, wherein the current IVWA is higher than the 56-day average, 44 items from the list are directly considered for the Grade-1 recommendation and can be perceived as the items with higher utility value for the organization.
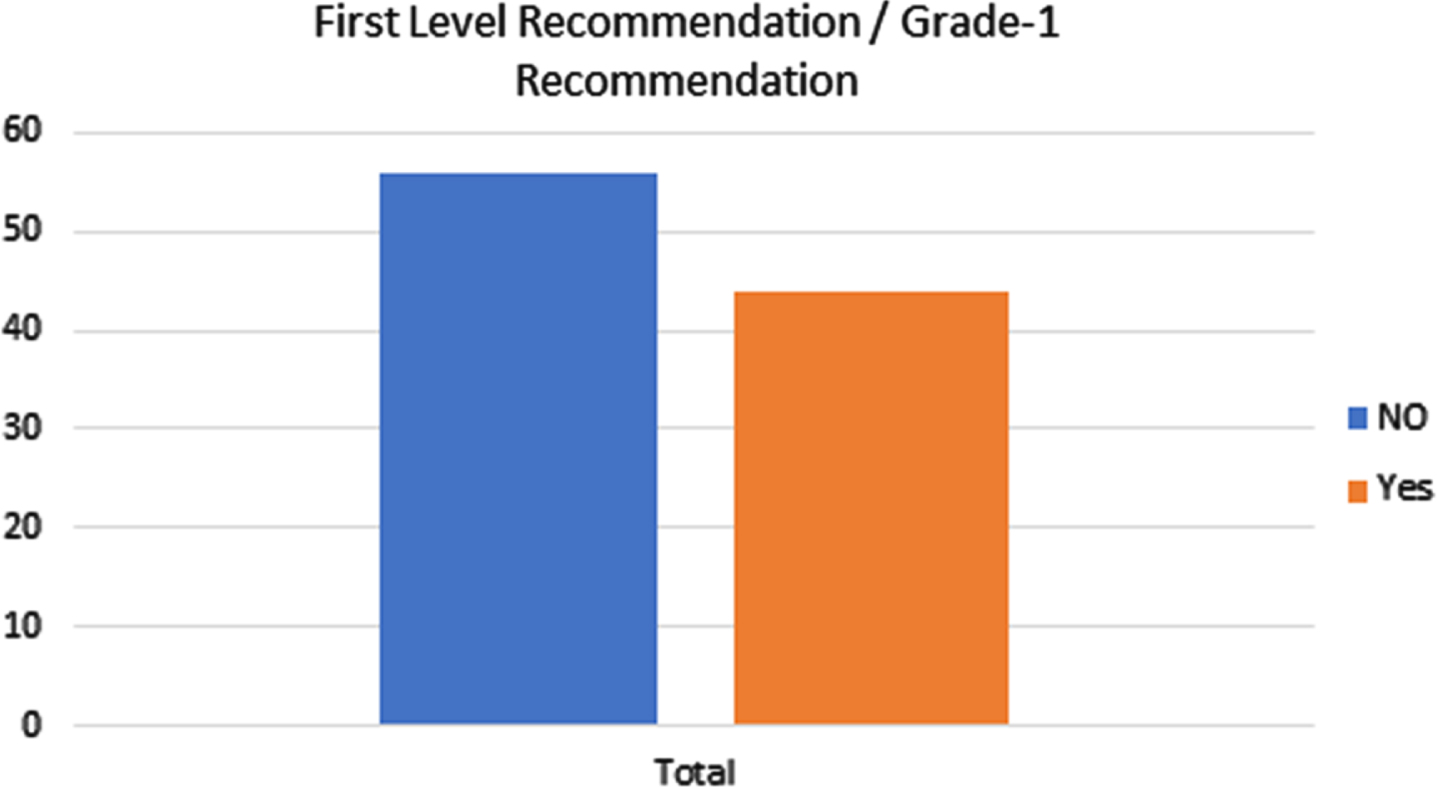
The first level recommendation from the process.
Followed by, for the other 56 items, the different level analysis is carried out, wherein the feasibility ratings for the itemset based on various parameters were evaluated. In line with the analysis, the mean score value of individual items is calculated, and the cumulative mean score value of all the item lists is assessed.
The total cumulative mean value for the product is attained as 3.03. All the pending 56 itemsets are assessed to identify the item list recommended if the individual mean score is higher than the 3.03, and as Not Recommended if the mean score is lower than 3.03. Thus, based on the estimations, there is an equal category of 28 items for both “recommended and not-recommended” that has emerged in the list [24].
Table 2 depicts the itemized numbers that the model shows as the “Recommended” and the ones depicted as “non-Recommended.”
The itemized numbers that the model shows as the “Recom-mended” and the ones that are depicted as “non-recommended
Thus, overall, 70 items are recommended as the potential items or the utility items for merchandising, and the rest of the items are advocated as “non-recommendation” items. Based on the category of the products or merchandise nature, any number of features can be incorporated into the model as inclusion into multiple objectives [25]. By adopting the proposed solution, it is evident that there is an appropriate range of elimination to the process is significant.
The datasets
The simulation study conducted on several fusion available datasets as in [26]. For measuring the superiority of projected FDUF-HUM, outcomes attained have been compared to outcomes attained from other existing approaches known “High Utility Pattern Mining under Multiple Utility Objectives (HUPM-MUO)” [27], and “A multi-objective evolutionary approach for mining frequent and high utility itemsets (MOEA-FHUI)” [15]. In HUPM-MUO modle, multiple utility objectives such as profit, storage, salability, durability, maintainability have been considered. However, The algorithm is not flixeble with regarding the utility factors and the way of chosing them to filtter the items for recommendation.
The datasets utilized in this simulation study as well as their characteristics the count of overall records of the fusion of multiple datasets is 1617267 of variable size. However, none of these records have default utility values. Hence, we synthesize seven diversified utilities and given values to these utilities about corresponding records of the dataset. The overall itemsets generated from the given dataset are 21794. Among these, 14206 are having multi-objective high utility (positives), and 7588 itemsets are having the low utility of multiple utility objectives. The cross-validation results description follows.
The conditions under which the average and deviation values for different parameters are examined for all three models utilised for comparison analysis are outlined in Table 3 below. Precision, specificity, sensitivity, accuracy, f-measure, MCC mean values linked mean value, and even variance for the same are evaluated in important ways based on the descriptive statistics of the datasets employed.
The mean and deviation of the assessment metric values depicted from multi-fold cross-validation
The mean and deviation of the assessment metric values depicted from multi-fold cross-validation
The standard deviation evaluation might be more significant in terms of simple understanding of the results toward its influence and consistency to the mean values. Low standard deviation denotes situations in which the data is grouped around the mean, whereas high standard deviation denotes conditions in which the data is spread out. The term “standard deviation is closer to zero” refers to data points that are closer to the mean value, whereas any high or low standard deviation refers to data points that are considerably above or below the mean value Table 3.
The simulations conducted on system by a i5 processor possessing CPU 2.4GHz and a memory of 1G. Further, the application of the proposed approach and the existing approaches has been implemented by utilizing java. Moreover, a comparative study has been conducted by utilizing explorative R programming as in [28].
Cross-validation
The conditions under which the average and deviation values for different parameters are examined for all three models utilised for comparison analysis are outlined in Table 3. Precision, specificity, sensitivity, accuracy, f-measure, MCC mean values linked mean value, and even variance for the same are evaluated in important ways based on the descriptive statistics of the datasets employed.
The standard deviation evaluation might be more significant in terms of simple understanding of the results toward its influence and consistency to the mean values. Low standard deviation denotes situations in which the data is grouped around the mean, whereas high standard deviation denotes conditions in which the data is spread out. The term “standard deviation is closer to zero” refers to data points that are closer to the mean value, whereas any high or low standard deviation refers to data points that are considerably above or below the mean value Table 3.
The top-k high mining utility itemsets under several utility objectives were known itemsets with appropriate labels positive (utility is high under multiple utility objectives) and negative (utility is low under multiple utility objectives). Hence, cross-validation has been utilized for measuring the performance of projected and other existing approaches. Moreover, description of cross-validation performance assessment metrics of itemset mining approach in the following way:
In this section, various metrics have been used, such as accuracy, MCC, f-measure, sensitivity, specificity and precision rate to measure the performance of the proposed model FDUF-HUM and contemporary models HUPM-MUO [27] and MOEA-FHUI [15]. over the ten folds.
Precision
In order to measure the performance of the proposed model FDUF-HUM over the contemporary models HUPM-MUO [27] and MOEA-FHUI [15] the metric precision has been used over the ten folds for comparing the proposed model and contemporary models. The mean value of the metric precision observed from 10-fold cross-validation of FDUF-HUM, HUPM-MUO, and MOEA-FHUI are 0.97±0.0023, 0.93±0.0115, and 0.9±0.0174 in respective order. The metric precision can be stated as the ratio of related instances among overall retrieved instances. As shown in Table 4, Fig. 5, it has been exhibited that the performance of the proposed model FDUF-HUM performs better while compared to other contemporary models.
The precision of the comparison of proposed model FDUF-HUM and contemporary models HUPM-MUO and MOEA-FHUI using metric precision over ten folds
The precision of the comparison of proposed model FDUF-HUM and contemporary models HUPM-MUO and MOEA-FHUI using metric precision over ten folds
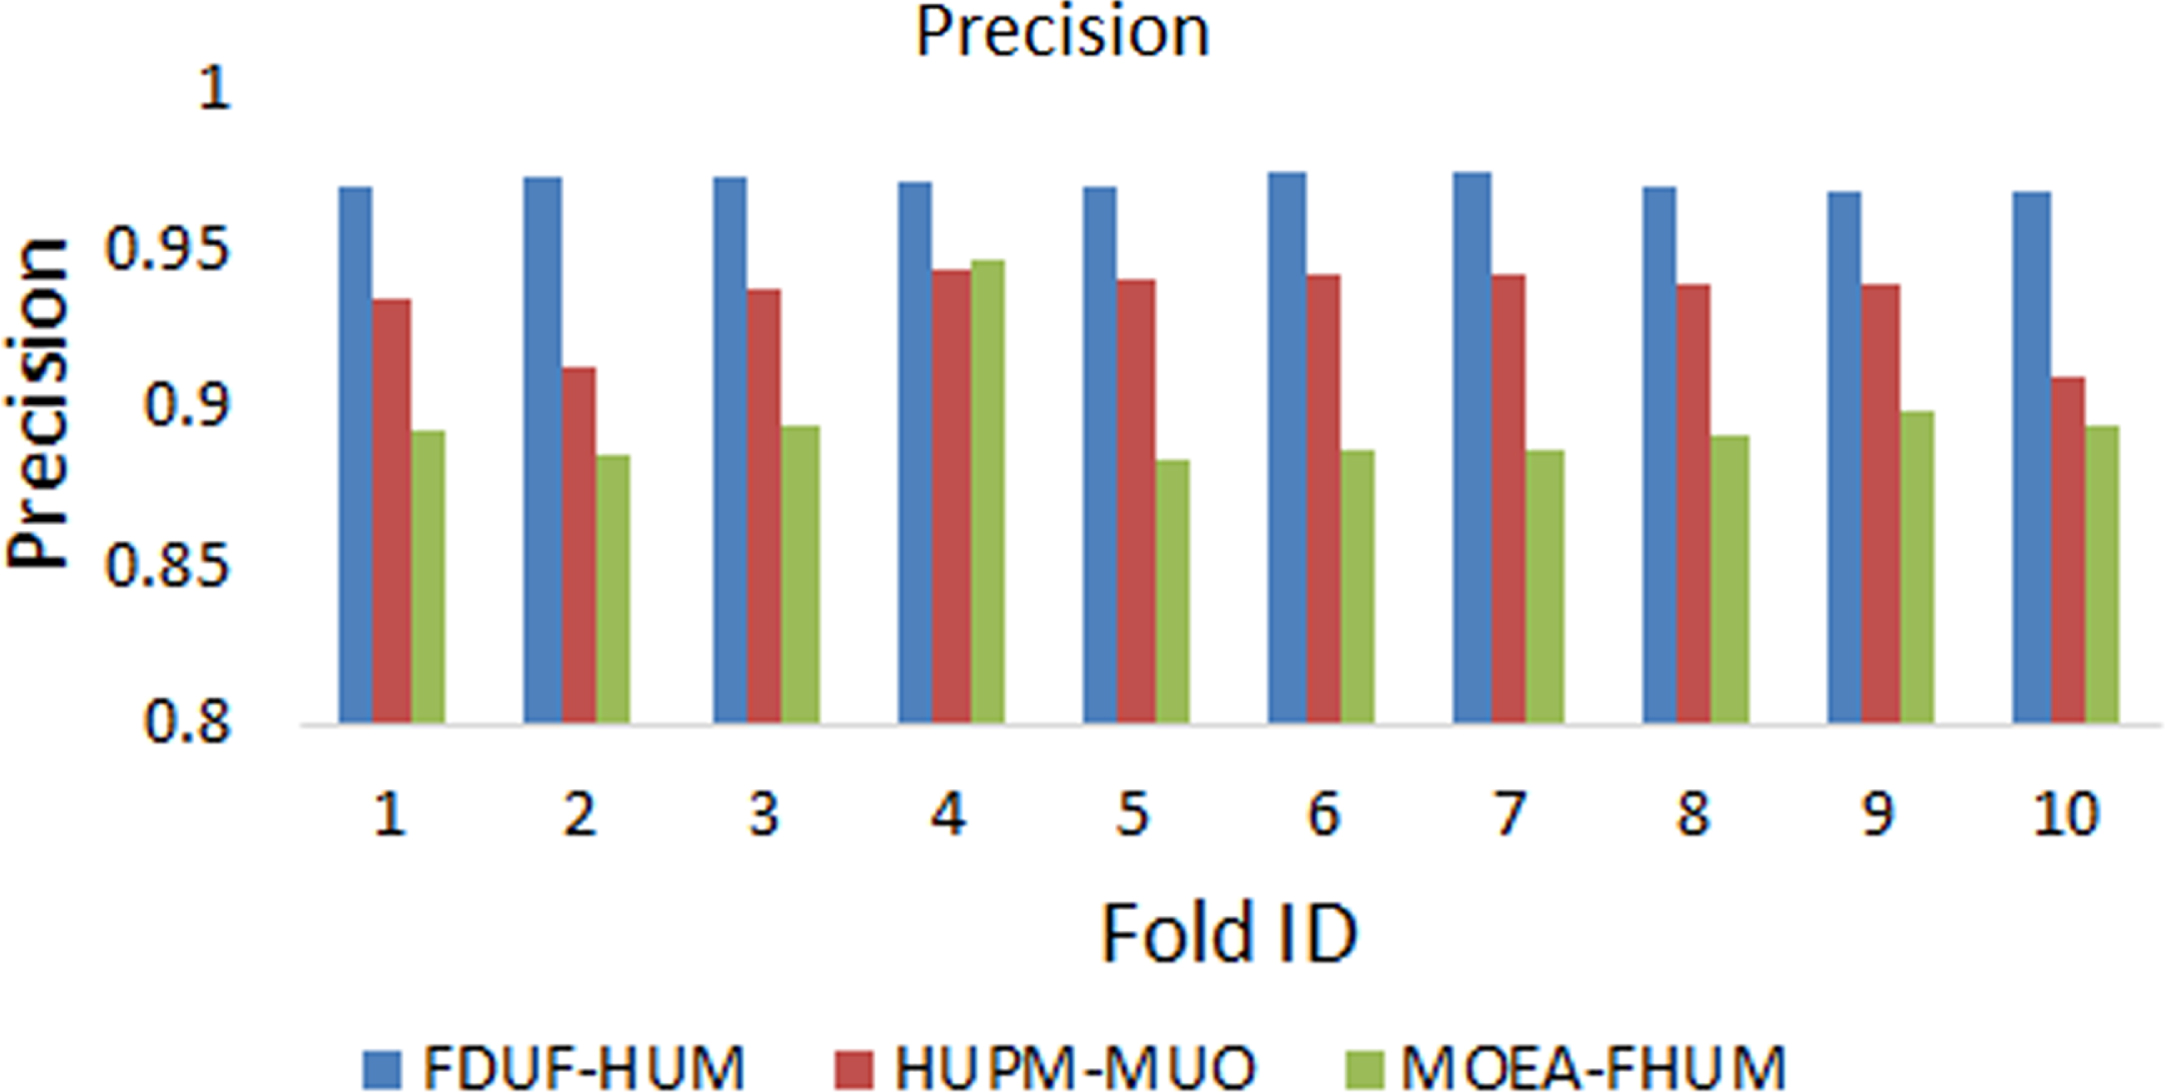
Comparison of proposed model FDUF-HUM and con-temporary models HUPM-MUO and MOEA-FHUI using metric precision over ten folds.
Table 5, Fig. 6 exhibits the graph plotted among metric specificity and ten folds for the proposed model FDUF-HUM and contemporary models HUPM-MUO and MOEA-FHUI. Comparison has been done among projected model and contemporary models over the ten folds. Metric specificity is also known to be selectivity, which is stated as the proportion of true negatives to the actual negatives. The mean value of the metric specificity observed from 10-fold cross-validation of FDUF-HUM, HUPM-MUO, and MOEA-FHUI are 0.95±0.0039, 0.88±0.0217, and 0.82±0.031 in respective order. The performance of metric specificity for the proposed model FDUF-HUM is more superior when compared to contemporary models, as exhibited in the below figure.
The specificity of the comparison of proposed model FDUF-HUM and contemporary models HUPM-MUO and MOEA-FHUI using metric specificity over ten folds
The specificity of the comparison of proposed model FDUF-HUM and contemporary models HUPM-MUO and MOEA-FHUI using metric specificity over ten folds

Comparison of proposed model FDUF-HUM and contemporary models HUPM-MUO and MOEA-FHUI using metric specificity over ten folds.
In order to measure the performance of the proposed model FDUF-HUM over the contemporary models HUPM-MUO and MOEA-FHUI, the metric sensitivity has been used over the ten folds for comparing the proposed model and contemporary models. The metric sensitivity is also termed recall, often defined as the proportion of true positives to the actual positives. The mean value of the metric sensitivity observed from 10-fold cross-validation of FDUF-HUM, HUPM-MUO, and MOEA-FHUI are 0.98±0.0074, 0.89±0.0218, and 0.84±0.0358 in respective order. As shown in Table 6, Fig. 7, it has been exhibited that the performance of the proposed model FDUF-HUM added a more advantage while compared to other contemporary models.
The sensitivity of the comparison of proposed model FDUF-HUM and contemporary models HUPM-MUO and MOEA-FHUI using metric sensitivity over ten folds
The sensitivity of the comparison of proposed model FDUF-HUM and contemporary models HUPM-MUO and MOEA-FHUI using metric sensitivity over ten folds

Comparison of proposed model FDUF-HUM and contemporary models HUPM-MUO and MOEA-FHUI using metric sensitivity over ten folds.
Table 7, Fig. 8 represents the graph plotted among metric accuracy and ten folds for the proposed model FDUF-HUM and contemporary models HUPM-MUO and MOEA-FHUI. Comparison has been done among projected model and contemporary models over the ten folds. The mean value of the metric accuacy observed from 10-fold cross-validation of FDUF-HUM, HUPM-MUO, and MOEA-FHUI are 0.97±0.0064, 0.89±0.017, and 0.83±0.029 in respective order. The performance of metric accuracy for the proposed model FDUF-HUM is more superior when compared to contemporary models, as exhibited in the above figure.
The accuracy of the comparison of proposed model FDUF-HUM and contemporary models HUPM-MUO and MOEA-FHUI using metric accuracy over ten folds
The accuracy of the comparison of proposed model FDUF-HUM and contemporary models HUPM-MUO and MOEA-FHUI using metric accuracy over ten folds
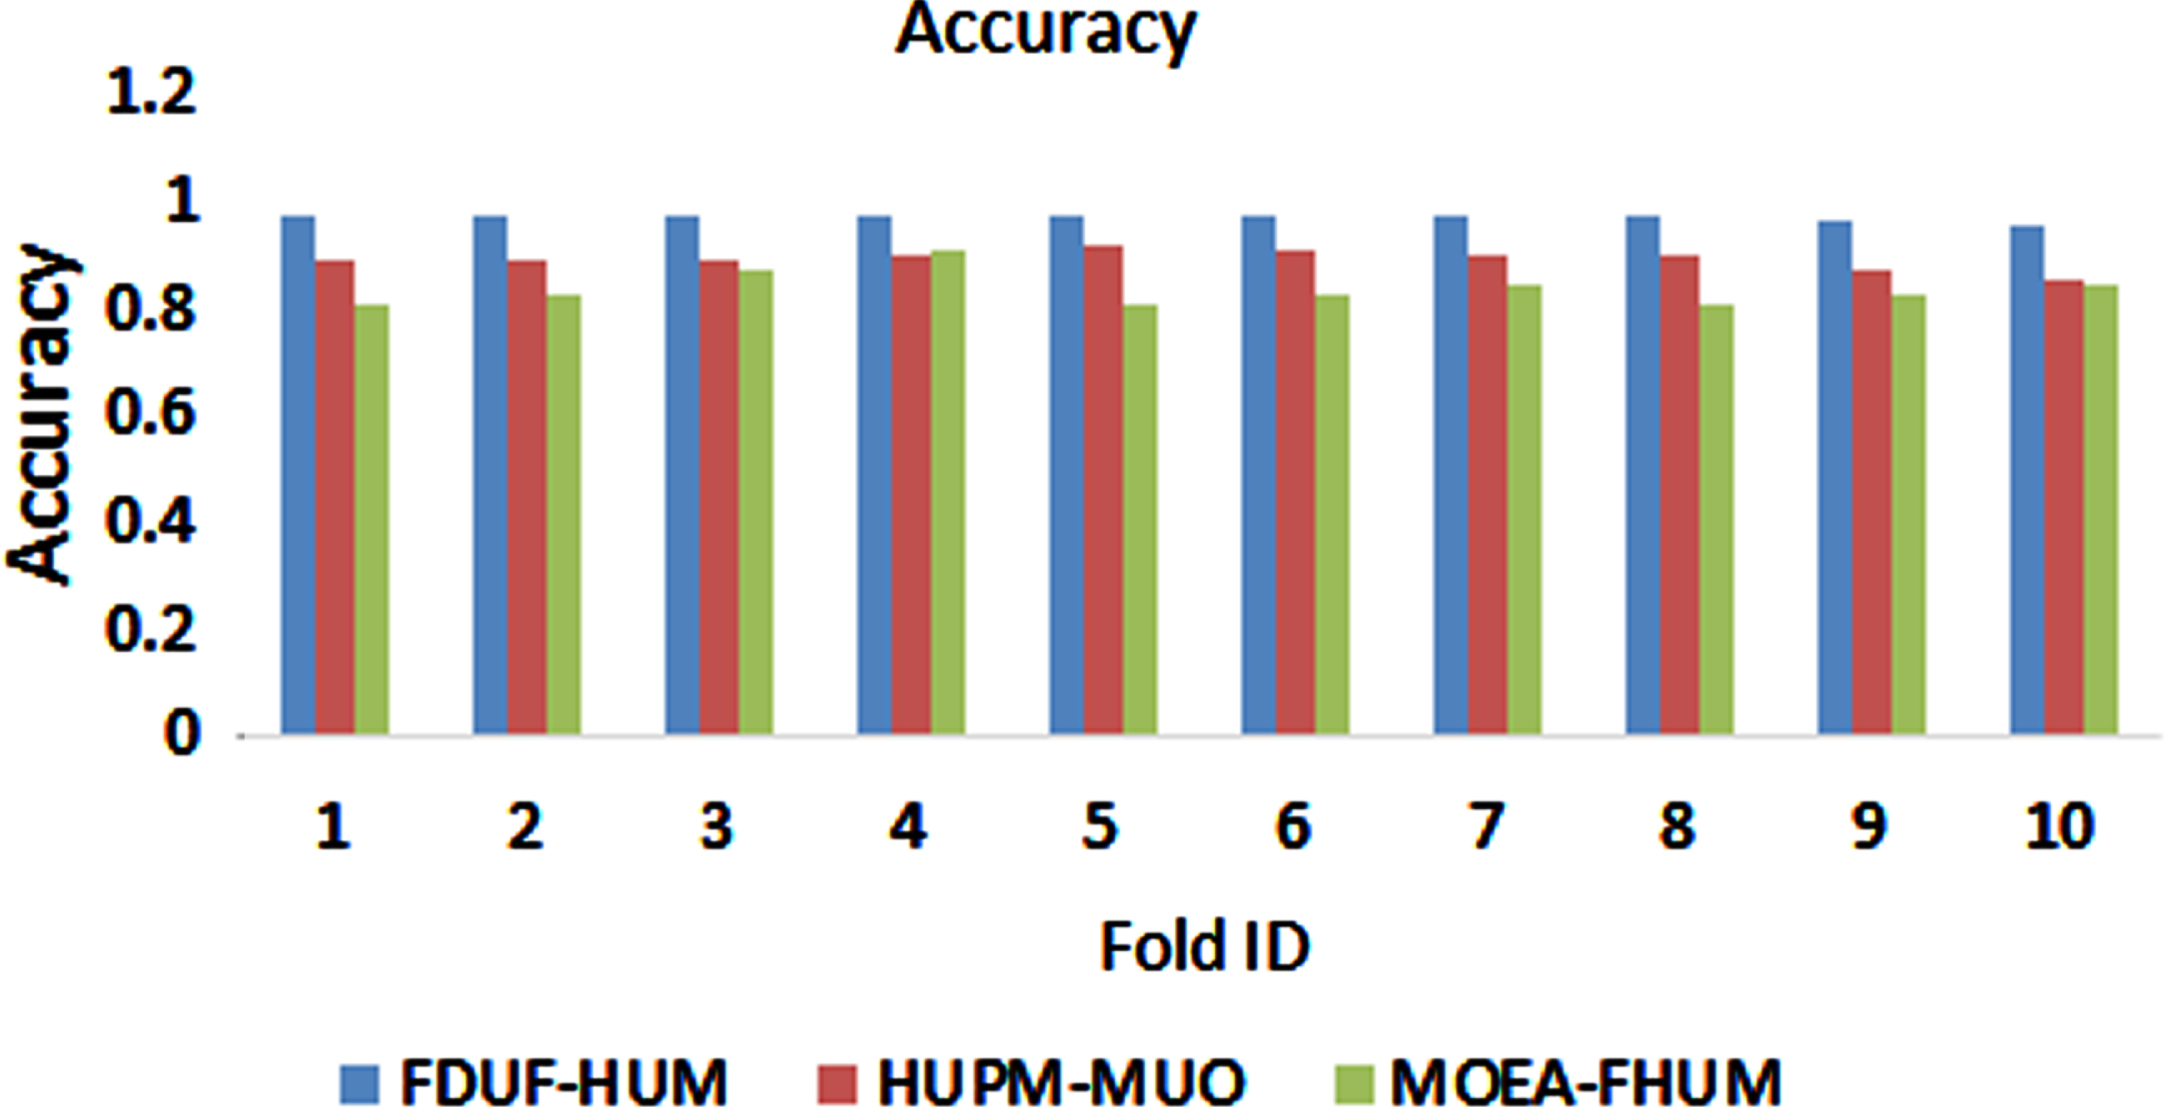
Comparison of proposed model FDUF-HUM and contemporary models HUPM-MUO and MOEA-FHUI using metric accuracy over ten folds.
To measure the performance of the proposed model FDUF-HUM over the contemporary models HUPM-MUO and MOEA-FHUI, the metric F-measure has been used over the ten folds for comparing the proposed model and contemporary models. The metric sensitivity is also termed the F1 score, often defined as the harmonic mean of sensitivity and precision. The mean value of the metric F-measure observed from 10-fold cross-validation of FDUF-HUM, HUPM-MUO, and MOEA-FHUI are 0.96±0.0032, 0.91±0.0169, and 0.85±0.0246 in respective order. As shown in Table 8, Fig. 9, it has been exhibited that the performance of the proposed model FDUF-HUM added a more advantage while compared to other contemporary models.
The F-measure of the comparison of proposed model FDUF-HUM and contemporary models HUPM-MUO and MOEA-FHUI using metric F-measure over ten folds
The F-measure of the comparison of proposed model FDUF-HUM and contemporary models HUPM-MUO and MOEA-FHUI using metric F-measure over ten folds
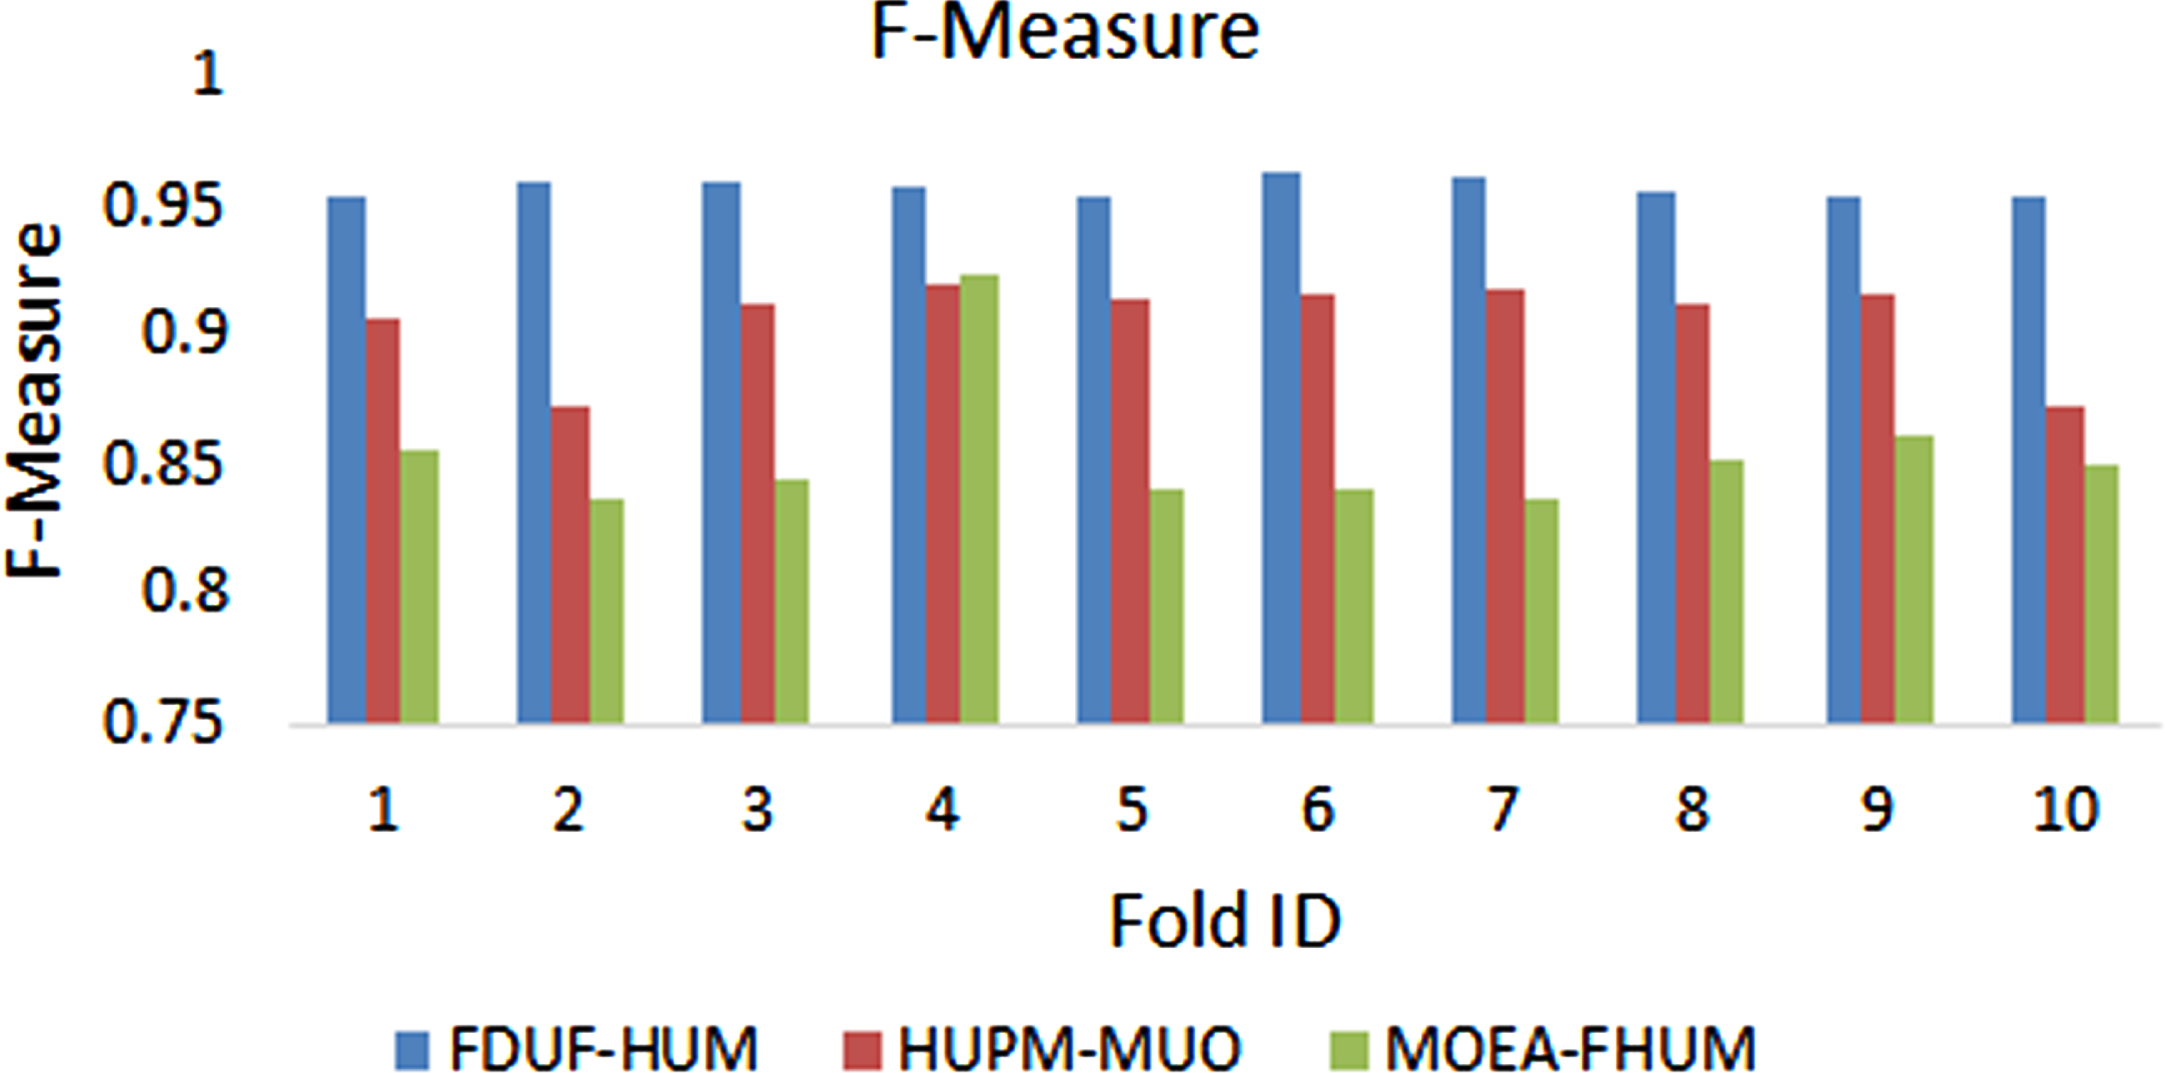
Comparison of proposed model FDUF-HUM and contemporary models HUPM-MUO and MOEA-FHUI using metric F-measure over ten folds.
The other metric to measure the performance of the proposed model FDUF-HUM over the contemporary models HUPM-MUO and MOEA-FHUI is MCC, which has been used over the ten folds for comparing the proposed model and contemporary models. The mean value of the metric matthews correlation coefficient observed from 10-fold cross-validation of FDUF-HUM, HUPM-MUO, and MOEA-FHUI are 0.94±0.0209, 0.76±0.0344, and 0.65±0.0577 in respective order. As shown in Table 9, Fig. 10, it has been exhibited that the performance of the proposed model FDUF-HUM added a more advantage while compared to other contemporary models.
The Matthews Correlation Coefficient of the comparison of proposed model FDUF-HUM and contemporary models HUPM-MUO and MOEA-FHUI using metric MCC over ten folds
The Matthews Correlation Coefficient of the comparison of proposed model FDUF-HUM and contemporary models HUPM-MUO and MOEA-FHUI using metric MCC over ten folds
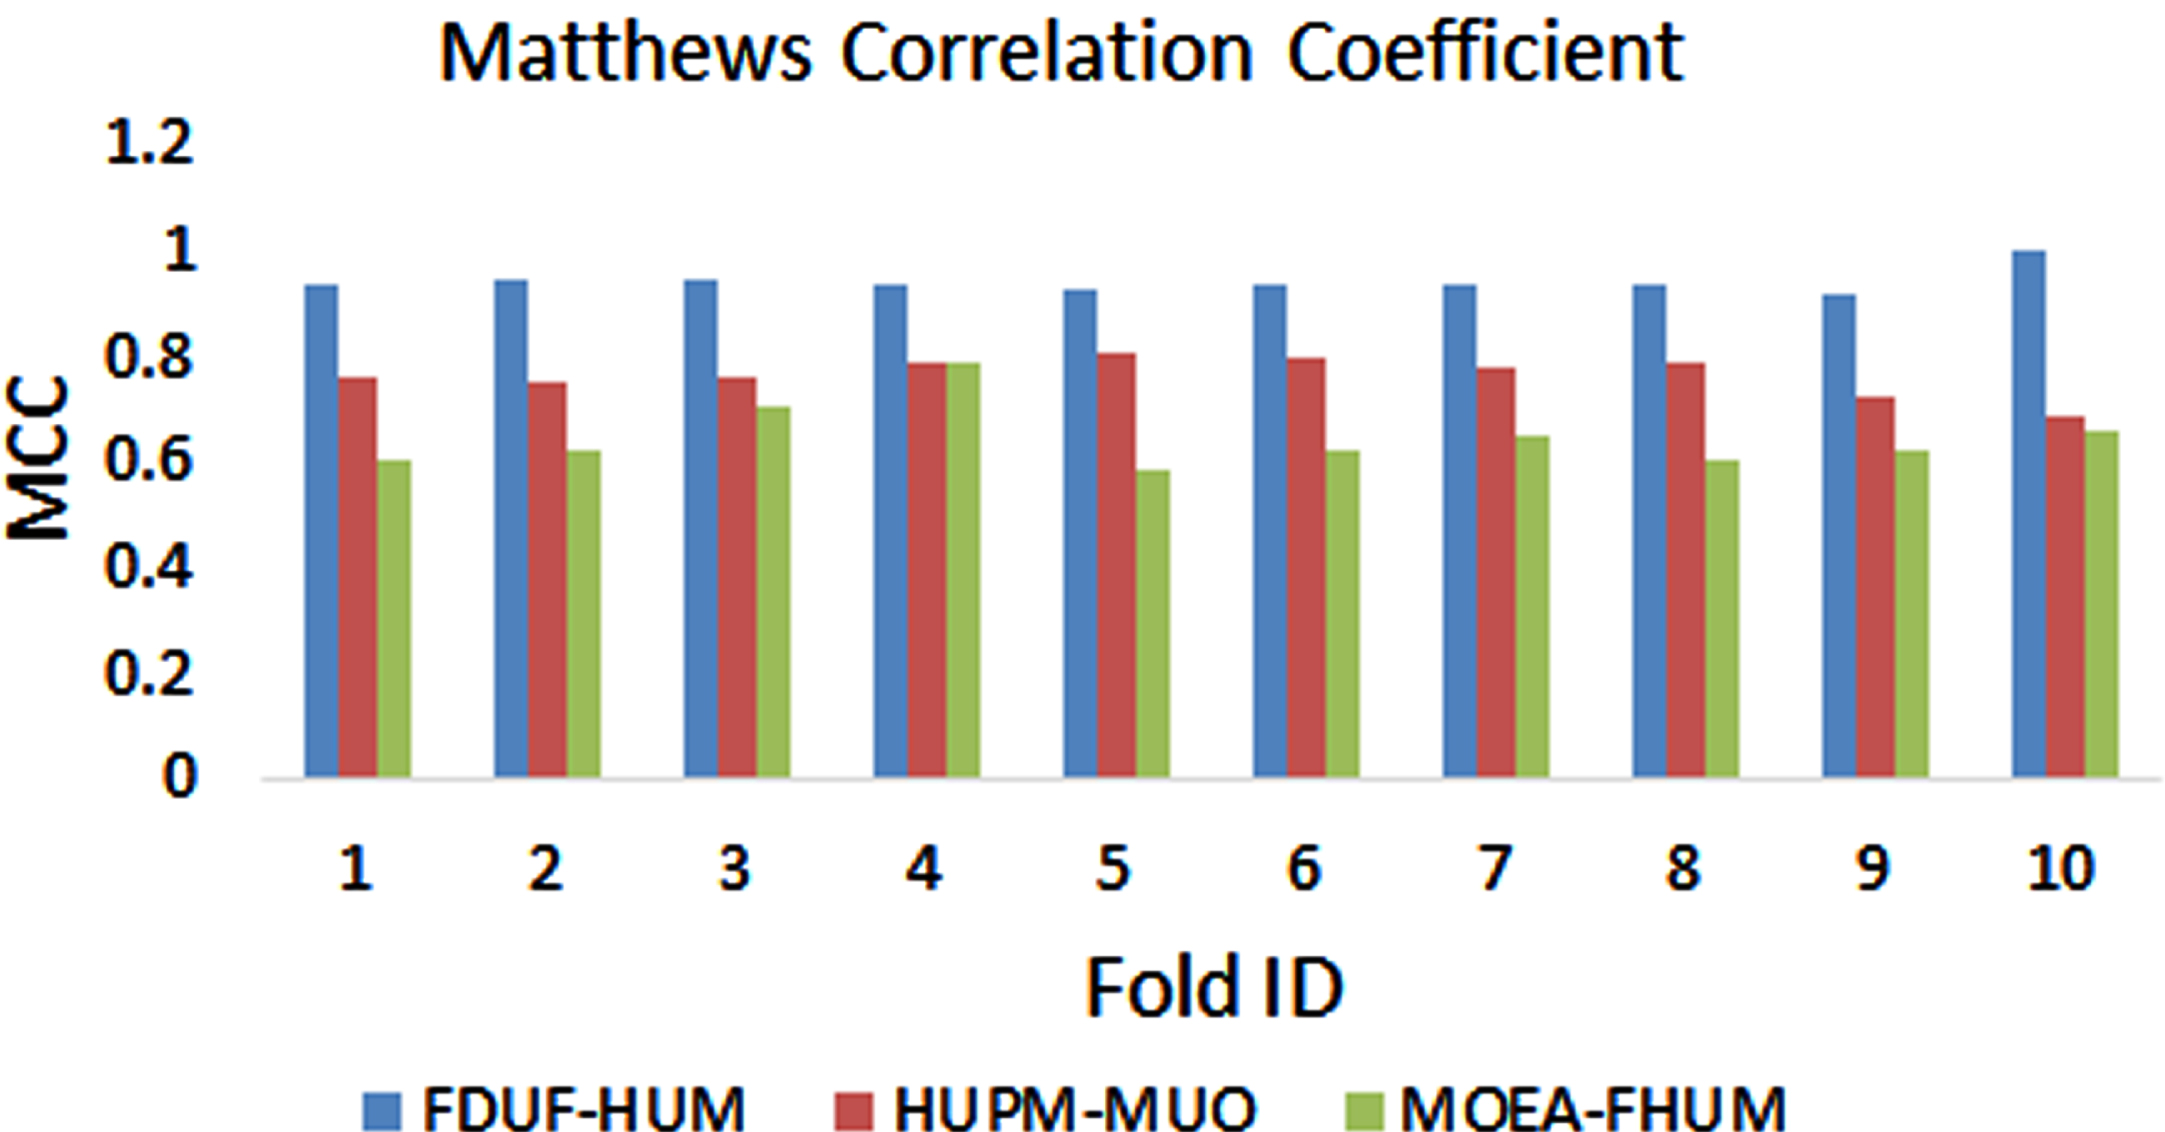
Comparison of proposed model FDUF-HUM and contemporary models HUPM-MUO and MOEA-FHUI using metric MCC over ten folds.
High utility mining is gaining importance as the merchandise conditions are becoming highly competitive, and the margin for errors for the organizations is low. In the case of the utility mining process, various factors have an impact directly or indirectly on the conditions. If the right kind of development like the multi-objective screening is carried out, it can help accomplish the process. Eying at the multi-objective high utility mining process, in this manuscript, a contemporary solution relying on the weighted and exponential averages is discussed. The experimental study of the model indicates a potential and rational approach for filtering the itemsets from being recommended, and it can help in achieving the right kind of solutions. The perforamce analysis by multi-fold cross validation exhibiting that the proposed FDUF-HUM has outperformed the contemporary models with subsequent statistics of the corss validation metrics. For FDUF-HUM, HUPM-MUO, and MOEA-FHUM, the precision values observed are 0.97 ± 0.0023, 0.93 ± 0.0115, and 0.90 ± 0.0174 in respective order. Similarly values observed for other metrics from these proposed and contemporary models are, Specificity: 0.95 ± 0.0039, 0.88 ± 0.0217, and 0.82 ± 0.031, sensitivity: 0.98 ± 0.0074, 0.89 ± 0.0218, and 0.84 ± 0.0358, accuracy: 0.97 ± 0.0064, 0.89 ± 0.017, and 0.83 ± 0.029. The resultant values of these cross validation metrics are exhibiting that the proposed FDUF-HUM is having potential performance competency that compared to the contemporary models HUPM-MUO, and MOEA-FHUM. The other key advantage of the proposed model is flexibility in changing the metrics that could be considered for scaling the itemsets analysis, depending on the context and category of merchandise.